| Param | Original file | Final file |
|---|---|---|
| Filename | modeM0/AS1A09_038T43_9000004946cztM0_level2.fits | modeM0/AS1A09_038T43_9000004946cztM0_level2_quad_clean.evt |
| Size (bytes) | 58,844,160 | 80,484,480 |
| Size | 56.1 MB | 76.8 MB |
| Events in quadrant A | 361,804 | 540,882 |
| Events in quadrant B | 336,044 | 513,556 |
| Events in quadrant C | 353,022 | 509,381 |
| Events in quadrant D | 289,774 | 431,802 |
| Mode M0 | |||
|---|---|---|---|
| Quadrant | BADHDUFLAG | Total packets | Discarded packets |
| A | 0 | 12839 | 0 |
| B | 0 | 16168 | 0 |
| C | 0 | 13503 | 0 |
| D | 0 | 28840 | 0 |
| Mode SS | |||
|---|---|---|---|
| Quadrant | BADHDUFLAG | Total packets | Discarded packets |
| A | 0 | 130 | 0 |
| B | 0 | 130 | 0 |
| C | 0 | 130 | 0 |
| D | 0 | 130 | 0 |
| Mode M9 | |||
|---|---|---|---|
| Quadrant | BADHDUFLAG | Total packets | Discarded packets |
| A | 0 | 19 | 0 |
| B | 0 | 19 | 0 |
| C | 0 | 19 | 0 |
| D | 0 | 19 | 0 |
| Quadrant | Total seconds | Saturated seconds | Saturation percentage |
|---|---|---|---|
| A | 6325 | 10 | 0.158103% |
| B | 6325 | 333 | 5.264822% |
| C | 6325 | 21 | 0.332016% |
| D | 6325 | 482 | 7.620553% |
Noise dominated data is calculated using 1-second bins in cleaned event files. If a bin has >2000 counts, and if more than 50% of those come from <1% of pixels, then it is considered to be noise-dominated and hence unusable.
| Quadrant | # 1 sec bins | Bins with >0 counts | Bins with >2000 counts | High rate bins dominated by noise | Noise dominated (total time) | Noise dominated (detector-on time) | Marked lightcurve |
|---|---|---|---|---|---|---|---|
| A | 7938 | 6325 | 0 | 0 | 0.00% | 0.00% |  |
| B | 7938 | 6317 | 0 | 0 | 0.00% | 0.00% |  |
| C | 7938 | 6325 | 0 | 0 | 0.00% | 0.00% | 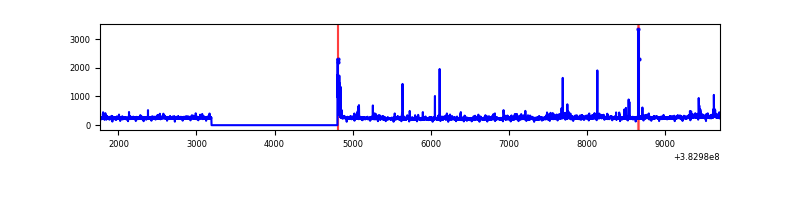 |
| D | 7938 | 6313 | 0 | 0 | 0.00% | 0.00% | 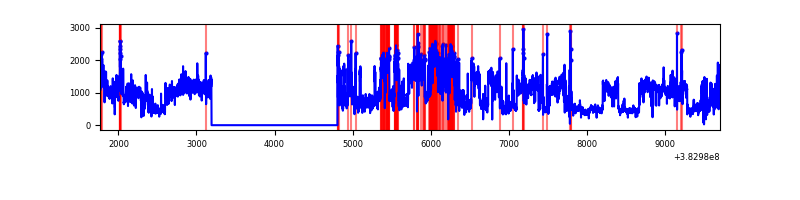 |
Top three noisy pixels from each quadrant. If the there are fewer than three noisy pixels in the level2.evt file, extra rows are filled as -1
| Pixel properties | Quadrant properties | ||||||
|---|---|---|---|---|---|---|---|
| Quadrant | DetID | PixID | Counts | Sigma | Mean | Median | Sigma |
| A | 9 | 19 | 290 | 8.03 | 94 | 89 | 25.0 |
| A | 7 | 110 | 273 | 7.35 | 94 | 89 | 25.0 |
| A | 15 | 236 | 265 | 7.03 | 94 | 89 | 25.0 |
| B | 2 | 9 | 305 | 11.27 | 89 | 85 | 19.5 |
| B | 3 | 80 | 299 | 10.96 | 89 | 85 | 19.5 |
| B | 2 | 8 | 254 | 8.66 | 89 | 85 | 19.5 |
| C | 1 | 81 | 288 | 7.78 | 93 | 88 | 25.7 |
| C | 1 | 80 | 267 | 6.97 | 93 | 88 | 25.7 |
| C | 7 | 233 | 238 | 5.84 | 93 | 88 | 25.7 |
| D | 7 | 3 | 217 | 5.96 | 82 | 75 | 23.8 |
| D | 6 | 83 | 217 | 5.96 | 82 | 75 | 23.8 |
| D | 10 | 113 | 211 | 5.7 | 82 | 75 | 23.8 |
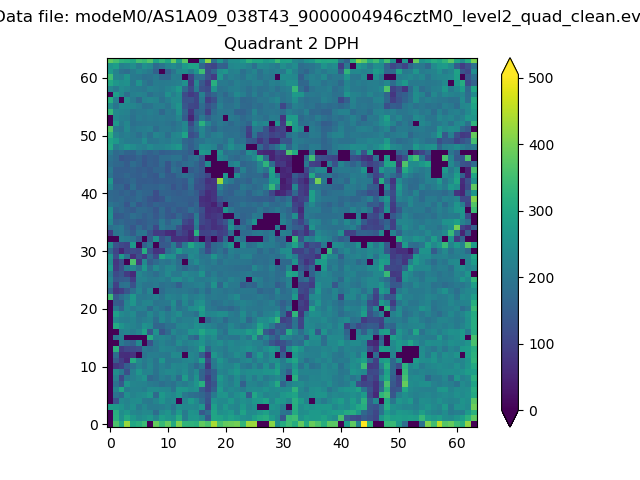
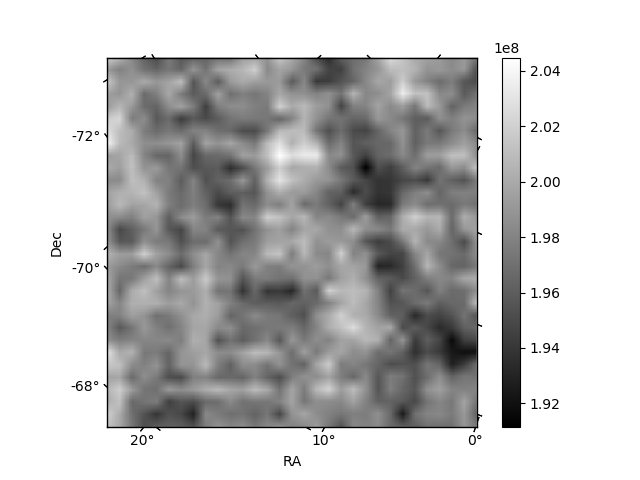
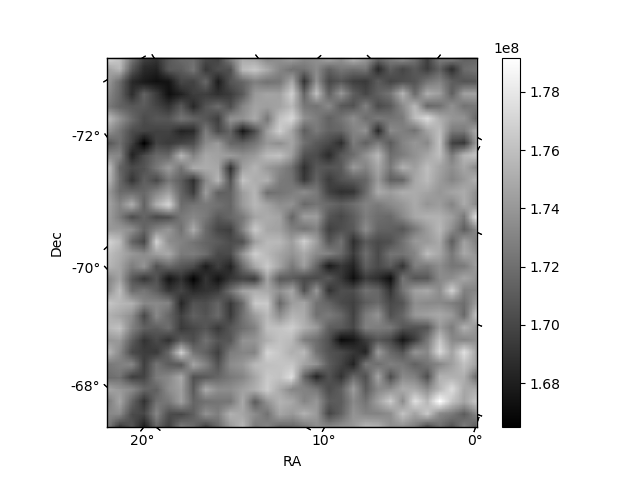
Histogram calculated using DETX and DETY for each event in the final _common_clean file
| Quadrant A |  |
 |
Quadrant B |
|---|---|---|---|
| Quadrant D |  |
 |
Quadrant C |
| Plot type | Count rate plots | Images |
|---|---|---|
| Comparison with Poisson distribution Blue bars denote a histogram of data divided into 1 sec bins. Red curve is a Poisson curve with rate = median count rate of data. |
 |
 |
| Quadrant-wise count rates Data is divided into 100 sec bins |
 |
|
| Module-wise count rates for Quadrant A Data is divided into 100 sec bins |
 |
 |
| Module-wise count rates for Quadrant B Data is divided into 100 sec bins |
 |
 |
| Module-wise count rates for Quadrant C Data is divided into 100 sec bins |
 |
 |
| Module-wise count rates for Quadrant D Data is divided into 100 sec bins |
 |
 |
| Parameter | Plot |
|---|---|
| CZT HV Monitor |  |
| D_VDD |  |
| Temperature 1 |  |
| Veto HV Monitor |  |
| Veto LLD | 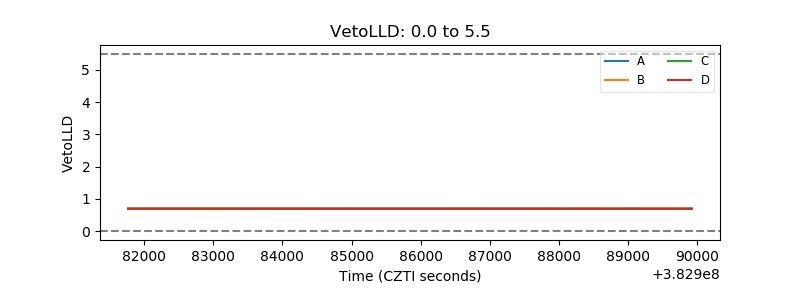 |
| Alpha Counter |  |
| _CPM_Rate |  |
| CZT Counter |  |
| +2.5 Volts monitor |  |
| +5 Volts monitor |  |
| _ROLL_ROT | 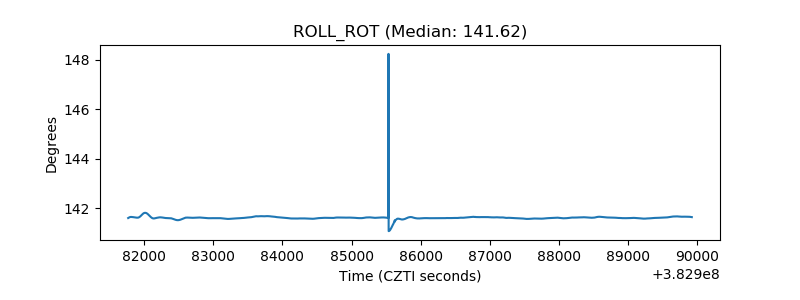 |
| _Roll_DEC |  |
| _Roll_RA |  |
| Veto Counter |  |