| Param | Original file | Final file |
|---|---|---|
| Filename | modeM0/AS1A09_038T44_9000004948cztM0_level2.fits | modeM0/AS1A09_038T44_9000004948cztM0_level2_quad_clean.evt |
| Size (bytes) | 53,712,000 | 81,072,000 |
| Size | 51.2 MB | 77.3 MB |
| Events in quadrant A | 329,934 | 560,392 |
| Events in quadrant B | 309,504 | 546,768 |
| Events in quadrant C | 319,344 | 525,611 |
| Events in quadrant D | 248,962 | 403,323 |
| Mode M0 | |||
|---|---|---|---|
| Quadrant | BADHDUFLAG | Total packets | Discarded packets |
| A | 0 | 12249 | 0 |
| B | 0 | 14760 | 0 |
| C | 0 | 12924 | 0 |
| D | 0 | 29851 | 0 |
| Mode M9 | |||
|---|---|---|---|
| Quadrant | BADHDUFLAG | Total packets | Discarded packets |
| A | 0 | 20 | 0 |
| B | 0 | 20 | 0 |
| C | 0 | 20 | 0 |
| D | 0 | 21 | 0 |
| Mode SS | |||
|---|---|---|---|
| Quadrant | BADHDUFLAG | Total packets | Discarded packets |
| A | 0 | 122 | 0 |
| B | 0 | 122 | 0 |
| C | 0 | 122 | 0 |
| D | 0 | 122 | 0 |
| Quadrant | Total seconds | Saturated seconds | Saturation percentage |
|---|---|---|---|
| A | 5991 | 18 | 0.300451% |
| B | 5991 | 185 | 3.087965% |
| C | 5991 | 39 | 0.650976% |
| D | 5991 | 1033 | 17.242530% |
Noise dominated data is calculated using 1-second bins in cleaned event files. If a bin has >2000 counts, and if more than 50% of those come from <1% of pixels, then it is considered to be noise-dominated and hence unusable.
| Quadrant | # 1 sec bins | Bins with >0 counts | Bins with >2000 counts | High rate bins dominated by noise | Noise dominated (total time) | Noise dominated (detector-on time) | Marked lightcurve |
|---|---|---|---|---|---|---|---|
| A | 7273 | 5989 | 0 | 0 | 0.00% | 0.00% |  |
| B | 7273 | 5989 | 0 | 0 | 0.00% | 0.00% |  |
| C | 7272 | 5989 | 0 | 0 | 0.00% | 0.00% | 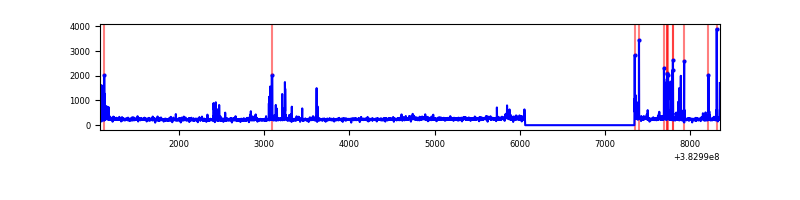 |
| D | 7273 | 5956 | 0 | 0 | 0.00% | 0.00% | 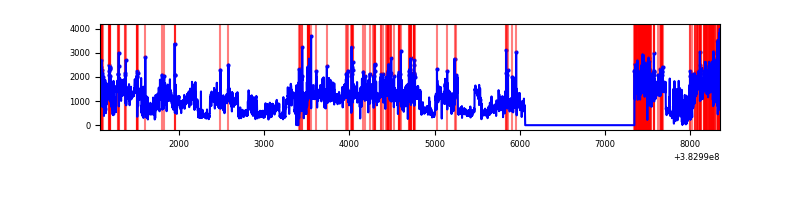 |
Top three noisy pixels from each quadrant. If the there are fewer than three noisy pixels in the level2.evt file, extra rows are filled as -1
| Pixel properties | Quadrant properties | ||||||
|---|---|---|---|---|---|---|---|
| Quadrant | DetID | PixID | Counts | Sigma | Mean | Median | Sigma |
| A | 9 | 19 | 303 | 9.4 | 86 | 81 | 23.6 |
| A | 14 | 79 | 277 | 8.3 | 86 | 81 | 23.6 |
| A | 0 | 29 | 277 | 8.3 | 86 | 81 | 23.6 |
| B | 2 | 9 | 268 | 10.4 | 82 | 78 | 18.3 |
| B | 3 | 80 | 246 | 9.2 | 82 | 78 | 18.3 |
| B | 5 | 232 | 215 | 7.5 | 82 | 78 | 18.3 |
| C | 1 | 81 | 292 | 9.17 | 84 | 79 | 23.2 |
| C | 1 | 80 | 285 | 8.87 | 84 | 79 | 23.2 |
| C | 3 | 203 | 245 | 7.14 | 84 | 79 | 23.2 |
| D | 4 | 160 | 202 | 6.74 | 70 | 64 | 20.5 |
| D | 10 | 113 | 193 | 6.3 | 70 | 64 | 20.5 |
| D | 1 | 3 | 192 | 6.26 | 70 | 64 | 20.5 |
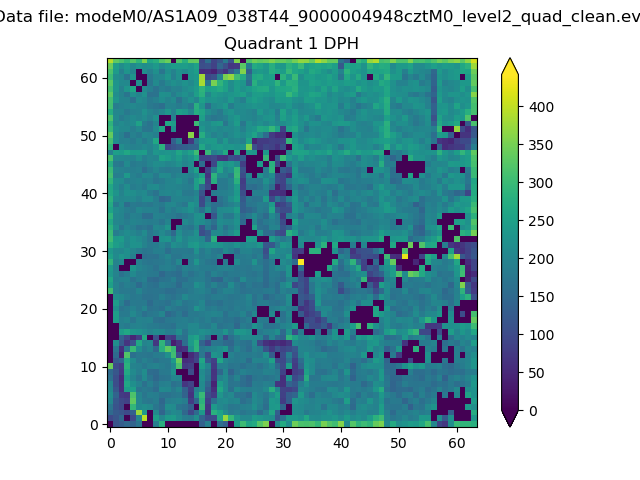
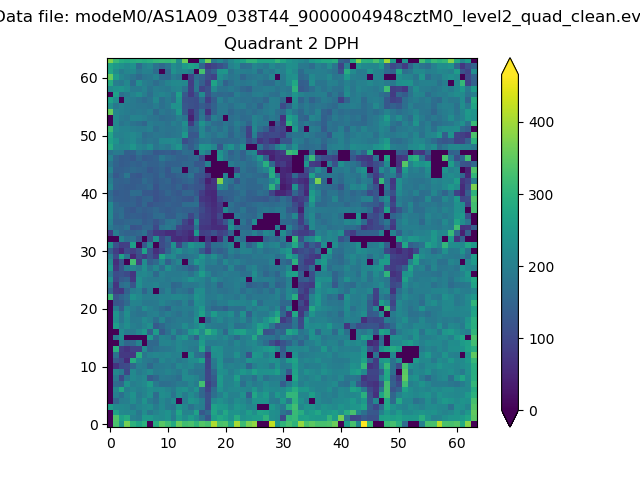
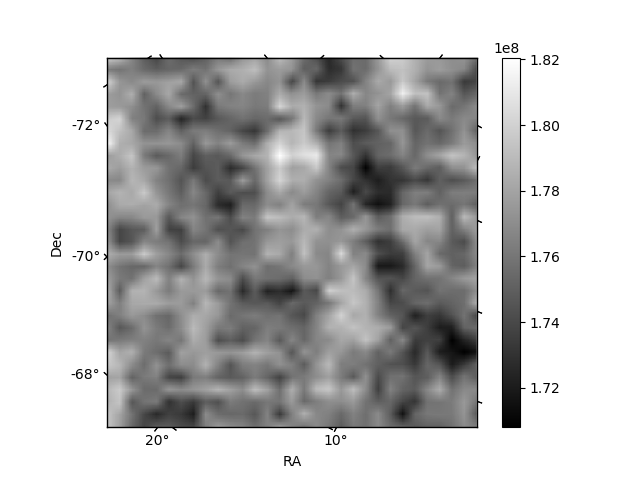
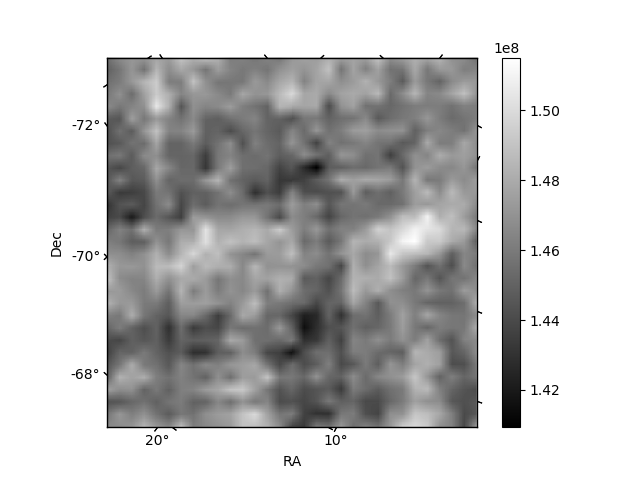
Histogram calculated using DETX and DETY for each event in the final _common_clean file
| Quadrant A |  |
 |
Quadrant B |
|---|---|---|---|
| Quadrant D |  |
 |
Quadrant C |
| Plot type | Count rate plots | Images |
|---|---|---|
| Comparison with Poisson distribution Blue bars denote a histogram of data divided into 1 sec bins. Red curve is a Poisson curve with rate = median count rate of data. |
 |
 |
| Quadrant-wise count rates Data is divided into 100 sec bins |
 |
|
| Module-wise count rates for Quadrant A Data is divided into 100 sec bins |
 |
 |
| Module-wise count rates for Quadrant B Data is divided into 100 sec bins |
 |
 |
| Module-wise count rates for Quadrant C Data is divided into 100 sec bins |
 |
 |
| Module-wise count rates for Quadrant D Data is divided into 100 sec bins |
 |
 |
| Parameter | Plot |
|---|---|
| CZT HV Monitor |  |
| D_VDD | 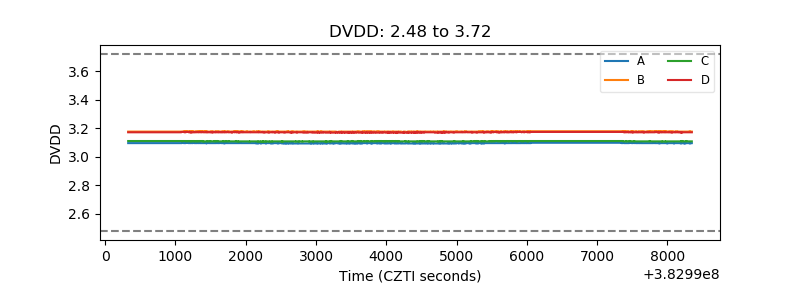 |
| Temperature 1 |  |
| Veto HV Monitor |  |
| Veto LLD |  |
| Alpha Counter | 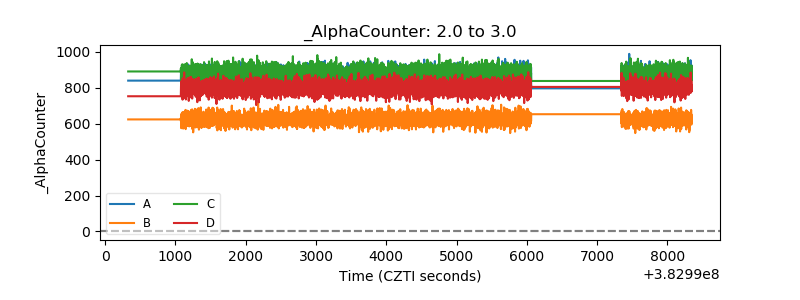 |
| _CPM_Rate | 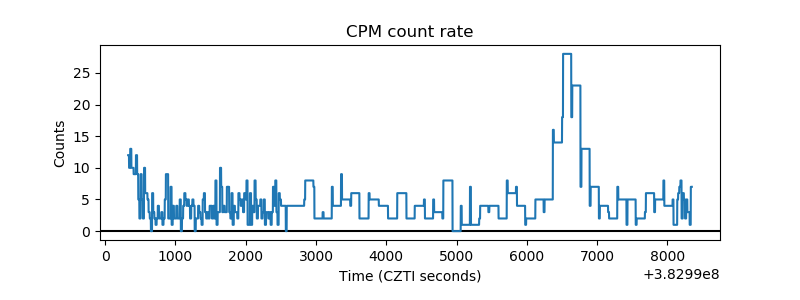 |
| CZT Counter | 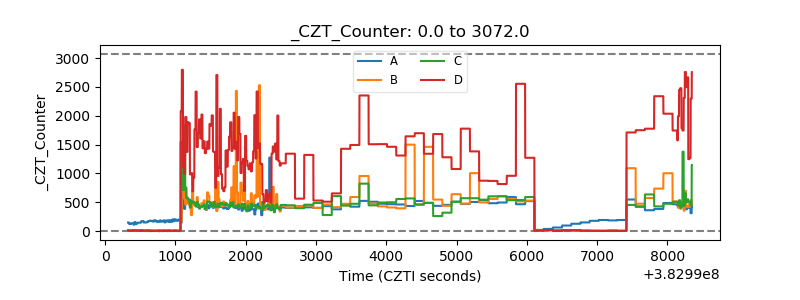 |
| +2.5 Volts monitor |  |
| +5 Volts monitor | 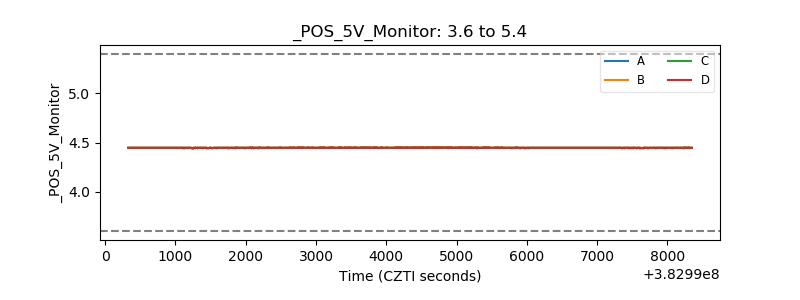 |
| _ROLL_ROT |  |
| _Roll_DEC |  |
| _Roll_RA | 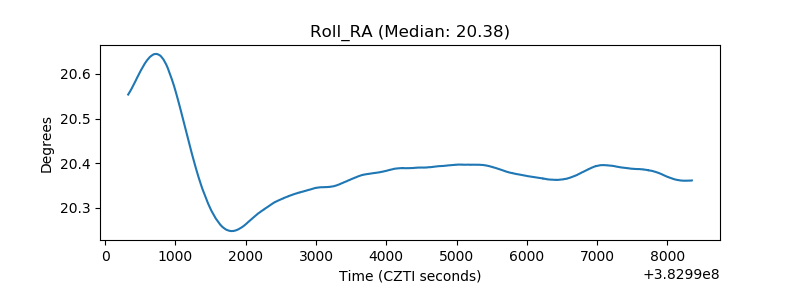 |
| Veto Counter |  |