| Param | Original file | Final file |
|---|---|---|
| Filename | modeM0/AS1C07_014T01_9000004950cztM0_level2.fits | modeM0/AS1C07_014T01_9000004950cztM0_level2_quad_clean.evt |
| Size (bytes) | 893,592,000 | 869,509,440 |
| Size | 852.2 MB | 829.2 MB |
| Events in quadrant A | 5,675,484 | 5,513,450 |
| Events in quadrant B | 5,205,694 | 5,255,448 |
| Events in quadrant C | 5,445,916 | 5,219,517 |
| Events in quadrant D | 4,429,388 | 4,043,321 |
| Mode SS | |||
|---|---|---|---|
| Quadrant | BADHDUFLAG | Total packets | Discarded packets |
| A | 0 | 1874 | 0 |
| B | 0 | 1874 | 0 |
| C | 0 | 1874 | 0 |
| D | 0 | 1874 | 0 |
| Mode M9 | |||
|---|---|---|---|
| Quadrant | BADHDUFLAG | Total packets | Discarded packets |
| A | 0 | 342 | 0 |
| B | 0 | 342 | 0 |
| C | 0 | 342 | 0 |
| D | 0 | 342 | 0 |
| Mode M0 | |||
|---|---|---|---|
| Quadrant | BADHDUFLAG | Total packets | Discarded packets |
| A | 0 | 194688 | 0 |
| B | 0 | 255105 | 0 |
| C | 0 | 201327 | 0 |
| D | 0 | 388421 | 0 |
| Quadrant | Total seconds | Saturated seconds | Saturation percentage |
|---|---|---|---|
| A | 91927 | 521 | 0.566754% |
| B | 91927 | 6490 | 7.059950% |
| C | 91927 | 486 | 0.528680% |
| D | 91927 | 9953 | 10.827069% |
Noise dominated data is calculated using 1-second bins in cleaned event files. If a bin has >2000 counts, and if more than 50% of those come from <1% of pixels, then it is considered to be noise-dominated and hence unusable.
| Quadrant | # 1 sec bins | Bins with >0 counts | Bins with >2000 counts | High rate bins dominated by noise | Noise dominated (total time) | Noise dominated (detector-on time) | Marked lightcurve |
|---|---|---|---|---|---|---|---|
| A | 125831 | 91924 | 0 | 0 | 0.00% | 0.00% |  |
| B | 125831 | 91865 | 0 | 0 | 0.00% | 0.00% |  |
| C | 125831 | 91922 | 0 | 0 | 0.00% | 0.00% |  |
| D | 125831 | 91774 | 0 | 0 | 0.00% | 0.00% |  |
Top three noisy pixels from each quadrant. If the there are fewer than three noisy pixels in the level2.evt file, extra rows are filled as -1
| Pixel properties | Quadrant properties | ||||||
|---|---|---|---|---|---|---|---|
| Quadrant | DetID | PixID | Counts | Sigma | Mean | Median | Sigma |
| A | 7 | 110 | 4717 | 9.36 | 1480 | 1396 | 354.7 |
| A | 0 | 29 | 4710 | 9.34 | 1480 | 1396 | 354.7 |
| A | 9 | 19 | 4577 | 8.97 | 1480 | 1396 | 354.7 |
| B | 2 | 9 | 4442 | 11.64 | 1380 | 1325 | 267.7 |
| B | 3 | 80 | 3915 | 9.67 | 1380 | 1325 | 267.7 |
| B | 2 | 8 | 3629 | 8.61 | 1380 | 1325 | 267.7 |
| C | 1 | 81 | 4720 | 9.21 | 1440 | 1353 | 365.4 |
| C | 1 | 80 | 4588 | 8.85 | 1440 | 1353 | 365.4 |
| C | 3 | 202 | 4313 | 8.1 | 1440 | 1353 | 365.4 |
| D | 7 | 3 | 3376 | 6.53 | 1271 | 1159 | 339.4 |
| D | 10 | 113 | 3225 | 6.09 | 1271 | 1159 | 339.4 |
| D | 10 | 189 | 3211 | 6.05 | 1271 | 1159 | 339.4 |
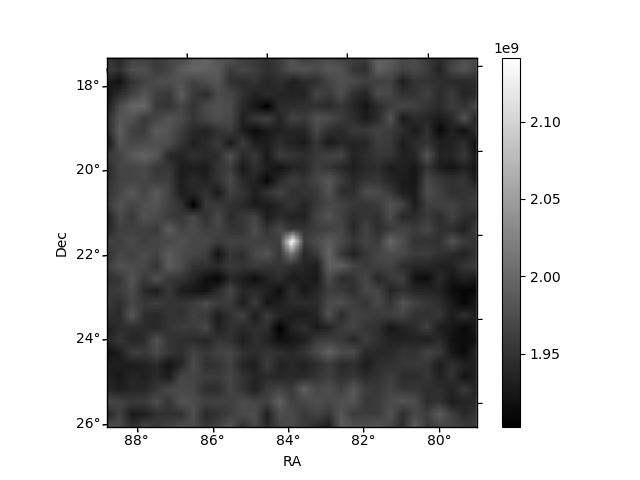
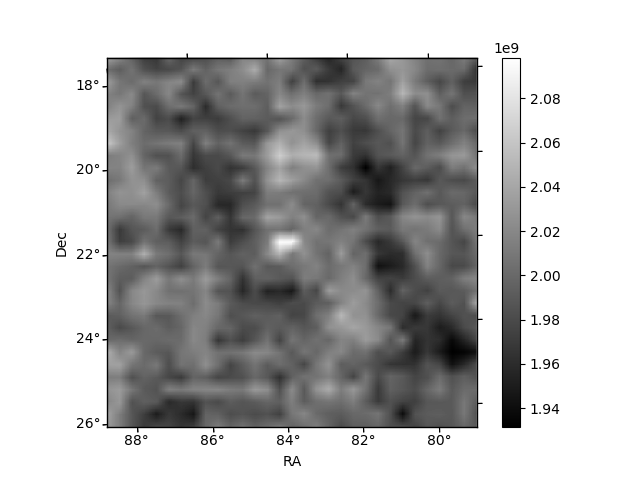
Histogram calculated using DETX and DETY for each event in the final _common_clean file
| Quadrant A | 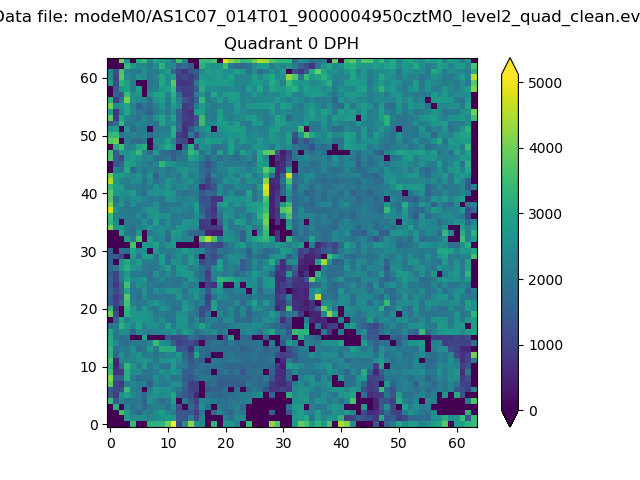 |
 |
Quadrant B |
|---|---|---|---|
| Quadrant D | 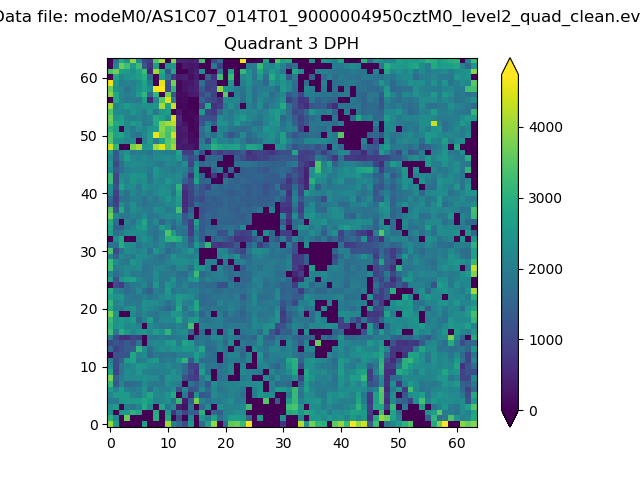 |
 |
Quadrant C |
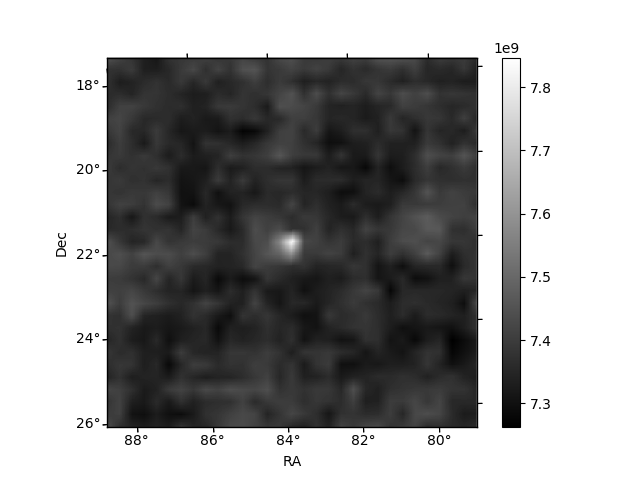
| Plot type | Count rate plots | Images |
|---|---|---|
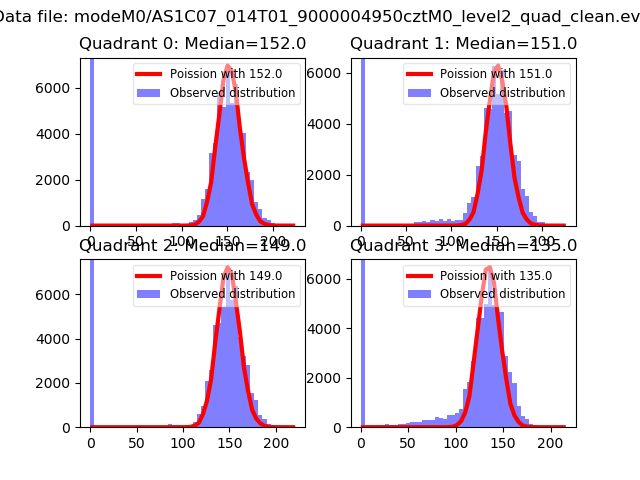
| Comparison with Poisson distribution Blue bars denote a histogram of data divided into 1 sec bins. Red curve is a Poisson curve with rate = median count rate of data. |
 |
 |
| Quadrant-wise count rates Data is divided into 100 sec bins |
 |
|
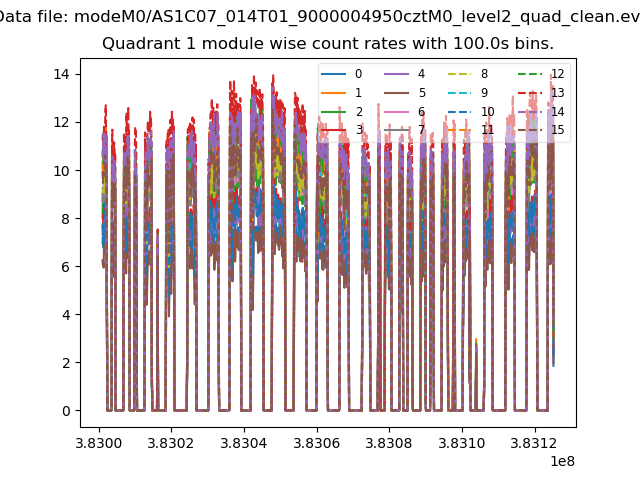
| Module-wise count rates for Quadrant A Data is divided into 100 sec bins |
 |
 |
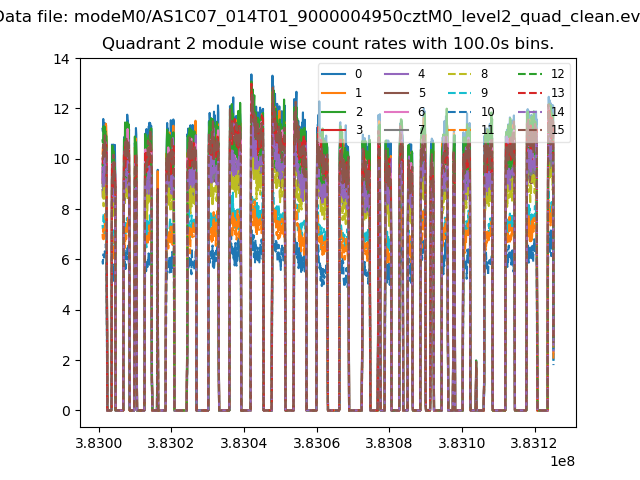
| Module-wise count rates for Quadrant B Data is divided into 100 sec bins |
 |
 |
| Module-wise count rates for Quadrant C Data is divided into 100 sec bins |
 |
 |
| Module-wise count rates for Quadrant D Data is divided into 100 sec bins |
 |
 |
| Parameter | Plot |
|---|---|
| CZT HV Monitor |  |
| D_VDD | 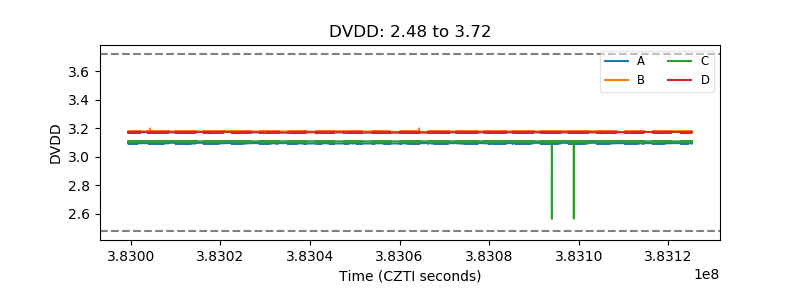 |
| Temperature 1 |  |
| Veto HV Monitor | 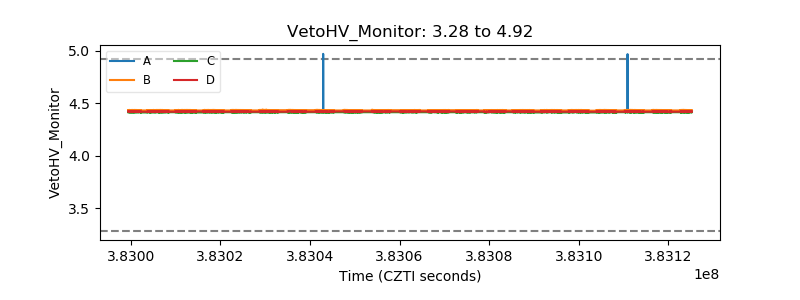 |
| Veto LLD | 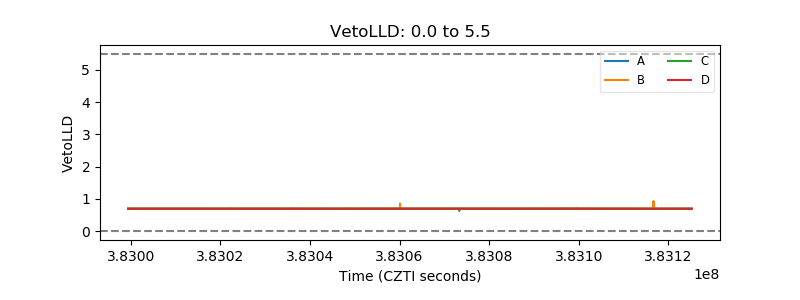 |
| Alpha Counter |  |
| _CPM_Rate |  |
| CZT Counter | 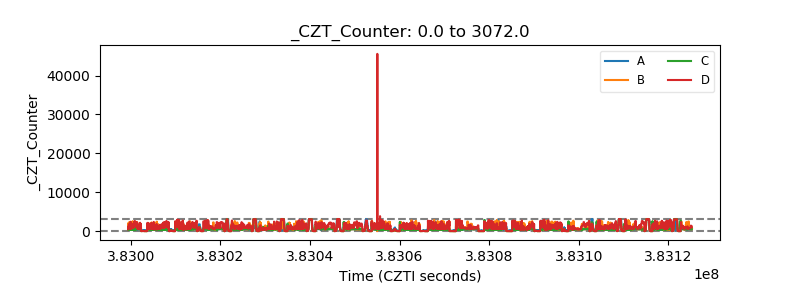 |
| +2.5 Volts monitor |  |
| +5 Volts monitor |  |
| _ROLL_ROT |  |
| _Roll_DEC | 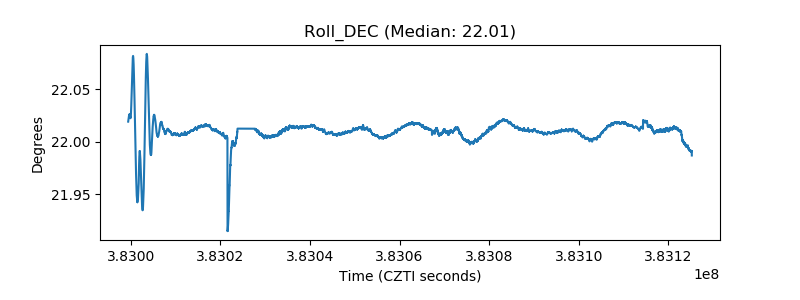 |
| _Roll_RA | 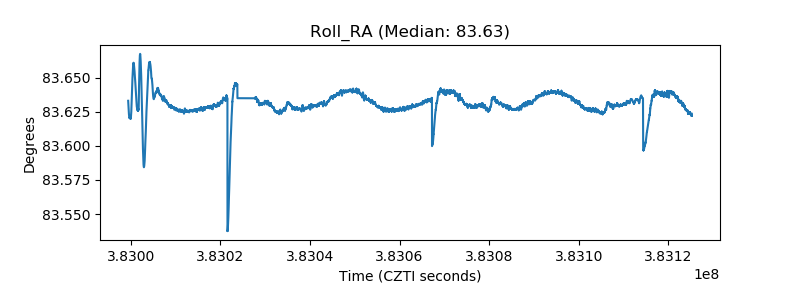 |
| Veto Counter | 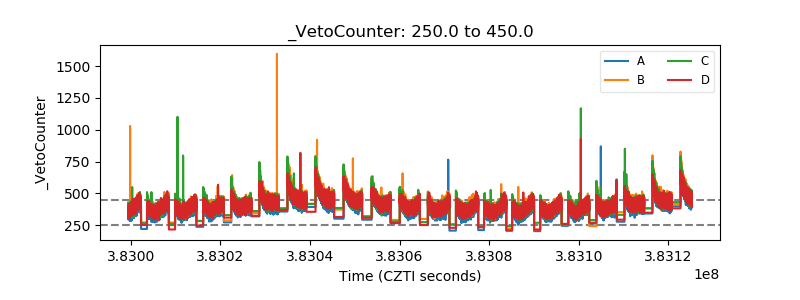 |