| Param | Original file | Final file |
|---|---|---|
| Filename | modeM0/AS1A11_046T09_9000004952cztM0_level2.fits | modeM0/AS1A11_046T09_9000004952cztM0_level2_quad_clean.evt |
| Size (bytes) | 239,829,120 | 265,841,280 |
| Size | 228.7 MB | 253.5 MB |
| Events in quadrant A | 1,509,090 | 1,716,199 |
| Events in quadrant B | 1,402,166 | 1,635,105 |
| Events in quadrant C | 1,453,130 | 1,627,345 |
| Events in quadrant D | 1,215,538 | 1,389,435 |
| Mode SS | |||
|---|---|---|---|
| Quadrant | BADHDUFLAG | Total packets | Discarded packets |
| A | 0 | 500 | 0 |
| B | 0 | 500 | 0 |
| C | 0 | 500 | 0 |
| D | 0 | 500 | 0 |
| Mode M9 | |||
|---|---|---|---|
| Quadrant | BADHDUFLAG | Total packets | Discarded packets |
| A | 0 | 112 | 0 |
| B | 0 | 112 | 0 |
| C | 0 | 112 | 0 |
| D | 0 | 112 | 0 |
| Mode M0 | |||
|---|---|---|---|
| Quadrant | BADHDUFLAG | Total packets | Discarded packets |
| A | 0 | 50815 | 0 |
| B | 0 | 61156 | 0 |
| C | 0 | 52854 | 0 |
| D | 0 | 85803 | 0 |
| Quadrant | Total seconds | Saturated seconds | Saturation percentage |
|---|---|---|---|
| A | 24462 | 105 | 0.429237% |
| B | 24462 | 1129 | 4.615322% |
| C | 24462 | 209 | 0.854386% |
| D | 24462 | 1842 | 7.530047% |
Noise dominated data is calculated using 1-second bins in cleaned event files. If a bin has >2000 counts, and if more than 50% of those come from <1% of pixels, then it is considered to be noise-dominated and hence unusable.
| Quadrant | # 1 sec bins | Bins with >0 counts | Bins with >2000 counts | High rate bins dominated by noise | Noise dominated (total time) | Noise dominated (detector-on time) | Marked lightcurve |
|---|---|---|---|---|---|---|---|
| A | 35609 | 24462 | 0 | 0 | 0.00% | 0.00% | 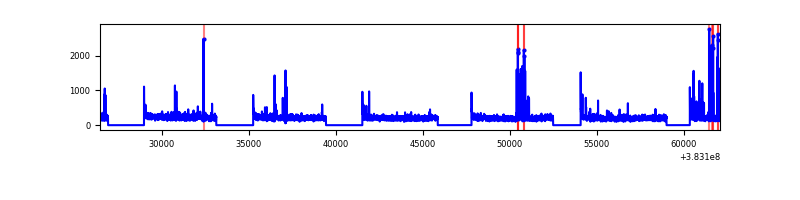 |
| B | 35609 | 24431 | 0 | 0 | 0.00% | 0.00% | 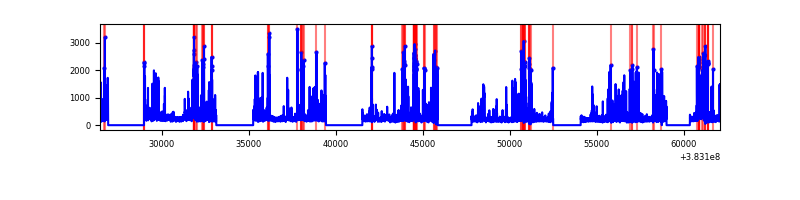 |
| C | 35609 | 24461 | 0 | 0 | 0.00% | 0.00% |  |
| D | 35609 | 24462 | 0 | 0 | 0.00% | 0.00% | 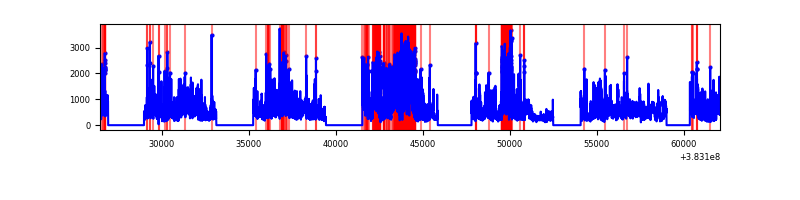 |
Top three noisy pixels from each quadrant. If the there are fewer than three noisy pixels in the level2.evt file, extra rows are filled as -1
| Pixel properties | Quadrant properties | ||||||
|---|---|---|---|---|---|---|---|
| Quadrant | DetID | PixID | Counts | Sigma | Mean | Median | Sigma |
| A | 9 | 19 | 1216 | 8.55 | 394 | 374 | 98.5 |
| A | 7 | 110 | 1213 | 8.52 | 394 | 374 | 98.5 |
| A | 0 | 29 | 1188 | 8.27 | 394 | 374 | 98.5 |
| B | 2 | 9 | 1184 | 11.32 | 372 | 357 | 73.1 |
| B | 3 | 80 | 1044 | 9.4 | 372 | 357 | 73.1 |
| B | 2 | 8 | 962 | 8.28 | 372 | 357 | 73.1 |
| C | 1 | 80 | 1179 | 8.25 | 384 | 362 | 99.0 |
| C | 1 | 81 | 1177 | 8.23 | 384 | 362 | 99.0 |
| C | 3 | 202 | 1149 | 7.95 | 384 | 362 | 99.0 |
| D | 10 | 113 | 897 | 6.2 | 348 | 318 | 93.3 |
| D | 7 | 3 | 895 | 6.18 | 348 | 318 | 93.3 |
| D | 6 | 83 | 891 | 6.14 | 348 | 318 | 93.3 |
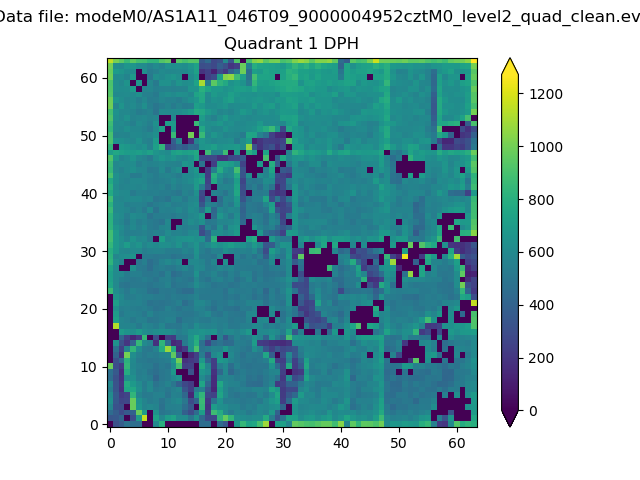
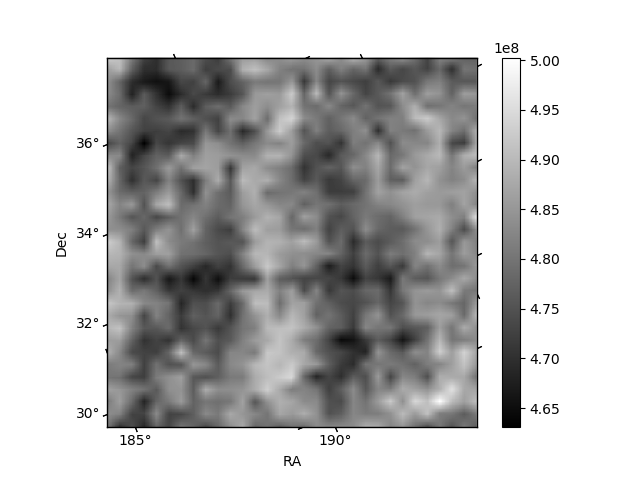
Histogram calculated using DETX and DETY for each event in the final _common_clean file
| Quadrant A | 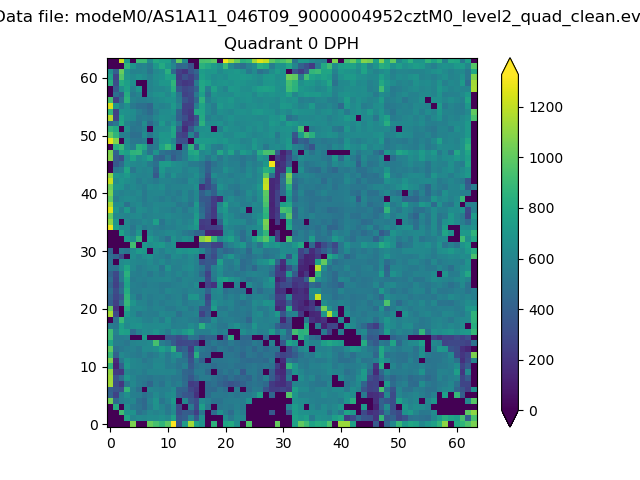 |
 |
Quadrant B |
|---|---|---|---|
| Quadrant D | 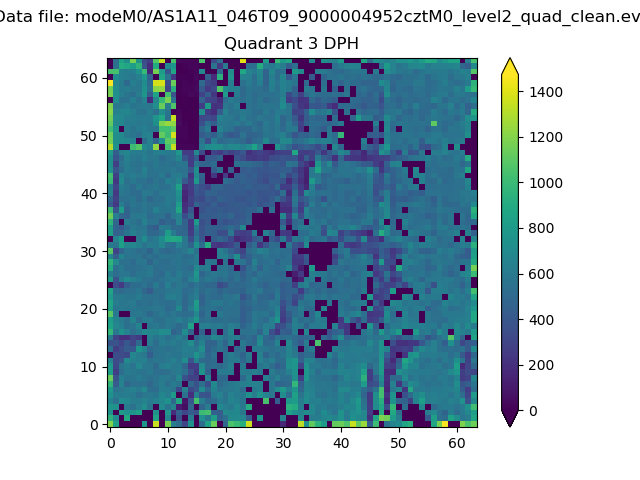 |
 |
Quadrant C |
| Plot type | Count rate plots | Images |
|---|---|---|
| Comparison with Poisson distribution Blue bars denote a histogram of data divided into 1 sec bins. Red curve is a Poisson curve with rate = median count rate of data. |
 |
 |
| Quadrant-wise count rates Data is divided into 100 sec bins |
 |
|
| Module-wise count rates for Quadrant A Data is divided into 100 sec bins |
 |
 |
| Module-wise count rates for Quadrant B Data is divided into 100 sec bins |
 |
 |
| Module-wise count rates for Quadrant C Data is divided into 100 sec bins |
 |
 |
| Module-wise count rates for Quadrant D Data is divided into 100 sec bins |
 |
 |
| Parameter | Plot |
|---|---|
| CZT HV Monitor |  |
| D_VDD |  |
| Temperature 1 |  |
| Veto HV Monitor |  |
| Veto LLD |  |
| Alpha Counter |  |
| _CPM_Rate |  |
| CZT Counter |  |
| +2.5 Volts monitor |  |
| +5 Volts monitor | 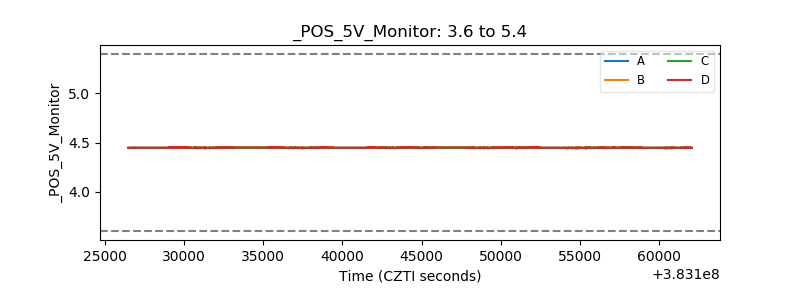 |
| _ROLL_ROT |  |
| _Roll_DEC |  |
| _Roll_RA |  |
| Veto Counter |  |