| Param | Original file | Final file |
|---|---|---|
| Filename | modeM0/AS1A11_046T09_9000004952_34611cztM0_level2.evt | modeM0/AS1A11_046T09_9000004952_34611cztM0_level2_quad_clean.evt |
| Size (bytes) | 453,965,760 | 50,644,800 |
| Size | 432.9 MB | 48.3 MB |
| Events in quadrant A | 2,690,320 | 302,585 |
| Events in quadrant B | 3,359,171 | 300,271 |
| Events in quadrant C | 3,064,714 | 292,811 |
| Events in quadrant D | 4,287,730 | 279,247 |
| Mode SS | |||
|---|---|---|---|
| Quadrant | BADHDUFLAG | Total packets | Discarded packets |
| A | 0 | 104 | 0 |
| B | 0 | 104 | 0 |
| C | 0 | 104 | 0 |
| D | 0 | 104 | 0 |
| Mode M9 | |||
|---|---|---|---|
| Quadrant | BADHDUFLAG | Total packets | Discarded packets |
| A | 0 | 23 | 0 |
| B | 0 | 23 | 0 |
| C | 0 | 23 | 0 |
| D | 0 | 24 | 0 |
| Mode M0 | |||
|---|---|---|---|
| Quadrant | BADHDUFLAG | Total packets | Discarded packets |
| A | 0 | 10820 | 3 |
| B | 0 | 12955 | 2 |
| C | 0 | 11893 | 2 |
| D | 0 | 16216 | 2 |
| Quadrant | Total seconds | Saturated seconds | Saturation percentage |
|---|---|---|---|
| A | 5110 | 20 | 0.391389% |
| B | 5110 | 194 | 3.796477% |
| C | 5110 | 66 | 1.291585% |
| D | 5110 | 110 | 2.152642% |
Noise dominated data is calculated using 1-second bins in cleaned event files. If a bin has >2000 counts, and if more than 50% of those come from <1% of pixels, then it is considered to be noise-dominated and hence unusable.
| Quadrant | # 1 sec bins | Bins with >0 counts | Bins with >2000 counts | High rate bins dominated by noise | Noise dominated (total time) | Noise dominated (detector-on time) | Marked lightcurve |
|---|---|---|---|---|---|---|---|
| A | 7233 | 5111 | 3 | 3 | 0.04% | 0.06% | 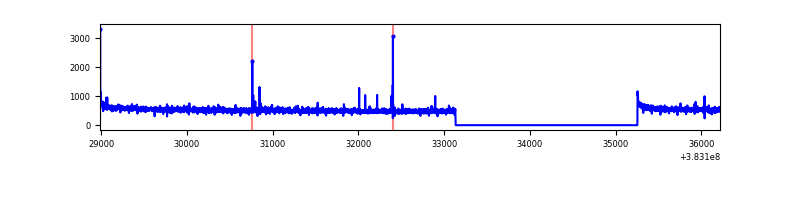 |
| B | 7233 | 5111 | 126 | 126 | 1.74% | 2.47% | 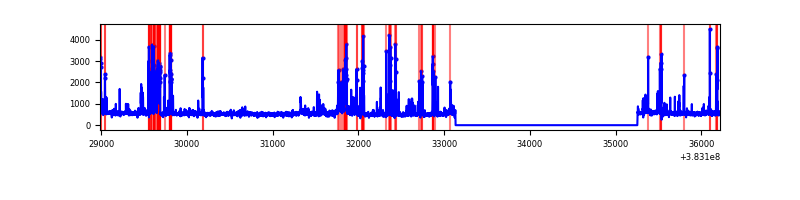 |
| C | 7233 | 5111 | 46 | 46 | 0.64% | 0.90% | 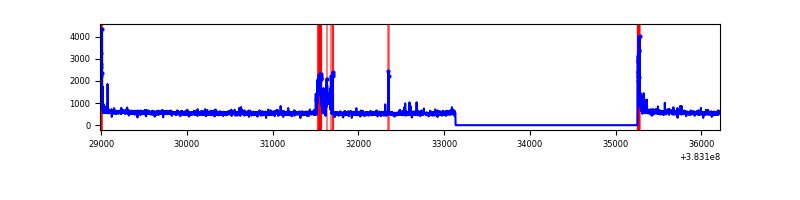 |
| D | 7233 | 5111 | 85 | 85 | 1.18% | 1.66% | 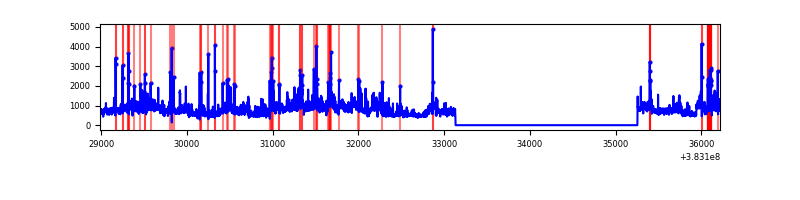 |
Top three noisy pixels from each quadrant. If the there are fewer than three noisy pixels in the level2.evt file, extra rows are filled as -1
| Pixel properties | Quadrant properties | ||||||
|---|---|---|---|---|---|---|---|
| Quadrant | DetID | PixID | Counts | Sigma | Mean | Median | Sigma |
| A | 10 | 83 | 43264 | 318.59 | 677 | 668 | 133.7 |
| A | 15 | 169 | 17471 | 125.68 | 677 | 668 | 133.7 |
| A | 9 | 143 | 9805 | 68.34 | 677 | 668 | 133.7 |
| B | 5 | 172 | 601113 | 4894.92 | 659 | 644 | 122.7 |
| B | 4 | 232 | 43177 | 346.72 | 659 | 644 | 122.7 |
| B | 10 | 245 | 33043 | 264.11 | 659 | 644 | 122.7 |
| C | 15 | 214 | 214715 | 1444.7 | 642 | 648 | 148.2 |
| C | 0 | 207 | 161849 | 1087.92 | 642 | 648 | 148.2 |
| C | 0 | 10 | 128987 | 866.14 | 642 | 648 | 148.2 |
| D | 8 | 195 | 1368325 | 8630.71 | 649 | 633 | 158.5 |
| D | 12 | 235 | 60512 | 377.86 | 649 | 633 | 158.5 |
| D | 7 | 223 | 53392 | 332.93 | 649 | 633 | 158.5 |
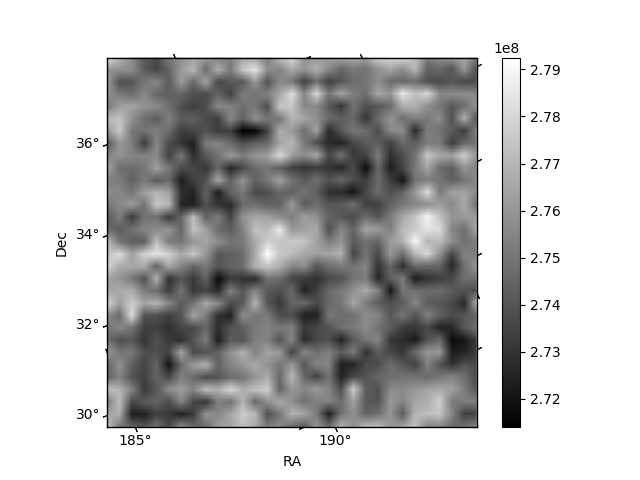
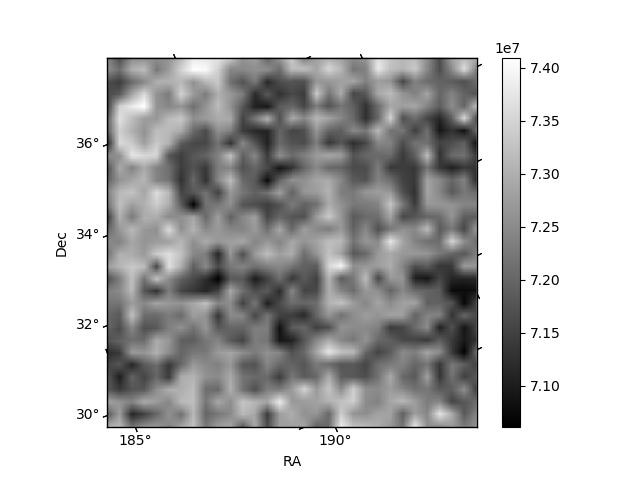
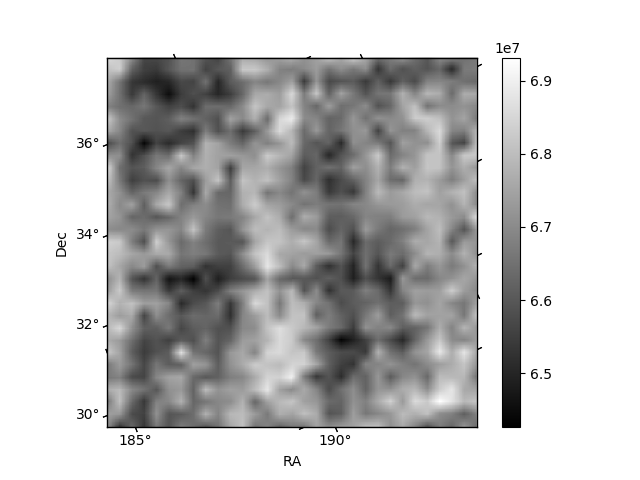
Histogram calculated using DETX and DETY for each event in the final _common_clean file
| Quadrant A | 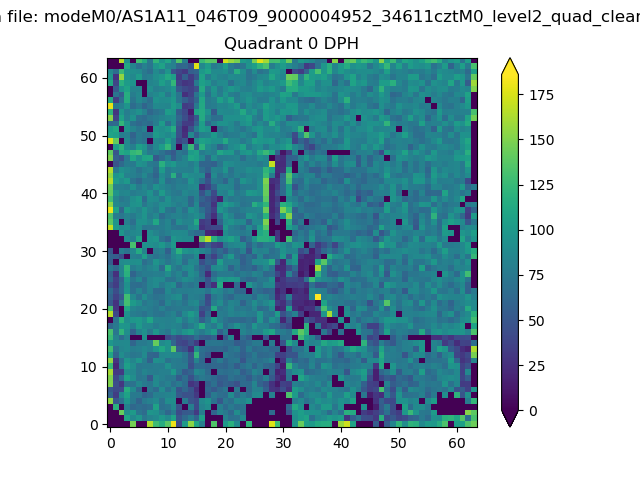 |
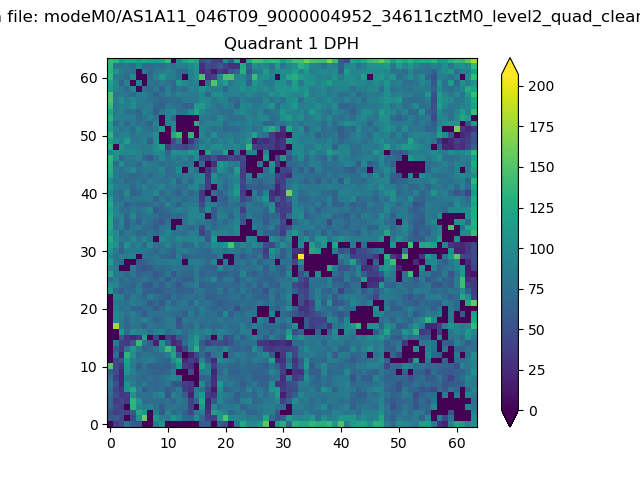 |
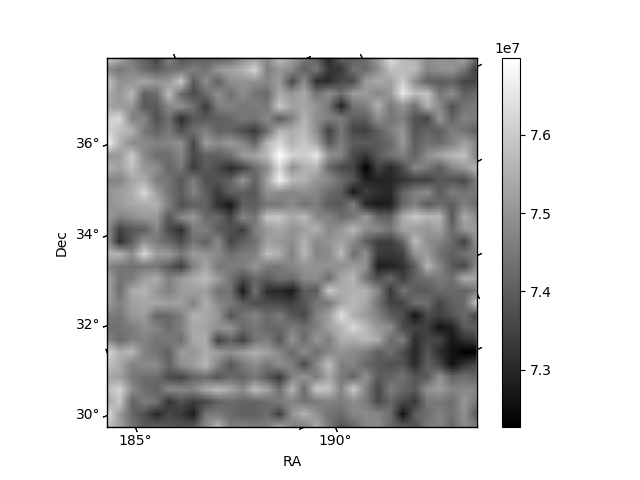
Quadrant B |
|---|---|---|---|
| Quadrant D | 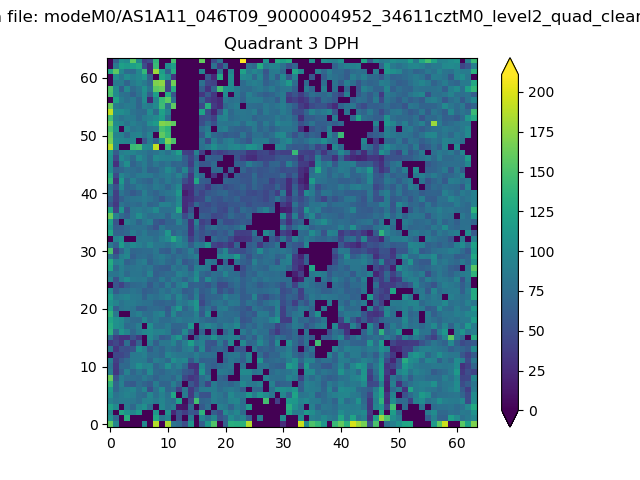 |
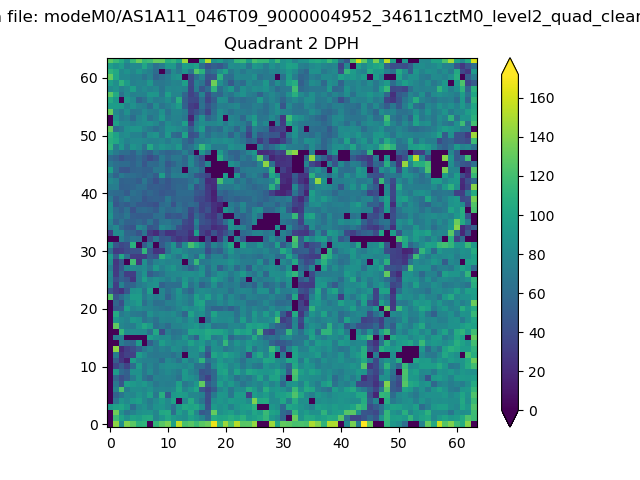 |
Quadrant C |
| Plot type | Count rate plots | Images |
|---|---|---|
| Comparison with Poisson distribution Blue bars denote a histogram of data divided into 1 sec bins. Red curve is a Poisson curve with rate = median count rate of data. |
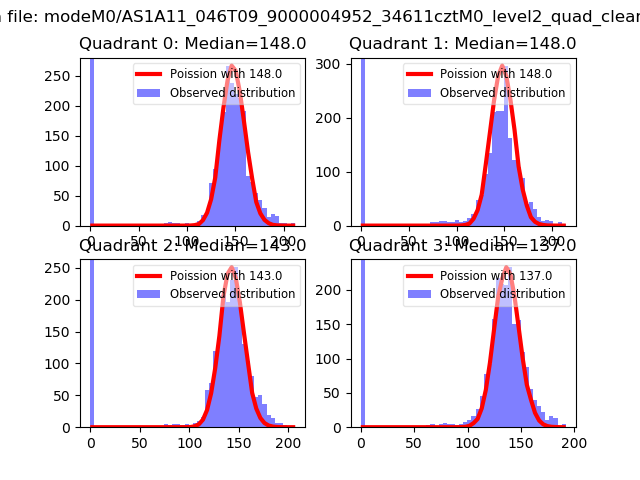 |
 |
| Quadrant-wise count rates Data is divided into 100 sec bins |
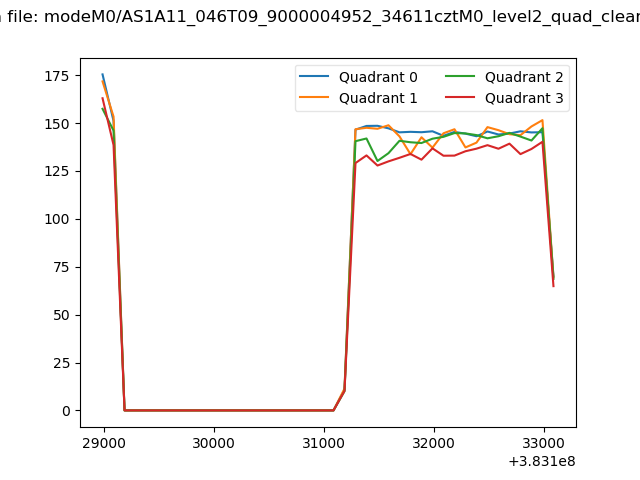 |
|
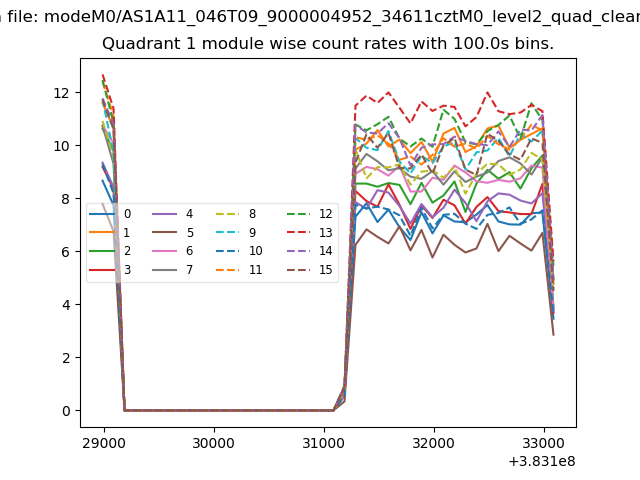
| Module-wise count rates for Quadrant A Data is divided into 100 sec bins |
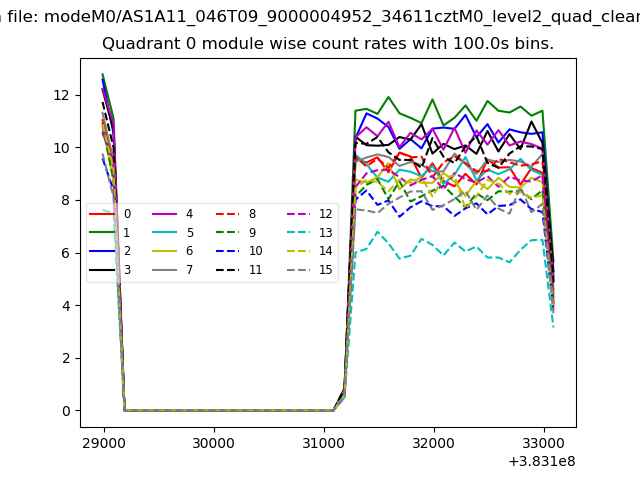 |
 |
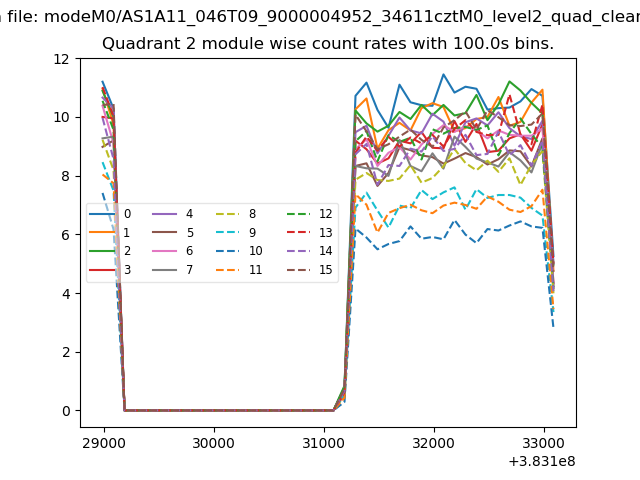
| Module-wise count rates for Quadrant B Data is divided into 100 sec bins |
 |
 |
| Module-wise count rates for Quadrant C Data is divided into 100 sec bins |
 |
 |
| Module-wise count rates for Quadrant D Data is divided into 100 sec bins |
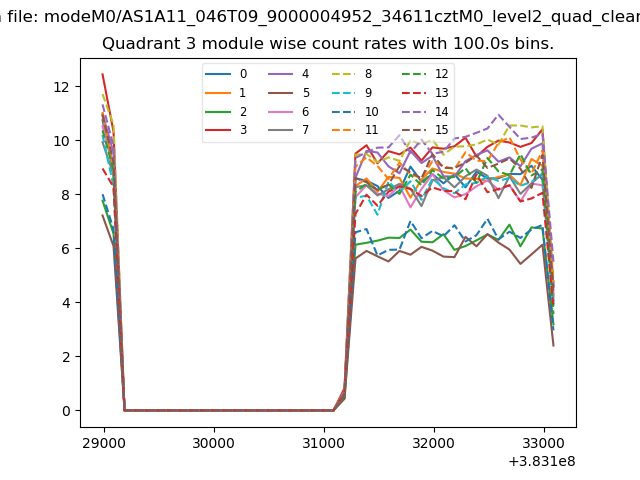 |
 |
| Parameter | Plot |
|---|---|
| CZT HV Monitor | 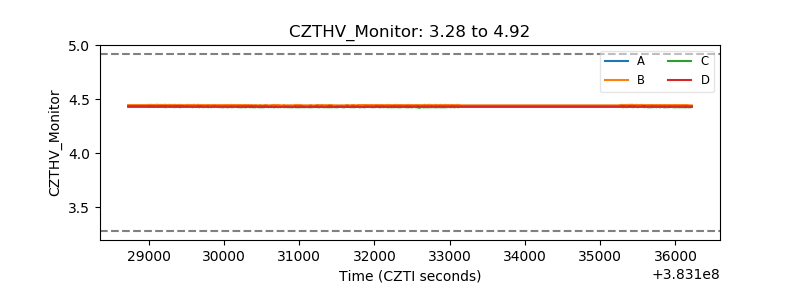 |
| D_VDD | 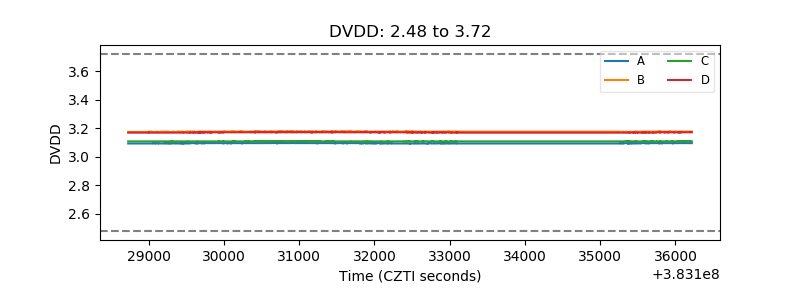 |
| Temperature 1 |  |
| Veto HV Monitor | 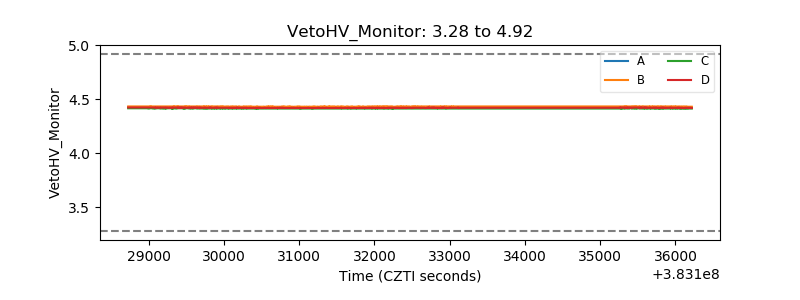 |
| Veto LLD | 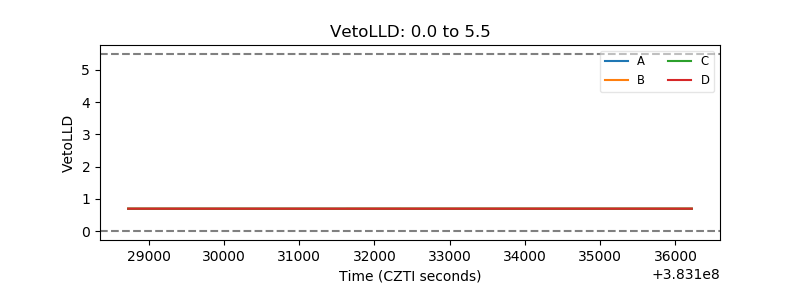 |
| Alpha Counter | 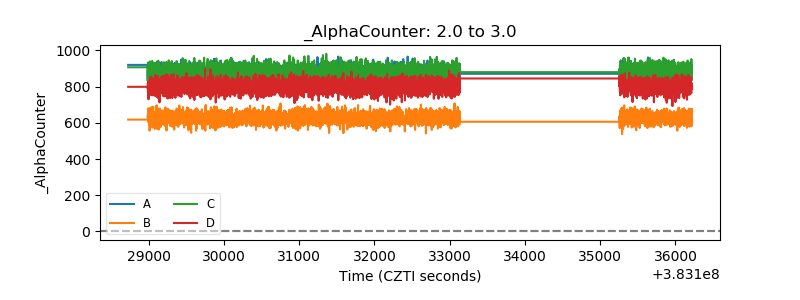 |
| _CPM_Rate | 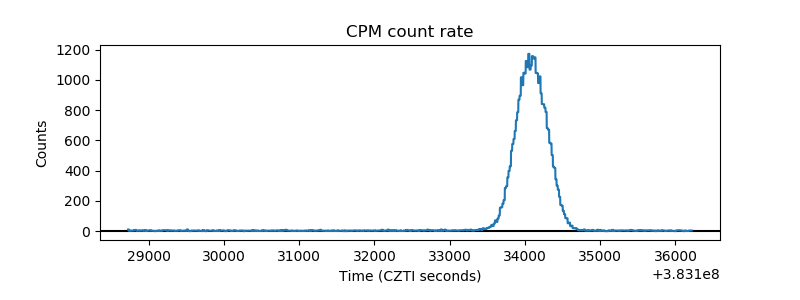 |
| CZT Counter | 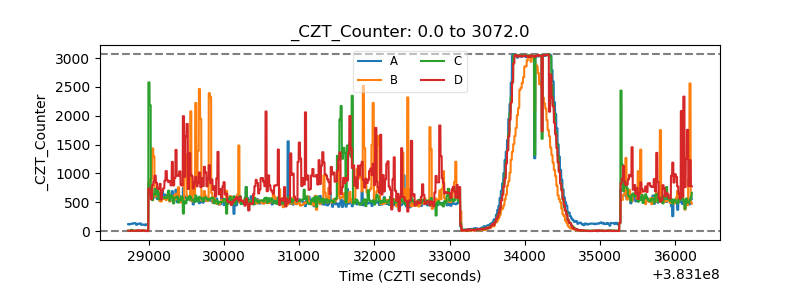 |
| +2.5 Volts monitor | 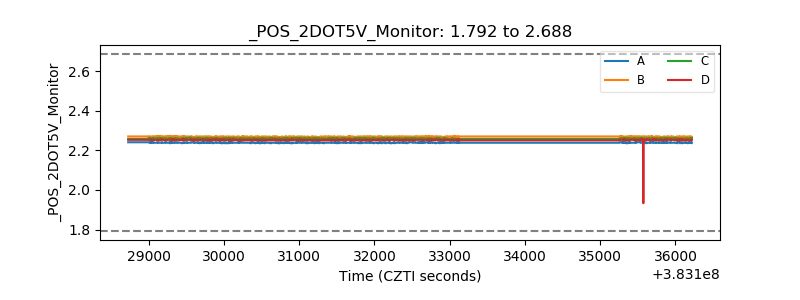 |
| +5 Volts monitor |  |
| _ROLL_ROT | 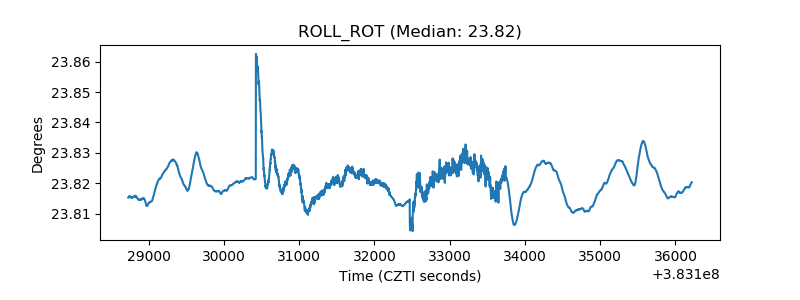 |
| _Roll_DEC | 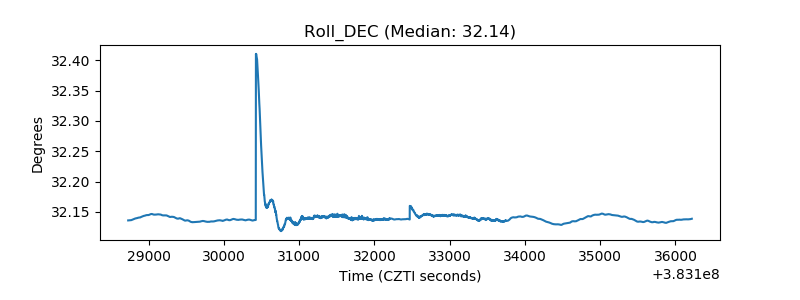 |
| _Roll_RA | 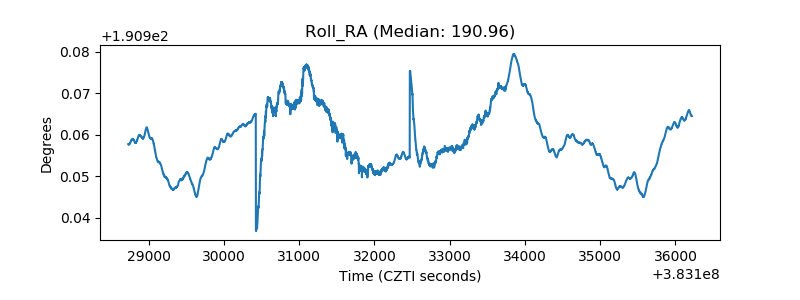 |
| Veto Counter | 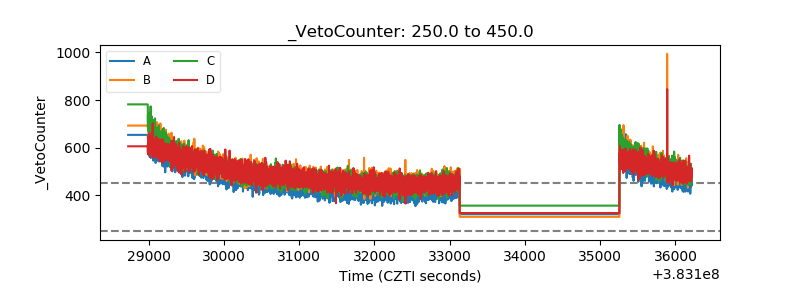 |