| Param | Original file | Final file |
|---|---|---|
| Filename | modeM0/AS1A11_058T02_9000004954_34619cztM0_level2.evt | modeM0/AS1A11_058T02_9000004954_34619cztM0_level2_quad_clean.evt |
| Size (bytes) | 1,393,058,880 | 192,309,120 |
| Size | 1.3 GB | 183.4 MB |
| Events in quadrant A | 7,133,724 | 1,221,135 |
| Events in quadrant B | 12,196,106 | 1,169,515 |
| Events in quadrant C | 8,016,192 | 1,221,239 |
| Events in quadrant D | 13,790,242 | 1,134,218 |
| Mode M9 | |||
|---|---|---|---|
| Quadrant | BADHDUFLAG | Total packets | Discarded packets |
| A | 0 | 50 | 0 |
| B | 0 | 50 | 0 |
| C | 0 | 50 | 0 |
| D | 0 | 51 | 0 |
| Mode M0 | |||
|---|---|---|---|
| Quadrant | BADHDUFLAG | Total packets | Discarded packets |
| A | 0 | 31899 | 5 |
| B | 0 | 46490 | 4 |
| C | 0 | 33488 | 4 |
| D | 0 | 51923 | 4 |
| Mode SS | |||
|---|---|---|---|
| Quadrant | BADHDUFLAG | Total packets | Discarded packets |
| A | 0 | 320 | 0 |
| B | 0 | 320 | 0 |
| C | 0 | 320 | 0 |
| D | 0 | 320 | 0 |
| Quadrant | Total seconds | Saturated seconds | Saturation percentage |
|---|---|---|---|
| A | 15614 | 23 | 0.147304% |
| B | 15614 | 1519 | 9.728449% |
| C | 15614 | 163 | 1.043935% |
| D | 15614 | 685 | 4.387089% |
Noise dominated data is calculated using 1-second bins in cleaned event files. If a bin has >2000 counts, and if more than 50% of those come from <1% of pixels, then it is considered to be noise-dominated and hence unusable.
| Quadrant | # 1 sec bins | Bins with >0 counts | Bins with >2000 counts | High rate bins dominated by noise | Noise dominated (total time) | Noise dominated (detector-on time) | Marked lightcurve |
|---|---|---|---|---|---|---|---|
| A | 19850 | 15617 | 7 | 7 | 0.04% | 0.04% | 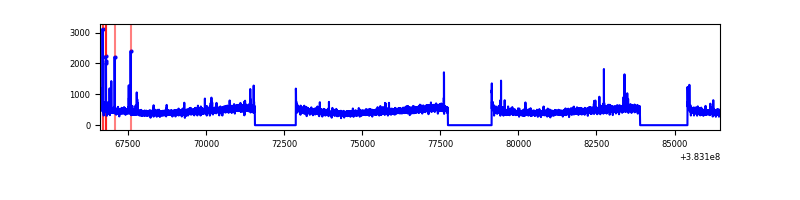 |
| B | 19850 | 15617 | 1086 | 1086 | 5.47% | 6.95% | 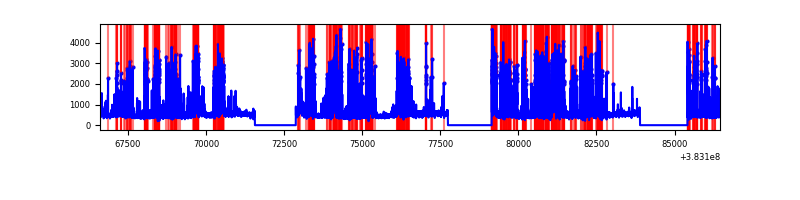 |
| C | 19850 | 15617 | 100 | 100 | 0.50% | 0.64% | 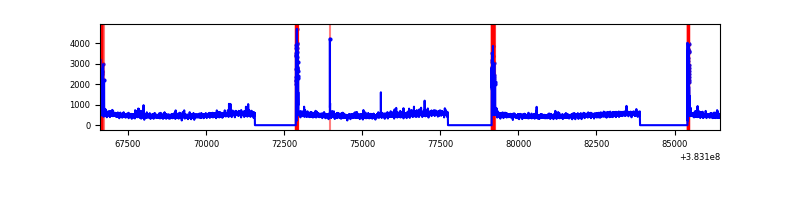 |
| D | 19850 | 15617 | 577 | 577 | 2.91% | 3.69% | 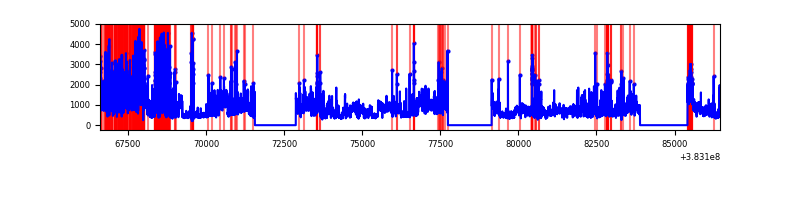 |
Top three noisy pixels from each quadrant. If the there are fewer than three noisy pixels in the level2.evt file, extra rows are filled as -1
| Pixel properties | Quadrant properties | ||||||
|---|---|---|---|---|---|---|---|
| Quadrant | DetID | PixID | Counts | Sigma | Mean | Median | Sigma |
| A | 10 | 83 | 98132 | 271.0 | 1782 | 1749 | 355.7 |
| A | 15 | 169 | 48180 | 130.55 | 1782 | 1749 | 355.7 |
| A | 13 | 6 | 41635 | 112.15 | 1782 | 1749 | 355.7 |
| B | 5 | 172 | 4716367 | 14554.74 | 1708 | 1663 | 323.9 |
| B | 4 | 232 | 256811 | 787.67 | 1708 | 1663 | 323.9 |
| B | 4 | 171 | 204467 | 626.08 | 1708 | 1663 | 323.9 |
| C | 15 | 214 | 643253 | 1620.61 | 1722 | 1732 | 395.9 |
| C | 0 | 10 | 417224 | 1049.61 | 1722 | 1732 | 395.9 |
| C | 14 | 67 | 187761 | 469.95 | 1722 | 1732 | 395.9 |
| D | 8 | 195 | 4039331 | 9337.98 | 1694 | 1657 | 432.4 |
| D | 2 | 249 | 1685286 | 3893.75 | 1694 | 1657 | 432.4 |
| D | 10 | 230 | 251349 | 577.47 | 1694 | 1657 | 432.4 |
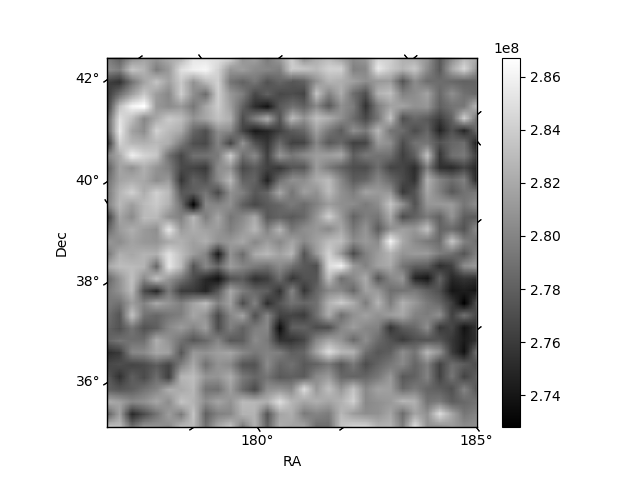
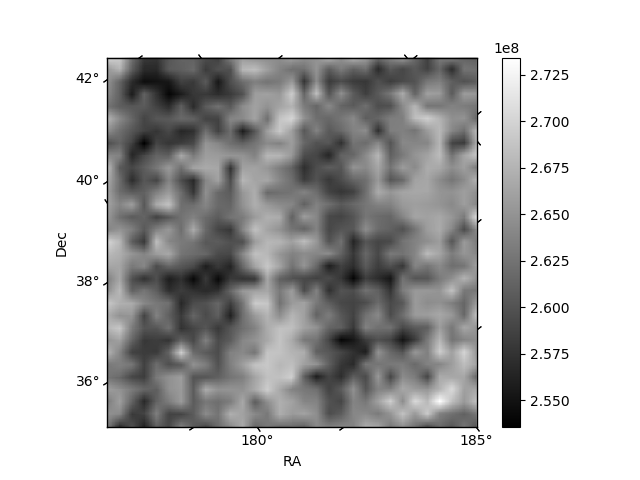
Histogram calculated using DETX and DETY for each event in the final _common_clean file
| Quadrant A | 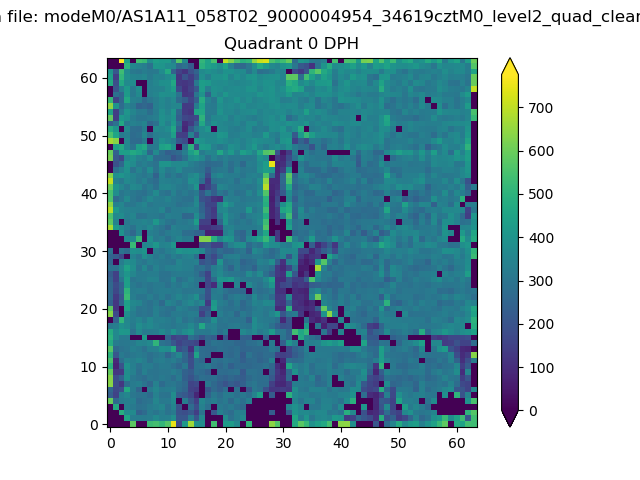 |
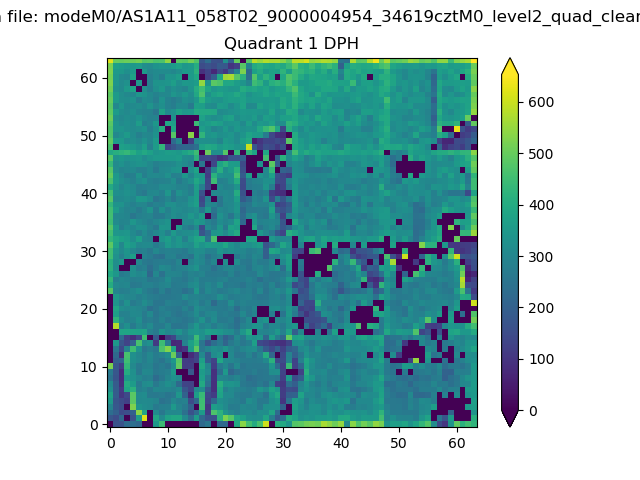 |
Quadrant B |
|---|---|---|---|
| Quadrant D | 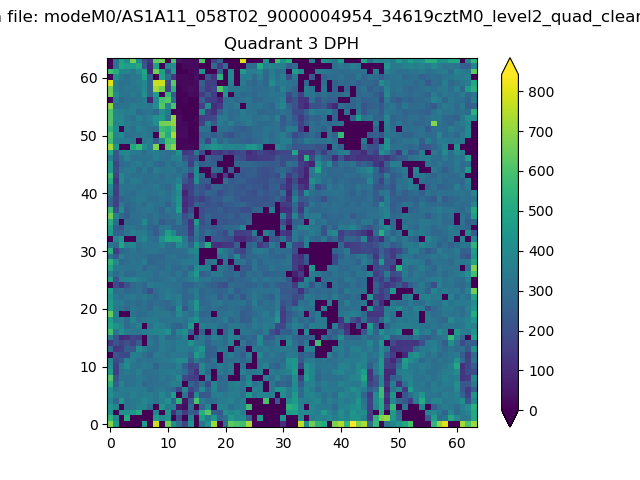 |
 |
Quadrant C |
| Plot type | Count rate plots | Images |
|---|---|---|
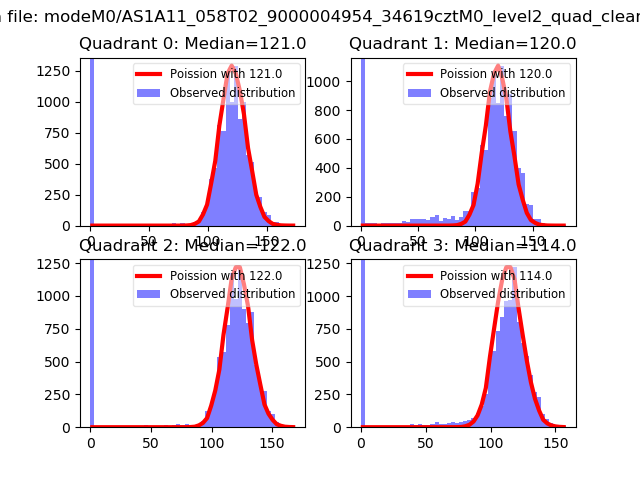
| Comparison with Poisson distribution Blue bars denote a histogram of data divided into 1 sec bins. Red curve is a Poisson curve with rate = median count rate of data. |
 |
 |
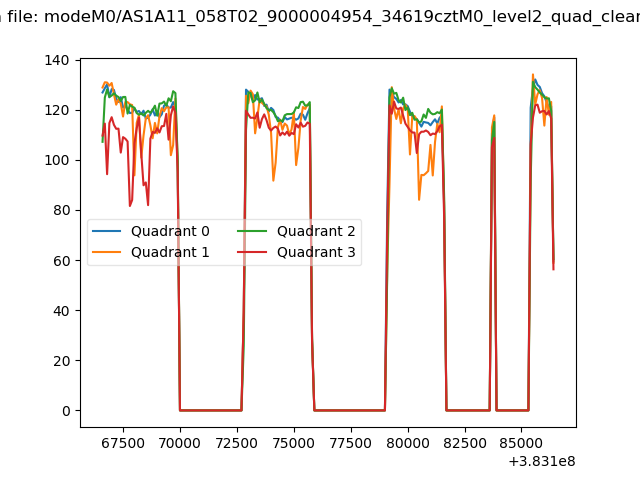
| Quadrant-wise count rates Data is divided into 100 sec bins |
 |
|
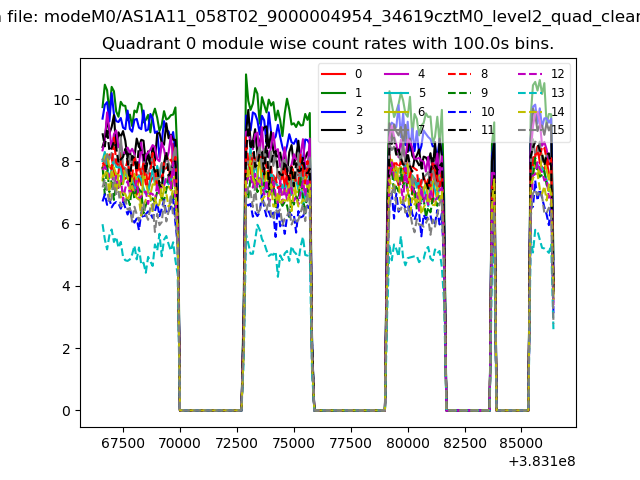
| Module-wise count rates for Quadrant A Data is divided into 100 sec bins |
 |
 |
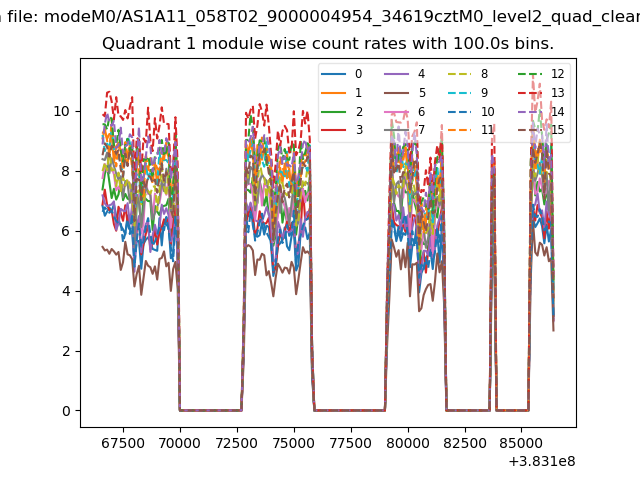
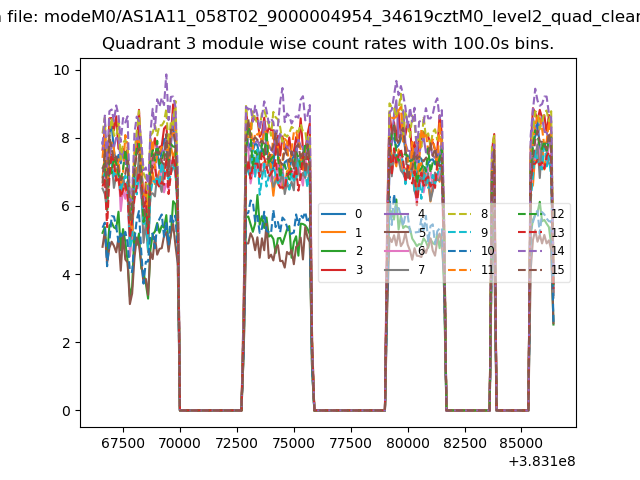
| Module-wise count rates for Quadrant B Data is divided into 100 sec bins |
 |
 |
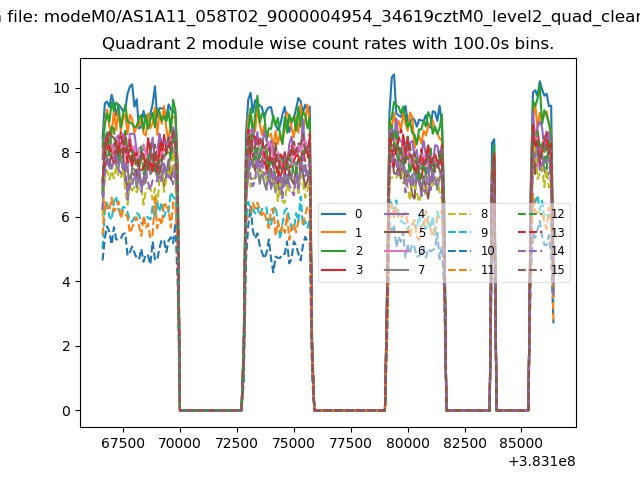
| Module-wise count rates for Quadrant C Data is divided into 100 sec bins |
 |
 |
| Module-wise count rates for Quadrant D Data is divided into 100 sec bins |
 |
 |
| Parameter | Plot |
|---|---|
| CZT HV Monitor | 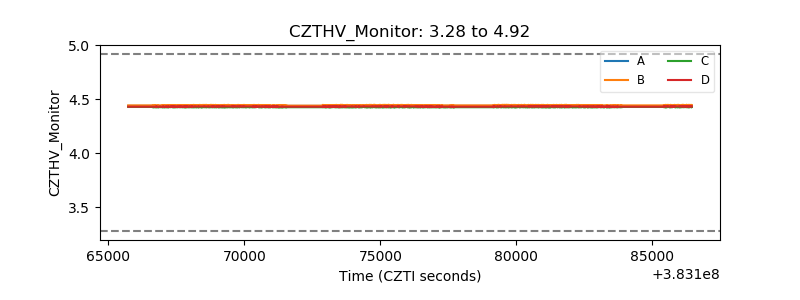 |
| D_VDD | 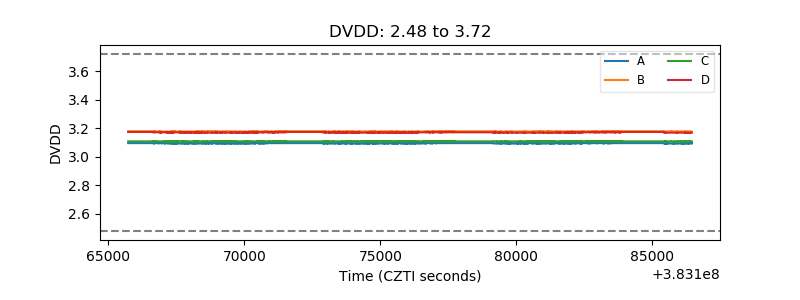 |
| Temperature 1 | 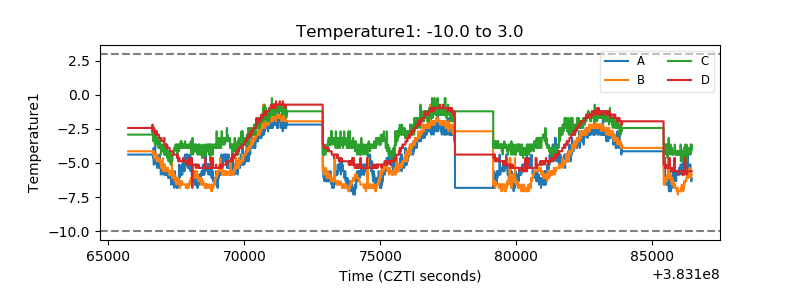 |
| Veto HV Monitor | 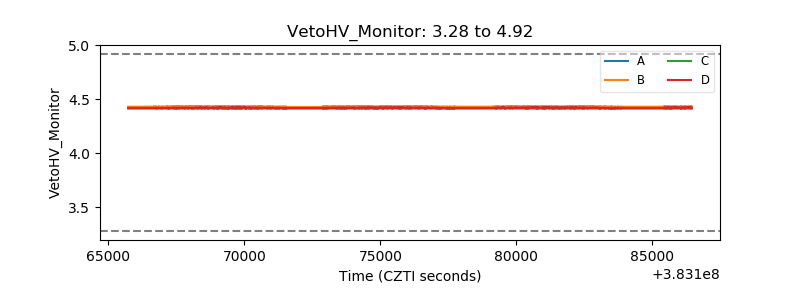 |
| Veto LLD | 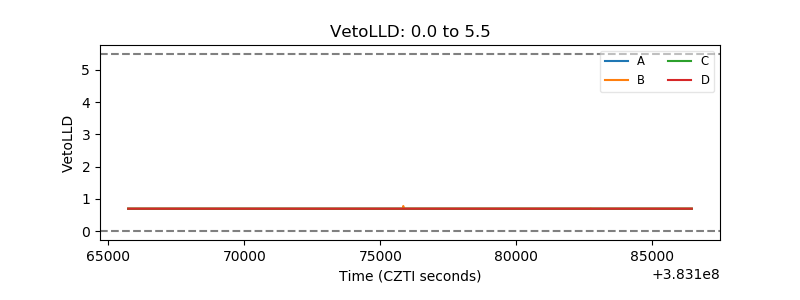 |
| Alpha Counter | 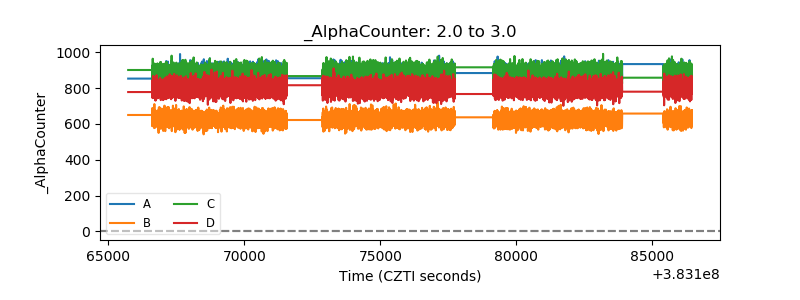 |
| _CPM_Rate | 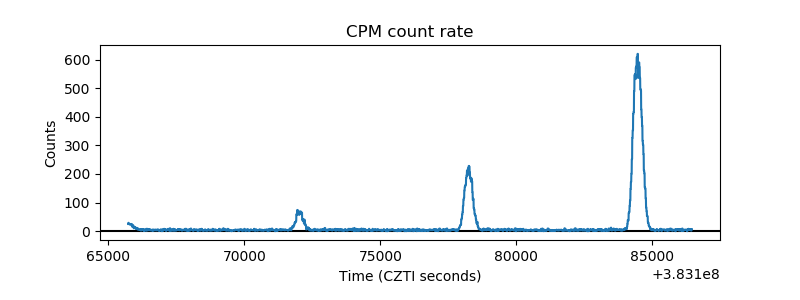 |
| CZT Counter | 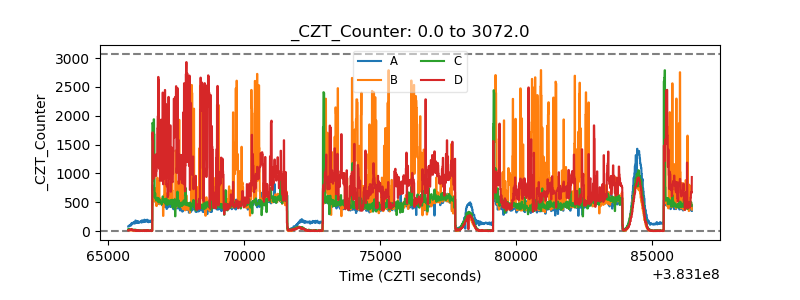 |
| +2.5 Volts monitor |  |
| +5 Volts monitor |  |
| _ROLL_ROT | 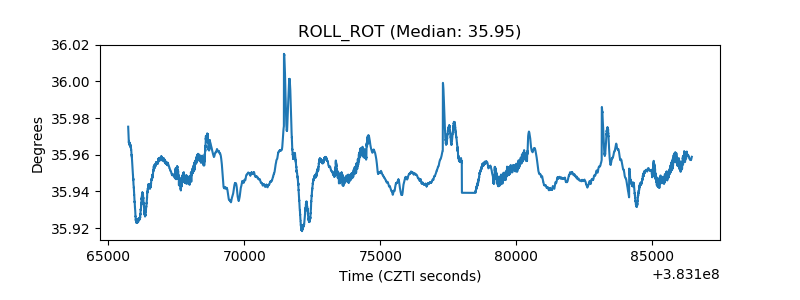 |
| _Roll_DEC | 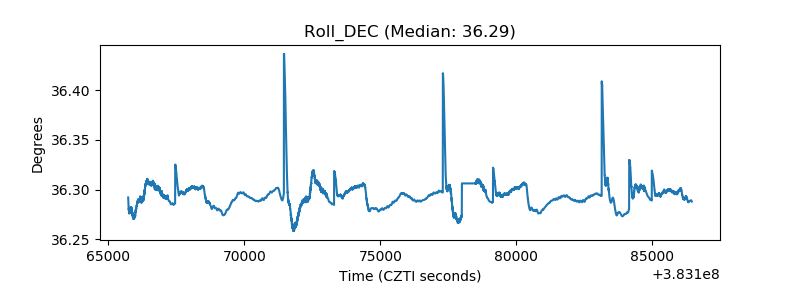 |
| _Roll_RA |  |
| Veto Counter | 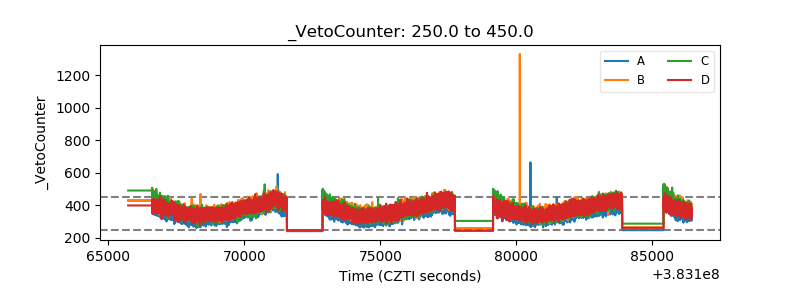 |