| Param | Original file | Final file |
|---|---|---|
| Filename | modeM0/AS1T05_008T01_9000004956cztM0_level2.fits | modeM0/AS1T05_008T01_9000004956cztM0_level2_quad_clean.evt |
| Size (bytes) | 1,548,025,920 | 1,555,620,480 |
| Size | 1.4 GB | 1.4 GB |
| Events in quadrant A | 9,665,984 | 9,570,186 |
| Events in quadrant B | 8,892,898 | 9,038,631 |
| Events in quadrant C | 9,262,884 | 9,178,057 |
| Events in quadrant D | 7,776,702 | 8,048,574 |
| Mode SS | |||
|---|---|---|---|
| Quadrant | BADHDUFLAG | Total packets | Discarded packets |
| A | 0 | 3362 | 0 |
| B | 0 | 3362 | 0 |
| C | 0 | 3362 | 0 |
| D | 0 | 3362 | 0 |
| Mode M9 | |||
|---|---|---|---|
| Quadrant | BADHDUFLAG | Total packets | Discarded packets |
| A | 0 | 609 | 0 |
| B | 0 | 609 | 0 |
| C | 0 | 609 | 0 |
| D | 0 | 609 | 0 |
| Mode M0 | |||
|---|---|---|---|
| Quadrant | BADHDUFLAG | Total packets | Discarded packets |
| A | 0 | 337016 | 0 |
| B | 0 | 429361 | 0 |
| C | 0 | 349747 | 0 |
| D | 0 | 586422 | 0 |
| Quadrant | Total seconds | Saturated seconds | Saturation percentage |
|---|---|---|---|
| A | 164636 | 357 | 0.216842% |
| B | 164620 | 9077 | 5.513911% |
| C | 164628 | 1163 | 0.706441% |
| D | 164610 | 8887 | 5.398821% |
Noise dominated data is calculated using 1-second bins in cleaned event files. If a bin has >2000 counts, and if more than 50% of those come from <1% of pixels, then it is considered to be noise-dominated and hence unusable.
| Quadrant | # 1 sec bins | Bins with >0 counts | Bins with >2000 counts | High rate bins dominated by noise | Noise dominated (total time) | Noise dominated (detector-on time) | Marked lightcurve |
|---|---|---|---|---|---|---|---|
| A | 223463 | 164656 | 0 | 0 | 0.00% | 0.00% |  |
| B | 223463 | 164565 | 0 | 0 | 0.00% | 0.00% |  |
| C | 223463 | 164627 | 0 | 0 | 0.00% | 0.00% |  |
| D | 223463 | 164518 | 0 | 0 | 0.00% | 0.00% | 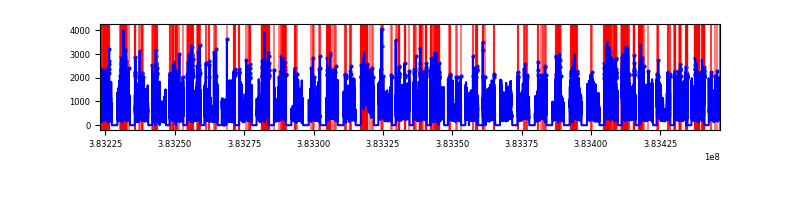 |
Top three noisy pixels from each quadrant. If the there are fewer than three noisy pixels in the level2.evt file, extra rows are filled as -1
| Pixel properties | Quadrant properties | ||||||
|---|---|---|---|---|---|---|---|
| Quadrant | DetID | PixID | Counts | Sigma | Mean | Median | Sigma |
| A | 9 | 19 | 7796 | 8.9 | 2524 | 2379 | 608.5 |
| A | 7 | 110 | 7770 | 8.86 | 2524 | 2379 | 608.5 |
| A | 0 | 29 | 7717 | 8.77 | 2524 | 2379 | 608.5 |
| B | 2 | 9 | 7899 | 12.4 | 2359 | 2259 | 454.7 |
| B | 3 | 80 | 6887 | 10.18 | 2359 | 2259 | 454.7 |
| B | 2 | 8 | 6192 | 8.65 | 2359 | 2259 | 454.7 |
| C | 1 | 81 | 7673 | 8.71 | 2452 | 2306 | 615.9 |
| C | 1 | 80 | 7474 | 8.39 | 2452 | 2306 | 615.9 |
| C | 3 | 203 | 7318 | 8.14 | 2452 | 2306 | 615.9 |
| D | 7 | 3 | 5757 | 6.36 | 2233 | 2040 | 584.5 |
| D | 10 | 189 | 5717 | 6.29 | 2233 | 2040 | 584.5 |
| D | 4 | 160 | 5707 | 6.27 | 2233 | 2040 | 584.5 |
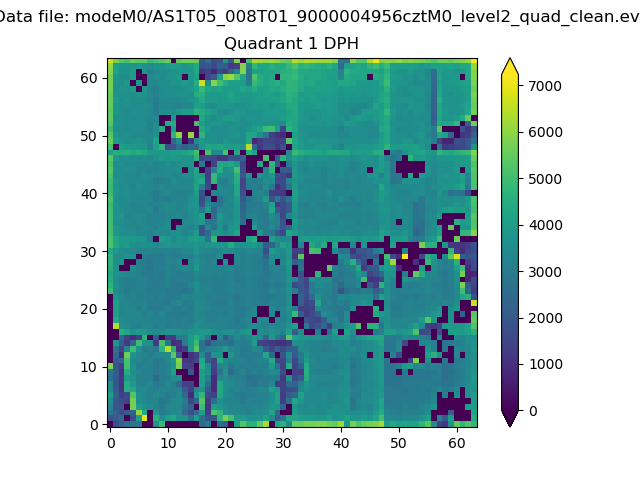
Histogram calculated using DETX and DETY for each event in the final _common_clean file
| Quadrant A |  |
 |
Quadrant B |
|---|---|---|---|
| Quadrant D |  |
 |
Quadrant C |
| Plot type | Count rate plots | Images |
|---|---|---|
| Comparison with Poisson distribution Blue bars denote a histogram of data divided into 1 sec bins. Red curve is a Poisson curve with rate = median count rate of data. |
 |
 |
| Quadrant-wise count rates Data is divided into 100 sec bins |
 |
|
| Module-wise count rates for Quadrant A Data is divided into 100 sec bins |
 |
 |
| Module-wise count rates for Quadrant B Data is divided into 100 sec bins |
 |
 |
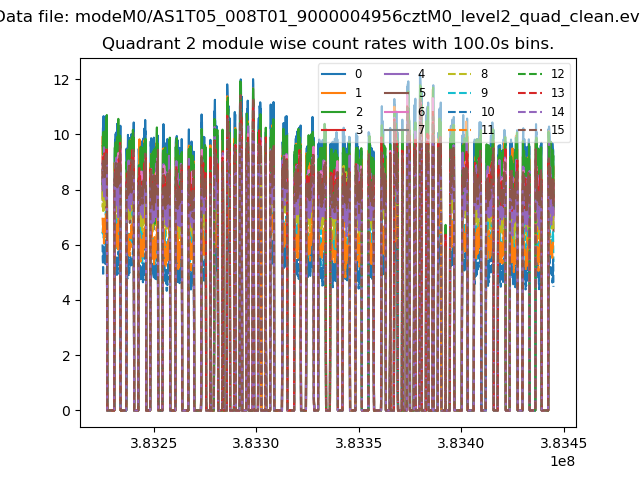
| Module-wise count rates for Quadrant C Data is divided into 100 sec bins |
 |
 |
| Module-wise count rates for Quadrant D Data is divided into 100 sec bins |
 |
 |
| Parameter | Plot |
|---|---|
| CZT HV Monitor |  |
| D_VDD |  |
| Temperature 1 |  |
| Veto HV Monitor |  |
| Veto LLD | 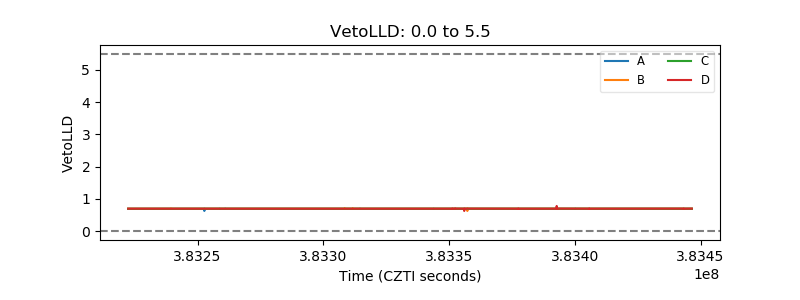 |
| Alpha Counter | 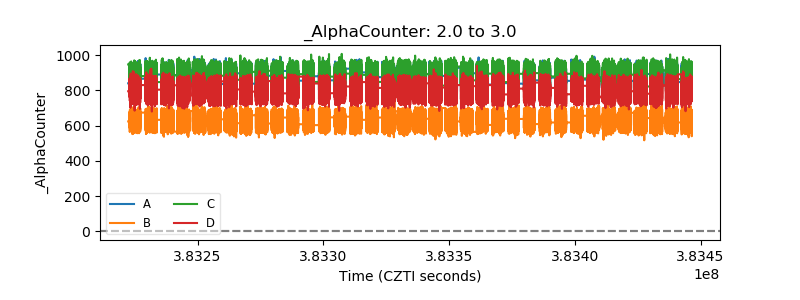 |
| _CPM_Rate |  |
| CZT Counter |  |
| +2.5 Volts monitor |  |
| +5 Volts monitor | 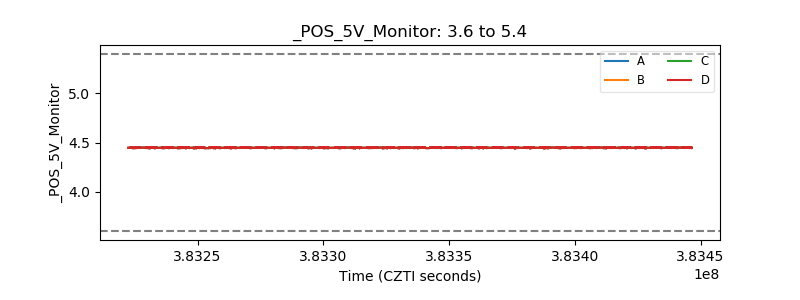 |
| _ROLL_ROT |  |
| _Roll_DEC |  |
| _Roll_RA | 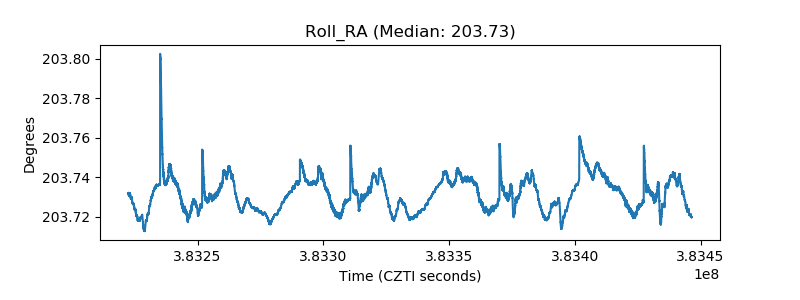 |
| Veto Counter |  |