| Param | Original file | Final file |
|---|---|---|
| Filename | modeM0/AS1T05_008T01_9000004956_34634cztM0_level2.evt | modeM0/AS1T05_008T01_9000004956_34634cztM0_level2_quad_clean.evt |
| Size (bytes) | 987,145,920 | 136,774,080 |
| Size | 941.4 MB | 130.4 MB |
| Events in quadrant A | 5,403,978 | 846,701 |
| Events in quadrant B | 7,977,325 | 825,189 |
| Events in quadrant C | 5,874,830 | 855,139 |
| Events in quadrant D | 9,848,230 | 804,093 |
| Mode SS | |||
|---|---|---|---|
| Quadrant | BADHDUFLAG | Total packets | Discarded packets |
| A | 0 | 240 | 0 |
| B | 0 | 240 | 0 |
| C | 0 | 240 | 0 |
| D | 0 | 240 | 0 |
| Mode M9 | |||
|---|---|---|---|
| Quadrant | BADHDUFLAG | Total packets | Discarded packets |
| A | 0 | 45 | 0 |
| B | 0 | 45 | 0 |
| C | 0 | 45 | 0 |
| D | 0 | 45 | 0 |
| Mode M0 | |||
|---|---|---|---|
| Quadrant | BADHDUFLAG | Total packets | Discarded packets |
| A | 0 | 24027 | 38 |
| B | 0 | 31508 | 101 |
| C | 0 | 24730 | 62 |
| D | 0 | 37709 | 102 |
| Quadrant | Total seconds | Saturated seconds | Saturation percentage |
|---|---|---|---|
| A | 11735 | 20 | 0.170430% |
| B | 11722 | 816 | 6.961269% |
| C | 11722 | 43 | 0.366832% |
| D | 11716 | 322 | 2.748378% |
Noise dominated data is calculated using 1-second bins in cleaned event files. If a bin has >2000 counts, and if more than 50% of those come from <1% of pixels, then it is considered to be noise-dominated and hence unusable.
| Quadrant | # 1 sec bins | Bins with >0 counts | Bins with >2000 counts | High rate bins dominated by noise | Noise dominated (total time) | Noise dominated (detector-on time) | Marked lightcurve |
|---|---|---|---|---|---|---|---|
| A | 16240 | 11756 | 3 | 3 | 0.02% | 0.03% | 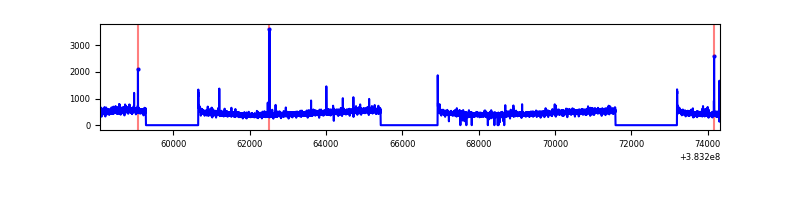 |
| B | 16240 | 11749 | 555 | 555 | 3.42% | 4.72% | 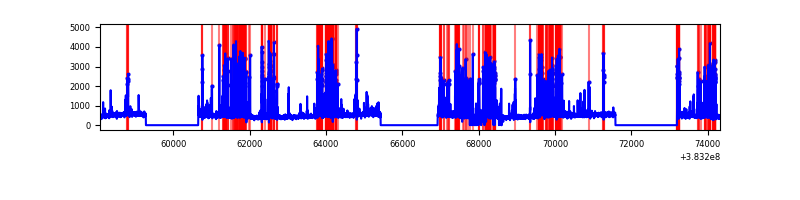 |
| C | 16240 | 11748 | 17 | 17 | 0.10% | 0.14% | 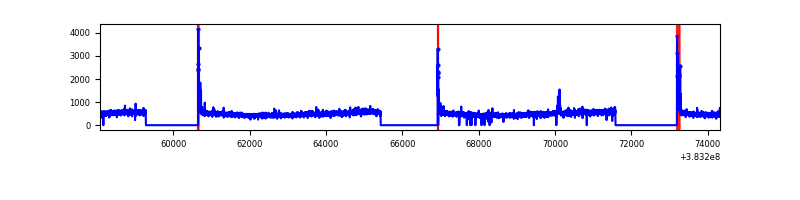 |
| D | 16240 | 11748 | 188 | 188 | 1.16% | 1.60% | 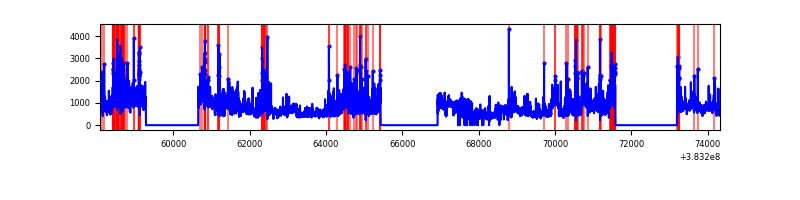 |
Top three noisy pixels from each quadrant. If the there are fewer than three noisy pixels in the level2.evt file, extra rows are filled as -1
| Pixel properties | Quadrant properties | ||||||
|---|---|---|---|---|---|---|---|
| Quadrant | DetID | PixID | Counts | Sigma | Mean | Median | Sigma |
| A | 10 | 83 | 75509 | 272.32 | 1357 | 1326 | 272.4 |
| A | 15 | 169 | 40223 | 142.78 | 1357 | 1326 | 272.4 |
| A | 9 | 143 | 22319 | 77.06 | 1357 | 1326 | 272.4 |
| B | 5 | 172 | 2503695 | 10029.94 | 1310 | 1274 | 249.5 |
| B | 0 | 189 | 69202 | 272.26 | 1310 | 1274 | 249.5 |
| B | 10 | 245 | 65881 | 258.95 | 1310 | 1274 | 249.5 |
| C | 15 | 214 | 488030 | 1619.68 | 1307 | 1318 | 300.5 |
| C | 0 | 10 | 144096 | 475.14 | 1307 | 1318 | 300.5 |
| C | 14 | 67 | 92656 | 303.96 | 1307 | 1318 | 300.5 |
| D | 8 | 195 | 3207059 | 9864.85 | 1297 | 1263 | 325.0 |
| D | 10 | 199 | 232199 | 710.63 | 1297 | 1263 | 325.0 |
| D | 13 | 249 | 216591 | 662.61 | 1297 | 1263 | 325.0 |
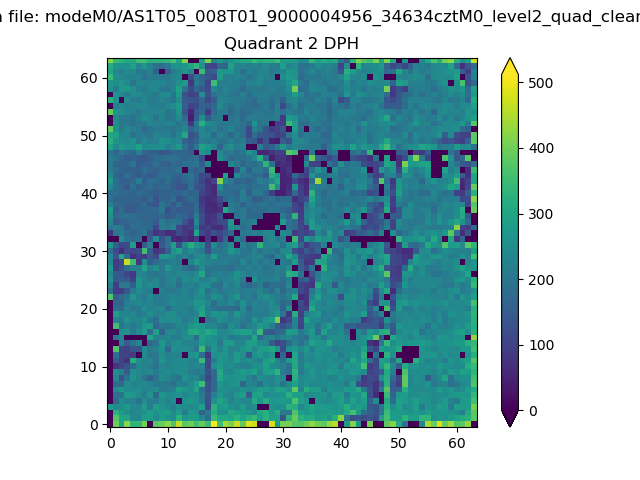
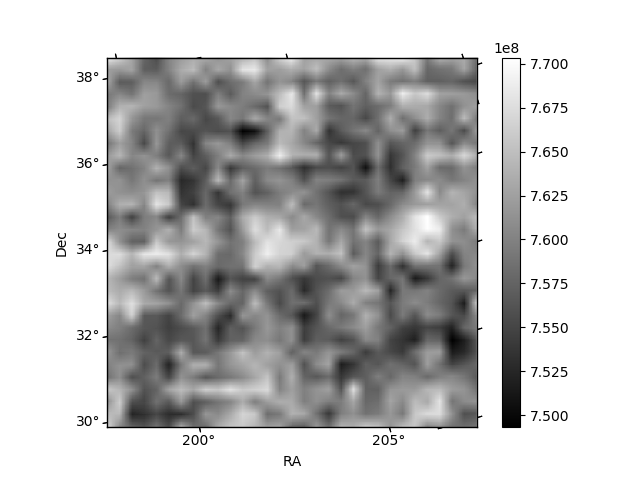
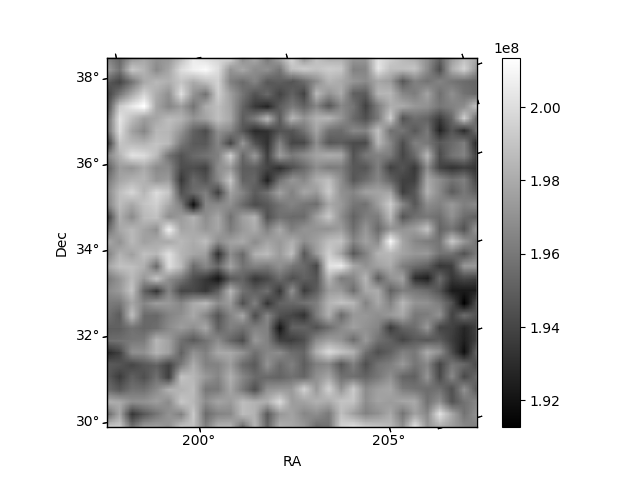
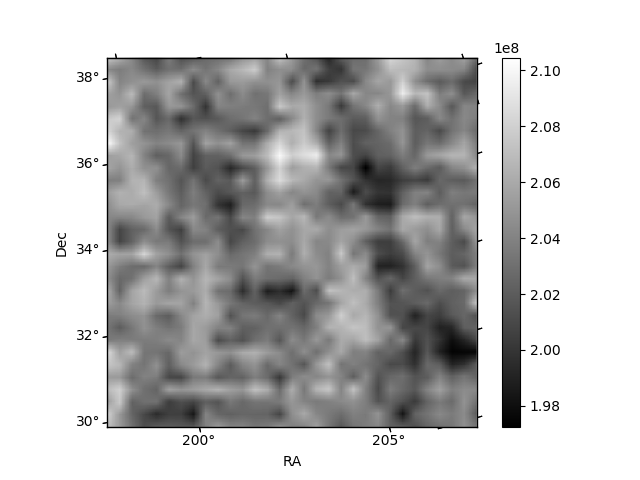
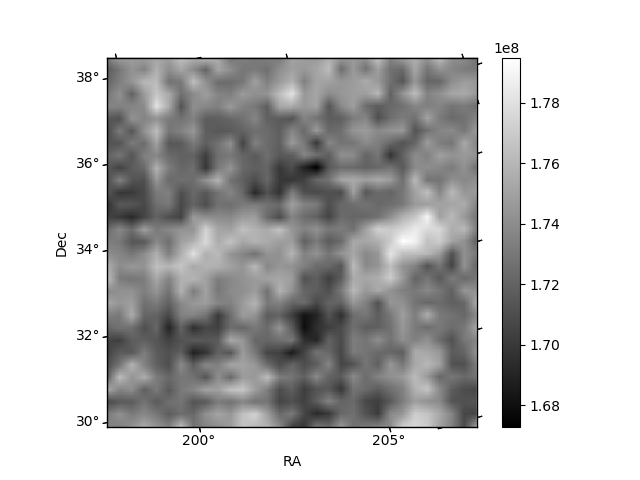
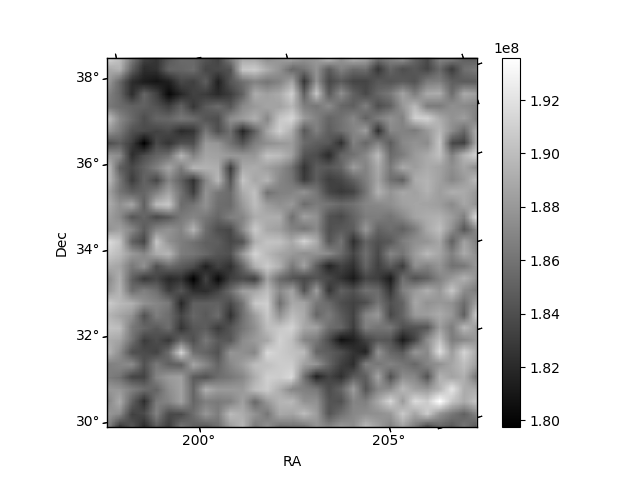
Histogram calculated using DETX and DETY for each event in the final _common_clean file
| Quadrant A | 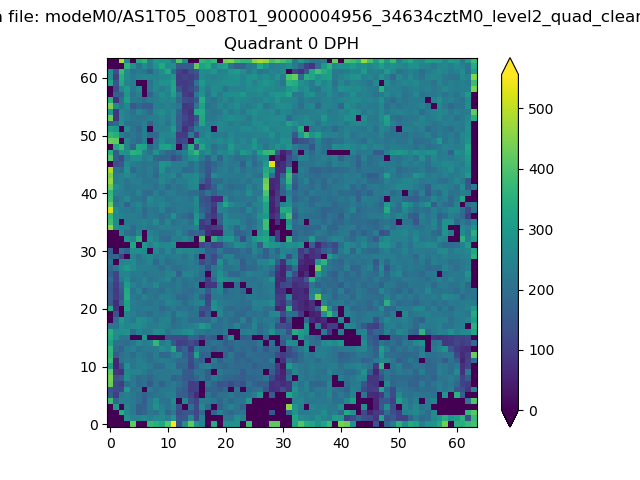 |
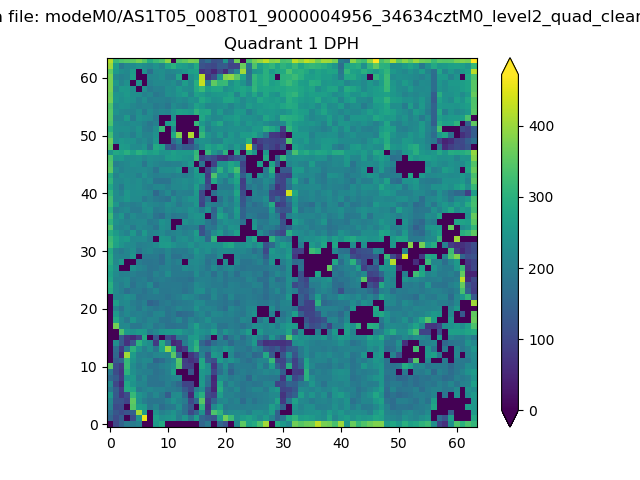 |
Quadrant B |
|---|---|---|---|
| Quadrant D | 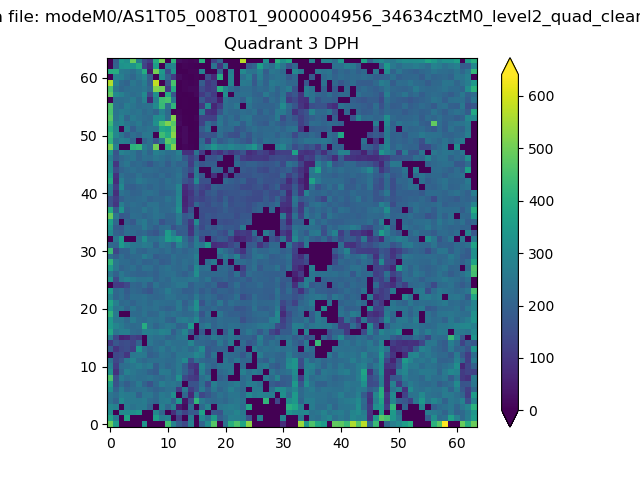 |
 |
Quadrant C |
| Plot type | Count rate plots | Images |
|---|---|---|
| Comparison with Poisson distribution Blue bars denote a histogram of data divided into 1 sec bins. Red curve is a Poisson curve with rate = median count rate of data. |
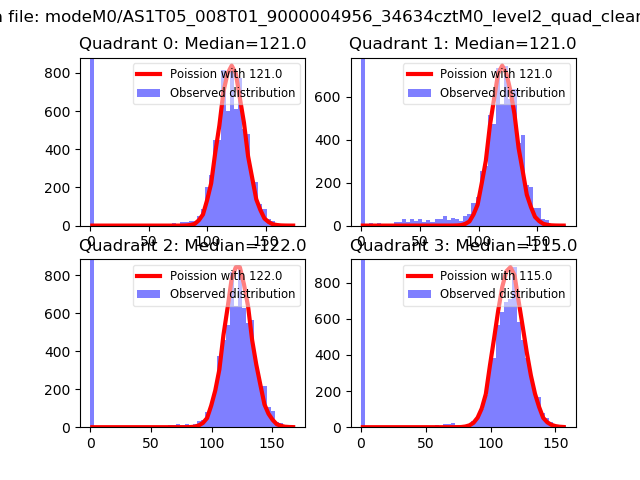 |
 |
| Quadrant-wise count rates Data is divided into 100 sec bins |
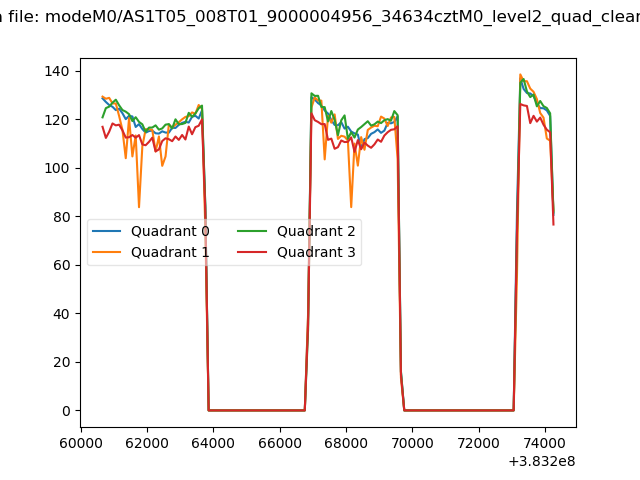 |
|
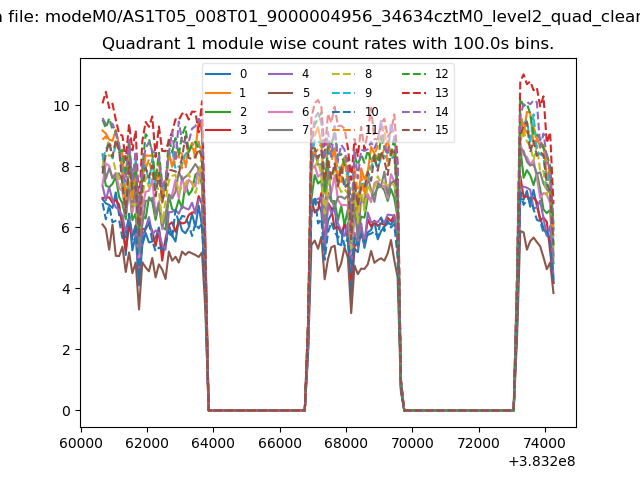
| Module-wise count rates for Quadrant A Data is divided into 100 sec bins |
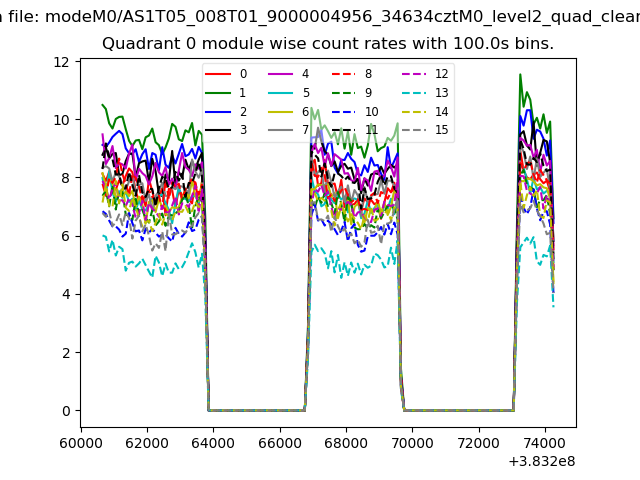 |
 |
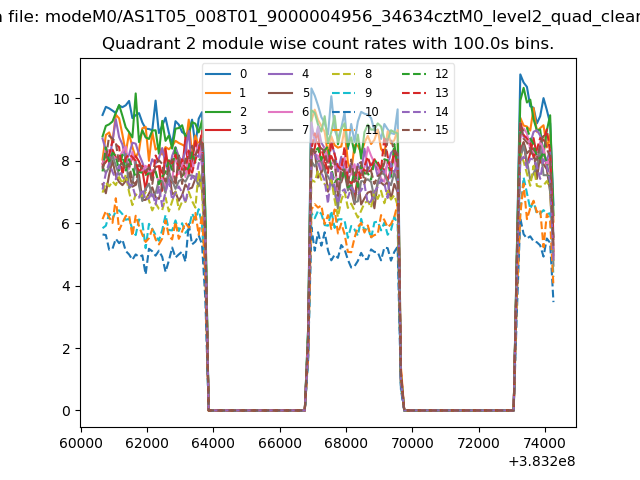
| Module-wise count rates for Quadrant B Data is divided into 100 sec bins |
 |
 |
| Module-wise count rates for Quadrant C Data is divided into 100 sec bins |
 |
 |
| Module-wise count rates for Quadrant D Data is divided into 100 sec bins |
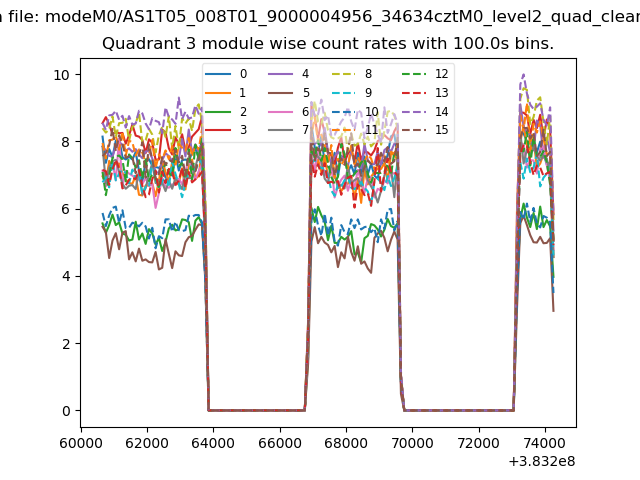 |
 |
| Parameter | Plot |
|---|---|
| CZT HV Monitor | 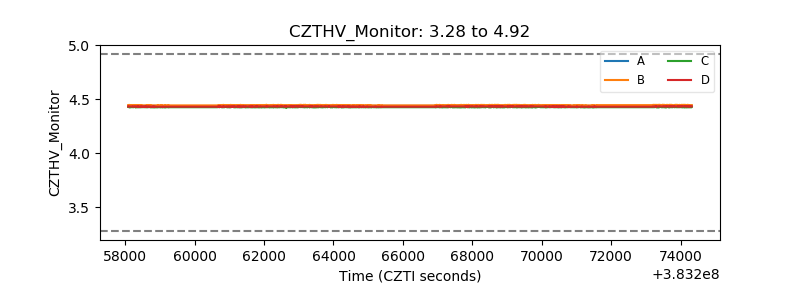 |
| D_VDD | 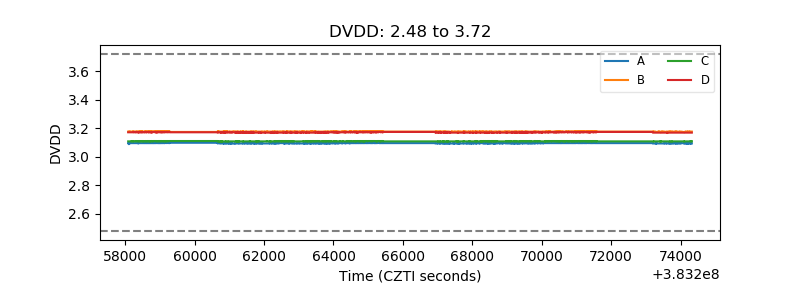 |
| Temperature 1 | 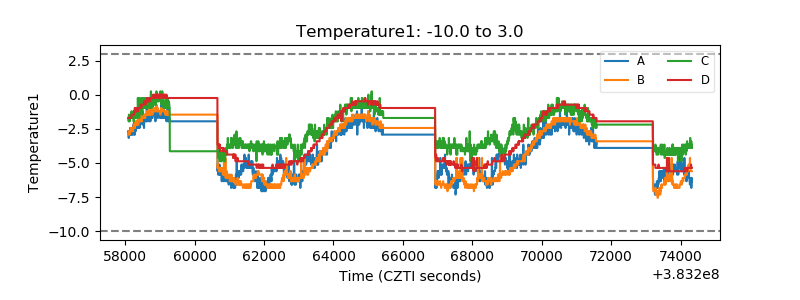 |
| Veto HV Monitor | 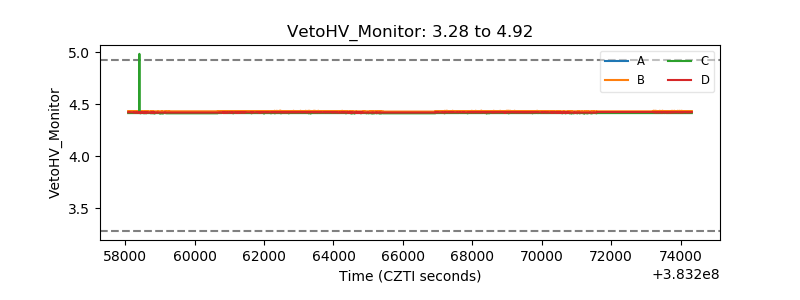 |
| Veto LLD | 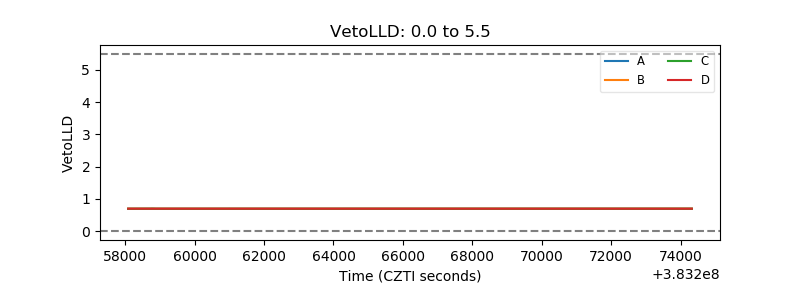 |
| Alpha Counter | 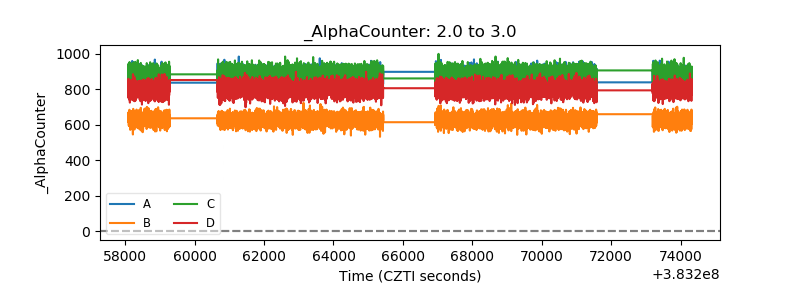 |
| _CPM_Rate | 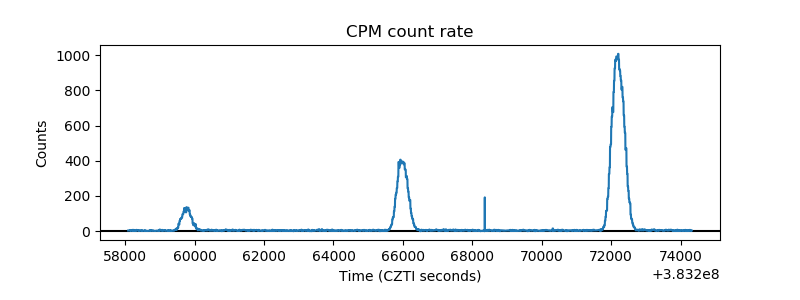 |
| CZT Counter | 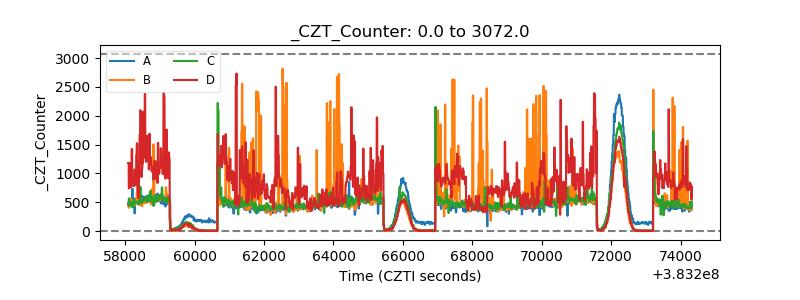 |
| +2.5 Volts monitor |  |
| +5 Volts monitor | 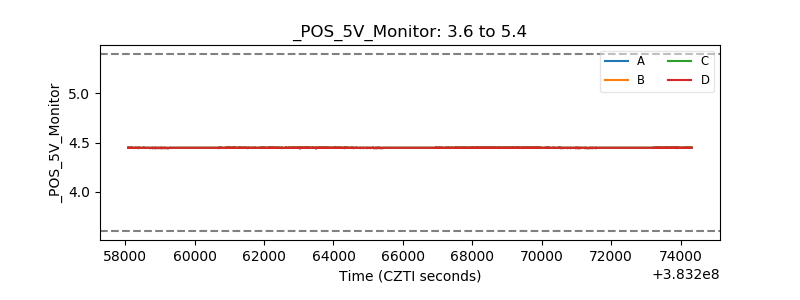 |
| _ROLL_ROT | 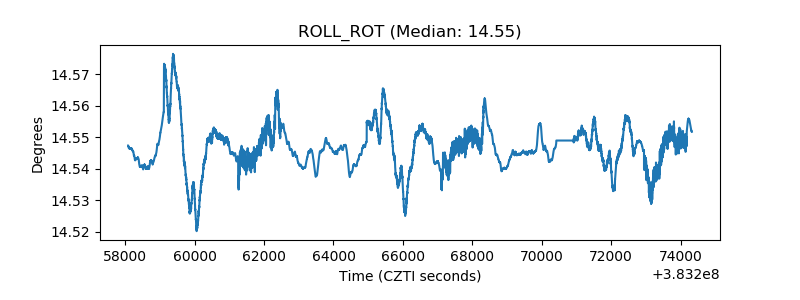 |
| _Roll_DEC | 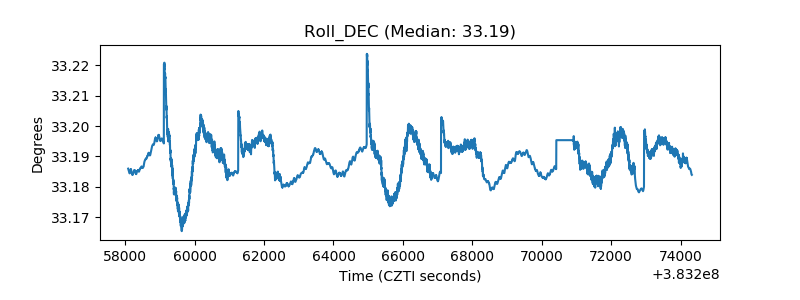 |
| _Roll_RA | 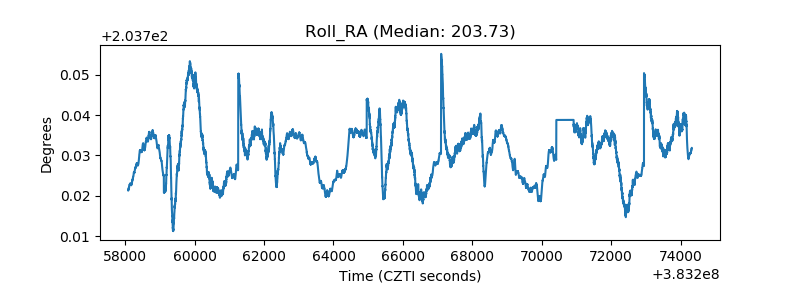 |
| Veto Counter | 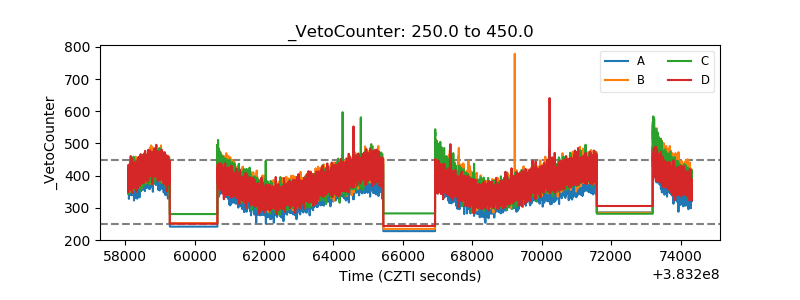 |