| Param | Original file | Final file |
|---|---|---|
| Filename | modeM0/AS1T05_008T01_9000004956_34663cztM0_level2.evt | modeM0/AS1T05_008T01_9000004956_34663cztM0_level2_quad_clean.evt |
| Size (bytes) | 513,492,480 | 72,984,960 |
| Size | 489.7 MB | 69.6 MB |
| Events in quadrant A | 2,581,420 | 467,861 |
| Events in quadrant B | 4,003,544 | 453,861 |
| Events in quadrant C | 2,890,280 | 471,897 |
| Events in quadrant D | 5,699,965 | 428,016 |
| Mode SS | |||
|---|---|---|---|
| Quadrant | BADHDUFLAG | Total packets | Discarded packets |
| A | 0 | 114 | 0 |
| B | 0 | 114 | 0 |
| C | 0 | 114 | 0 |
| D | 0 | 114 | 0 |
| Mode M9 | |||
|---|---|---|---|
| Quadrant | BADHDUFLAG | Total packets | Discarded packets |
| A | 0 | 31 | 0 |
| B | 0 | 31 | 0 |
| C | 0 | 31 | 0 |
| D | 0 | 31 | 0 |
| Mode M0 | |||
|---|---|---|---|
| Quadrant | BADHDUFLAG | Total packets | Discarded packets |
| A | 0 | 11494 | 3 |
| B | 0 | 15586 | 2 |
| C | 0 | 11994 | 2 |
| D | 0 | 20698 | 2 |
| Quadrant | Total seconds | Saturated seconds | Saturation percentage |
|---|---|---|---|
| A | 5550 | 22 | 0.396396% |
| B | 5550 | 451 | 8.126126% |
| C | 5550 | 53 | 0.954955% |
| D | 5550 | 570 | 10.270270% |
Noise dominated data is calculated using 1-second bins in cleaned event files. If a bin has >2000 counts, and if more than 50% of those come from <1% of pixels, then it is considered to be noise-dominated and hence unusable.
| Quadrant | # 1 sec bins | Bins with >0 counts | Bins with >2000 counts | High rate bins dominated by noise | Noise dominated (total time) | Noise dominated (detector-on time) | Marked lightcurve |
|---|---|---|---|---|---|---|---|
| A | 8625 | 5552 | 10 | 10 | 0.12% | 0.18% | 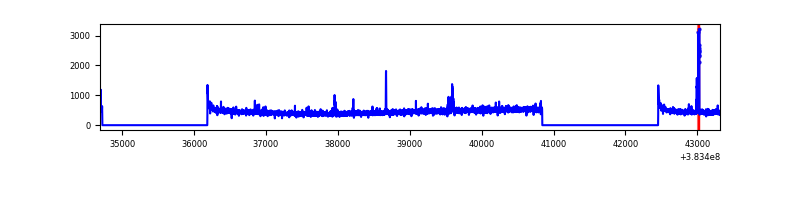 |
| B | 8625 | 5552 | 309 | 309 | 3.58% | 5.57% | 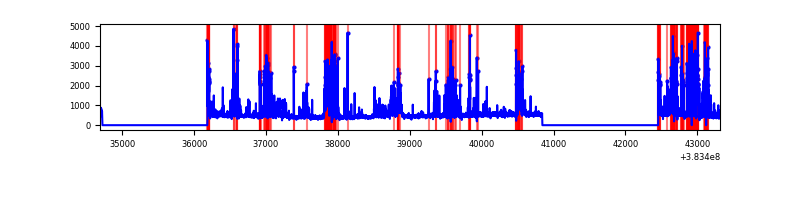 |
| C | 8625 | 5552 | 29 | 29 | 0.34% | 0.52% | 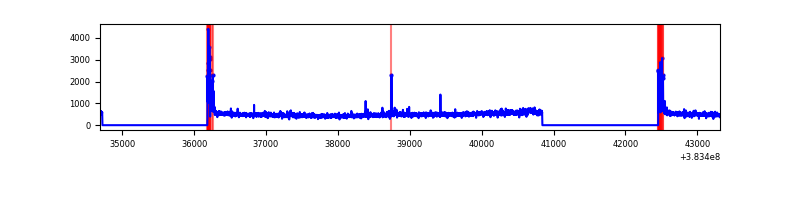 |
| D | 8625 | 5552 | 432 | 432 | 5.01% | 7.78% | 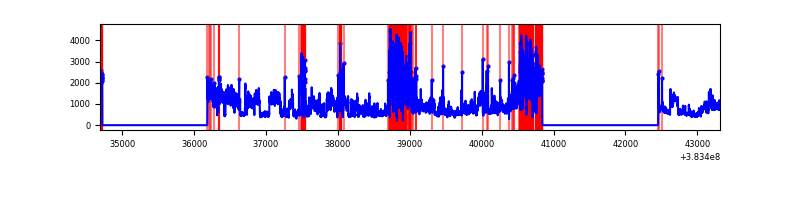 |
Top three noisy pixels from each quadrant. If the there are fewer than three noisy pixels in the level2.evt file, extra rows are filled as -1
| Pixel properties | Quadrant properties | ||||||
|---|---|---|---|---|---|---|---|
| Quadrant | DetID | PixID | Counts | Sigma | Mean | Median | Sigma |
| A | 15 | 174 | 55077 | 432.61 | 629 | 617 | 125.9 |
| A | 10 | 83 | 46333 | 363.15 | 629 | 617 | 125.9 |
| A | 7 | 16 | 34682 | 270.6 | 629 | 617 | 125.9 |
| B | 5 | 172 | 1160708 | 9966.63 | 608 | 592 | 116.4 |
| B | 5 | 255 | 375264 | 3218.83 | 608 | 592 | 116.4 |
| B | 4 | 232 | 23871 | 199.99 | 608 | 592 | 116.4 |
| C | 15 | 214 | 234510 | 1650.47 | 611 | 616 | 141.7 |
| C | 0 | 10 | 170515 | 1198.89 | 611 | 616 | 141.7 |
| C | 14 | 67 | 83200 | 582.75 | 611 | 616 | 141.7 |
| D | 8 | 195 | 2126920 | 14920.06 | 581 | 563 | 142.5 |
| D | 2 | 249 | 499019 | 3497.53 | 581 | 563 | 142.5 |
| D | 12 | 233 | 385796 | 2703.07 | 581 | 563 | 142.5 |
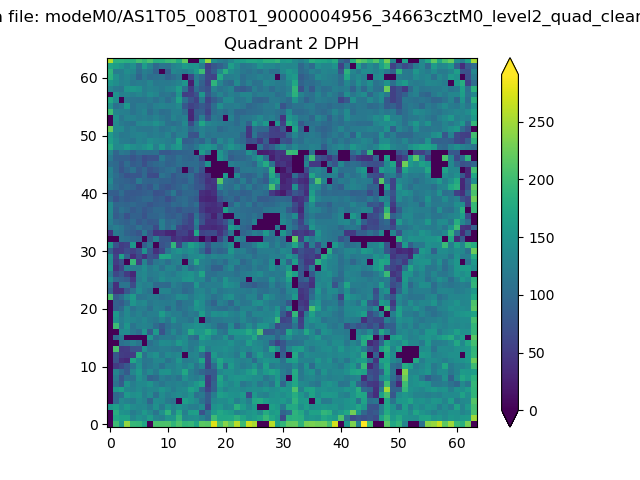
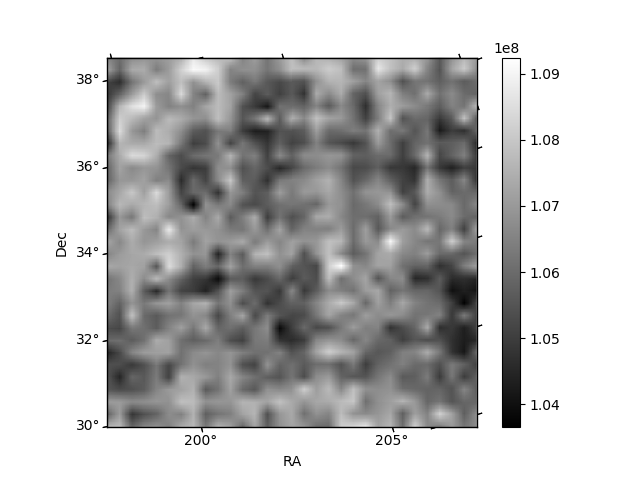
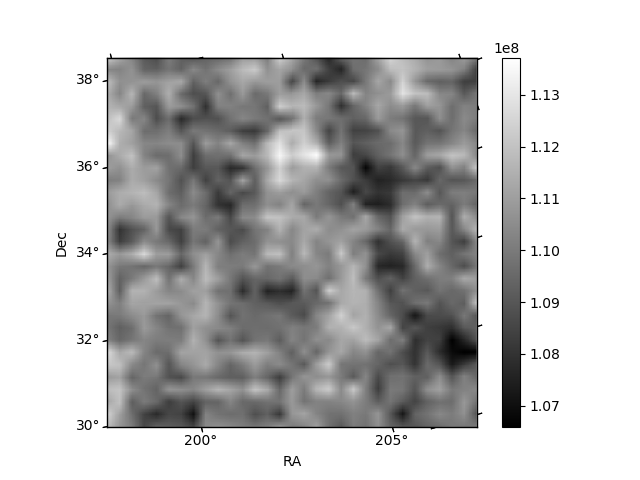
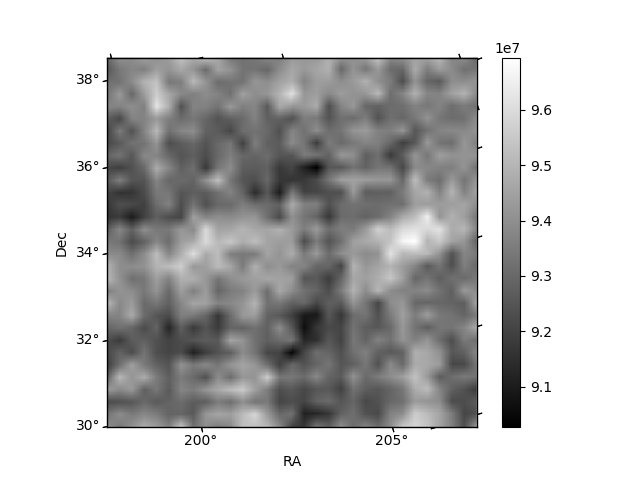
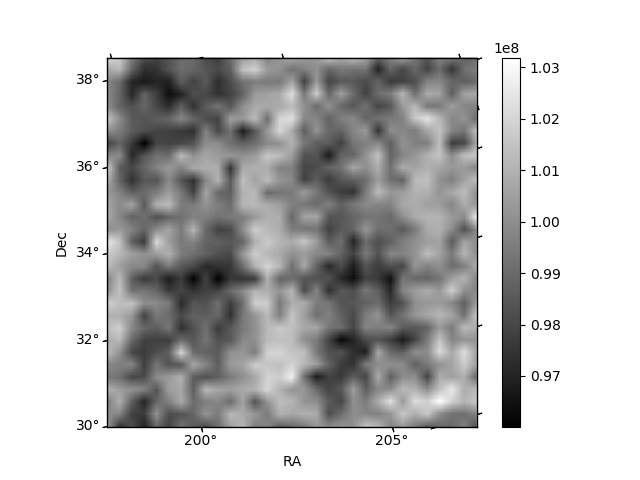
Histogram calculated using DETX and DETY for each event in the final _common_clean file
| Quadrant A | 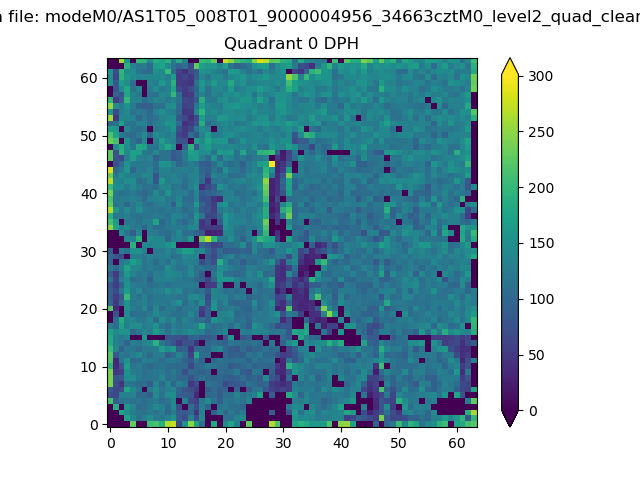 |
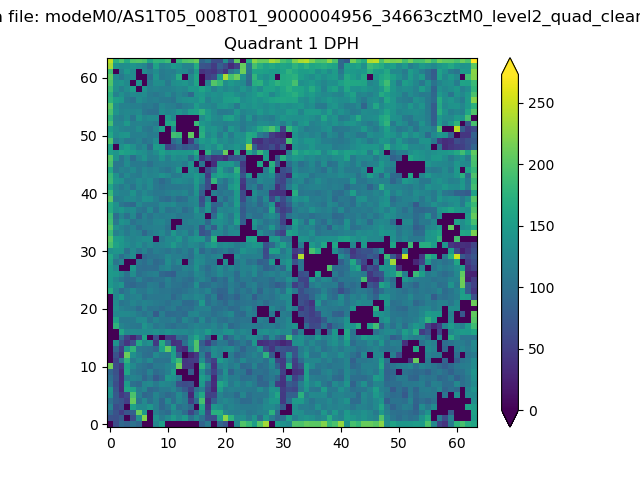 |
Quadrant B |
|---|---|---|---|
| Quadrant D | 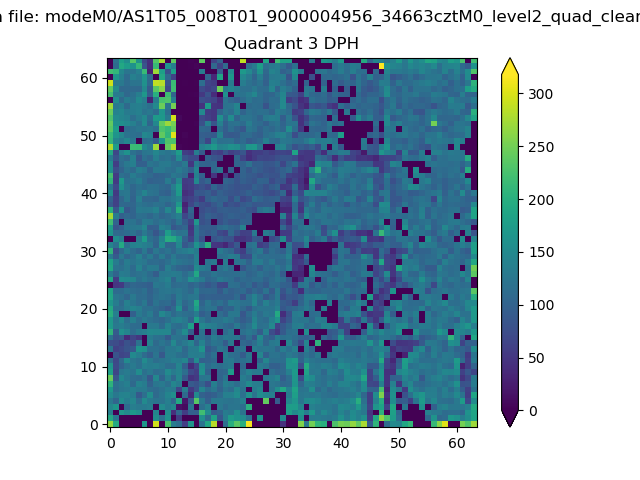 |
 |
Quadrant C |
| Plot type | Count rate plots | Images |
|---|---|---|
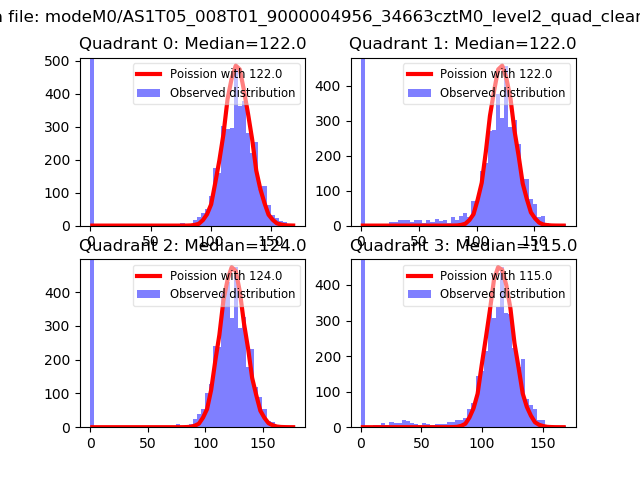
| Comparison with Poisson distribution Blue bars denote a histogram of data divided into 1 sec bins. Red curve is a Poisson curve with rate = median count rate of data. |
 |
 |
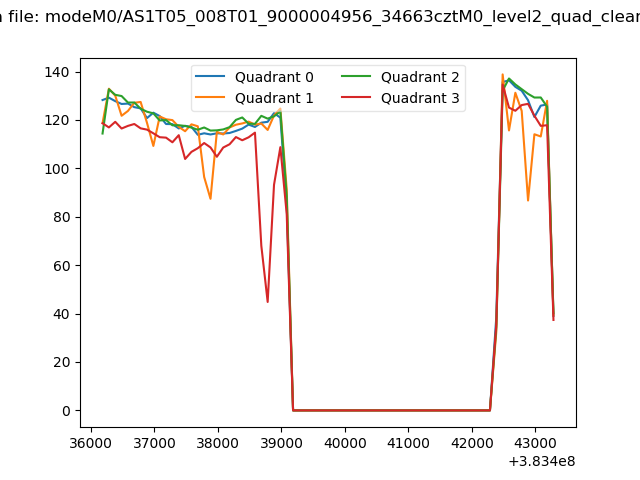
| Quadrant-wise count rates Data is divided into 100 sec bins |
 |
|
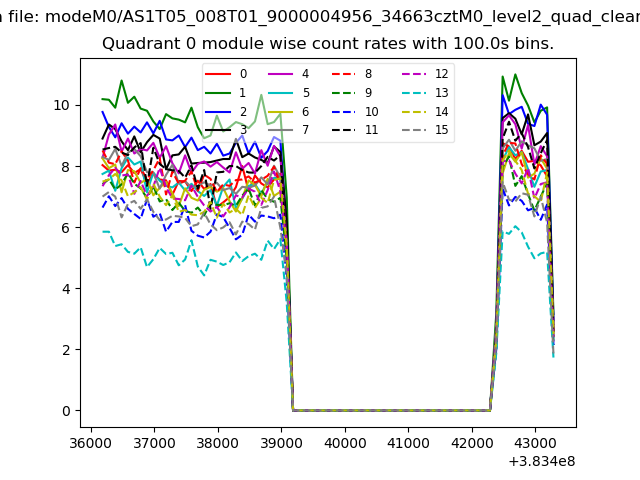
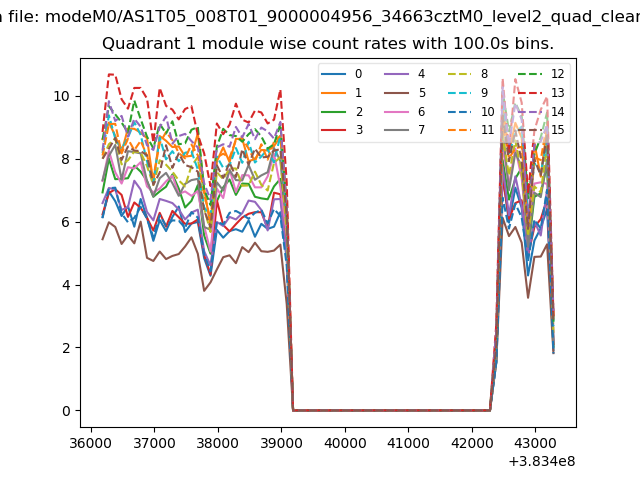
| Module-wise count rates for Quadrant A Data is divided into 100 sec bins |
 |
 |
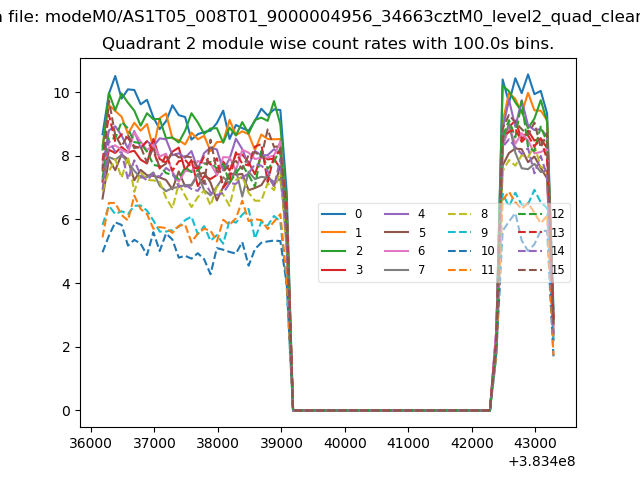
| Module-wise count rates for Quadrant B Data is divided into 100 sec bins |
 |
 |
| Module-wise count rates for Quadrant C Data is divided into 100 sec bins |
 |
 |
| Module-wise count rates for Quadrant D Data is divided into 100 sec bins |
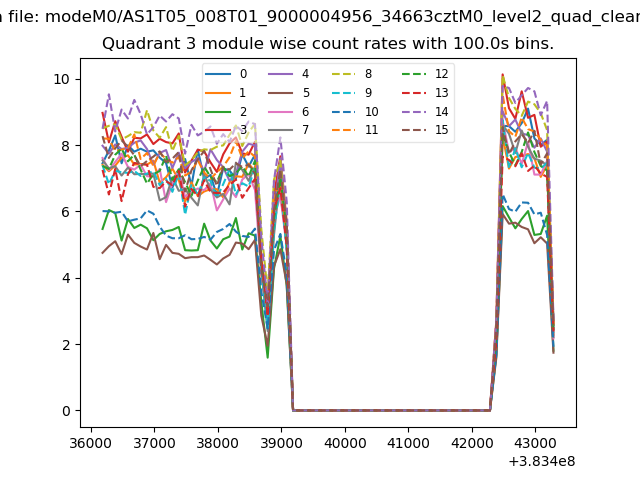 |
 |
| Parameter | Plot |
|---|---|
| CZT HV Monitor | 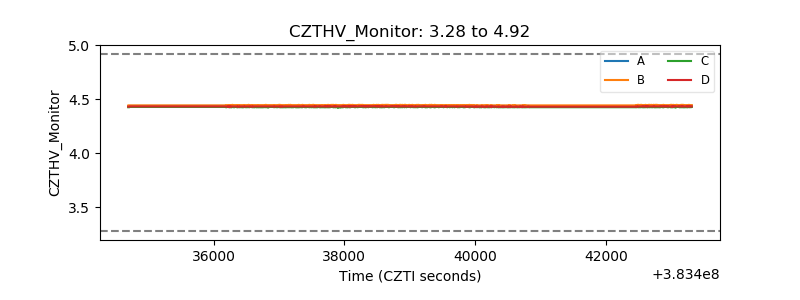 |
| D_VDD | 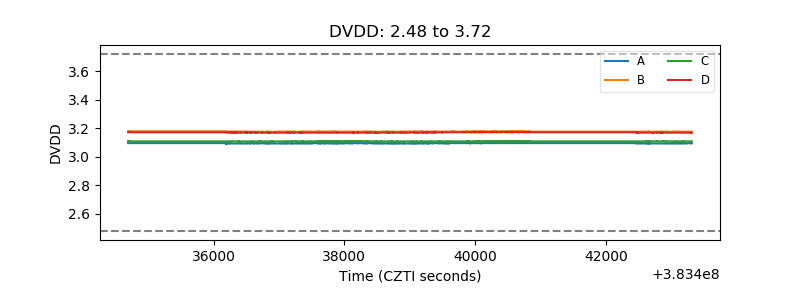 |
| Temperature 1 | 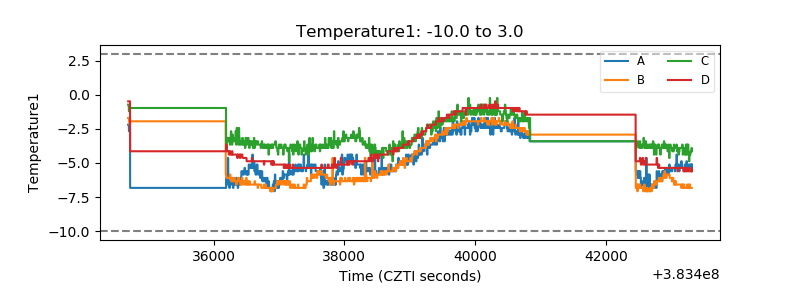 |
| Veto HV Monitor | 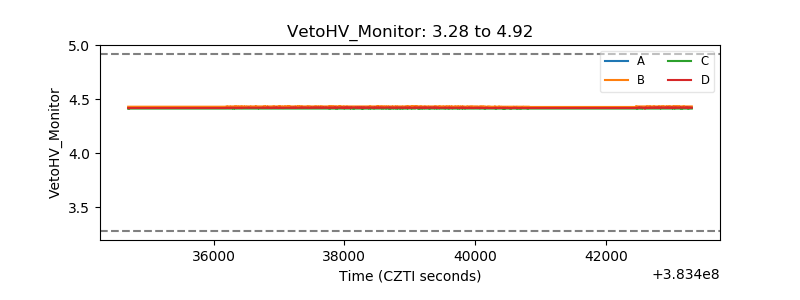 |
| Veto LLD | 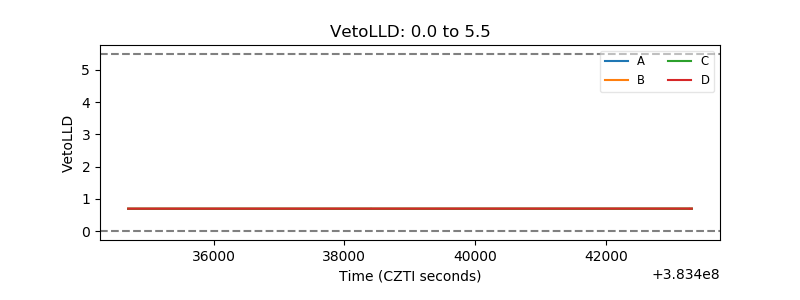 |
| Alpha Counter | 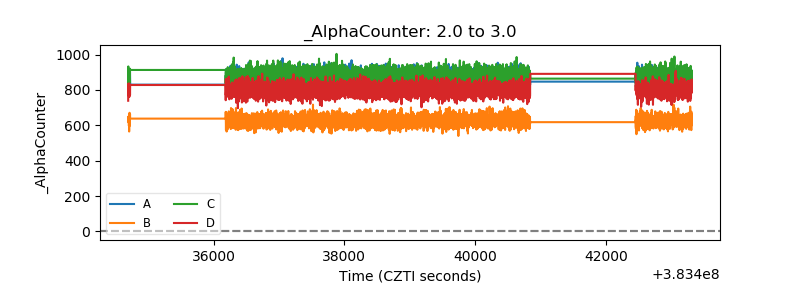 |
| _CPM_Rate | 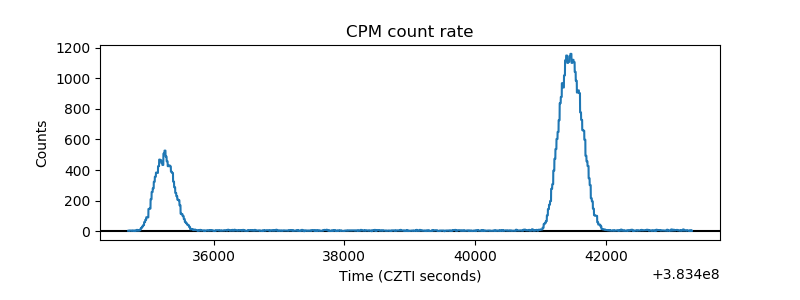 |
| CZT Counter | 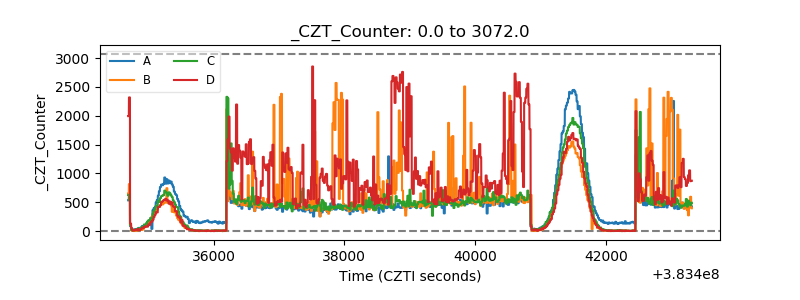 |
| +2.5 Volts monitor |  |
| +5 Volts monitor |  |
| _ROLL_ROT | 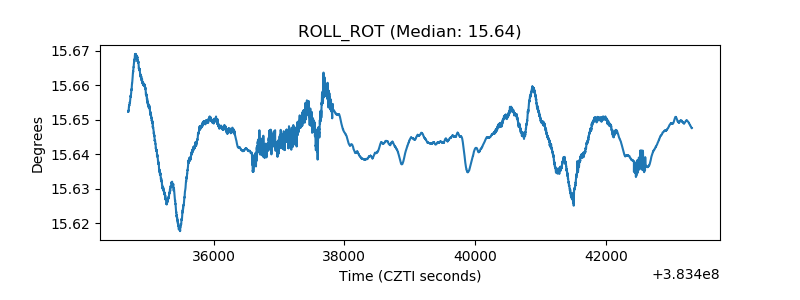 |
| _Roll_DEC | 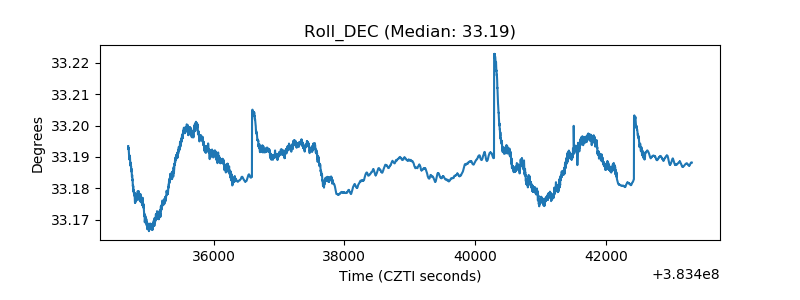 |
| _Roll_RA | 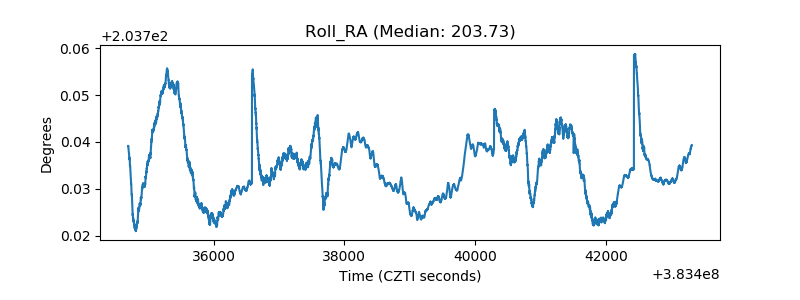 |
| Veto Counter | 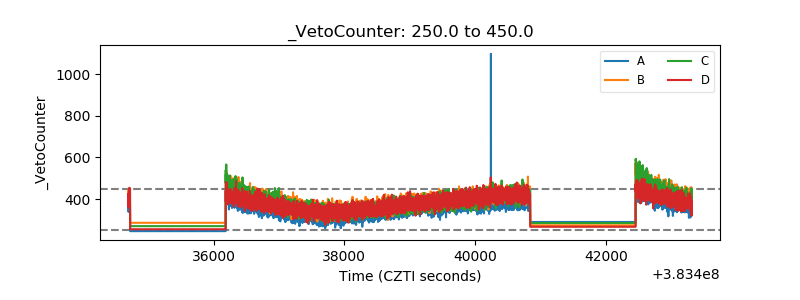 |