| Param | Original file | Final file |
|---|---|---|
| Filename | modeM0/AS1A11_065T06_9000004958cztM0_level2.fits | modeM0/AS1A11_065T06_9000004958cztM0_level2_quad_clean.evt |
| Size (bytes) | 287,380,800 | 269,271,360 |
| Size | 274.1 MB | 256.8 MB |
| Events in quadrant A | 1,782,916 | 1,544,308 |
| Events in quadrant B | 1,708,182 | 1,680,186 |
| Events in quadrant C | 1,769,014 | 1,636,351 |
| Events in quadrant D | 1,461,120 | 1,312,400 |
| Mode M0 | |||
|---|---|---|---|
| Quadrant | BADHDUFLAG | Total packets | Discarded packets |
| A | 0 | 85146 | 0 |
| B | 0 | 81538 | 0 |
| C | 0 | 63378 | 0 |
| D | 0 | 111472 | 0 |
| Mode SS | |||
|---|---|---|---|
| Quadrant | BADHDUFLAG | Total packets | Discarded packets |
| A | 0 | 588 | 0 |
| B | 0 | 588 | 0 |
| C | 0 | 588 | 0 |
| D | 0 | 588 | 0 |
| Mode M9 | |||
|---|---|---|---|
| Quadrant | BADHDUFLAG | Total packets | Discarded packets |
| A | 0 | 131 | 0 |
| B | 0 | 131 | 0 |
| C | 0 | 131 | 0 |
| D | 0 | 131 | 0 |
| Quadrant | Total seconds | Saturated seconds | Saturation percentage |
|---|---|---|---|
| A | 28797 | 2320 | 8.056395% |
| B | 28797 | 2195 | 7.622322% |
| C | 28797 | 251 | 0.871619% |
| D | 28797 | 2631 | 9.136368% |
Noise dominated data is calculated using 1-second bins in cleaned event files. If a bin has >2000 counts, and if more than 50% of those come from <1% of pixels, then it is considered to be noise-dominated and hence unusable.
| Quadrant | # 1 sec bins | Bins with >0 counts | Bins with >2000 counts | High rate bins dominated by noise | Noise dominated (total time) | Noise dominated (detector-on time) | Marked lightcurve |
|---|---|---|---|---|---|---|---|
| A | 40843 | 28793 | 0 | 0 | 0.00% | 0.00% |  |
| B | 40843 | 28740 | 0 | 0 | 0.00% | 0.00% |  |
| C | 40843 | 28793 | 0 | 0 | 0.00% | 0.00% |  |
| D | 40843 | 28772 | 0 | 0 | 0.00% | 0.00% |  |
Top three noisy pixels from each quadrant. If the there are fewer than three noisy pixels in the level2.evt file, extra rows are filled as -1
| Pixel properties | Quadrant properties | ||||||
|---|---|---|---|---|---|---|---|
| Quadrant | DetID | PixID | Counts | Sigma | Mean | Median | Sigma |
| A | 0 | 29 | 1466 | 9.02 | 466 | 443 | 113.4 |
| A | 9 | 19 | 1425 | 8.66 | 466 | 443 | 113.4 |
| A | 7 | 110 | 1408 | 8.51 | 466 | 443 | 113.4 |
| B | 2 | 9 | 1402 | 10.87 | 453 | 437 | 88.8 |
| B | 3 | 80 | 1326 | 10.02 | 453 | 437 | 88.8 |
| B | 5 | 128 | 1212 | 8.73 | 453 | 437 | 88.8 |
| C | 1 | 81 | 1414 | 8.16 | 468 | 442 | 119.2 |
| C | 3 | 202 | 1385 | 7.91 | 468 | 442 | 119.2 |
| C | 1 | 80 | 1379 | 7.86 | 468 | 442 | 119.2 |
| D | 7 | 3 | 1116 | 6.66 | 418 | 385 | 109.8 |
| D | 6 | 231 | 1094 | 6.46 | 418 | 385 | 109.8 |
| D | 10 | 189 | 1056 | 6.11 | 418 | 385 | 109.8 |
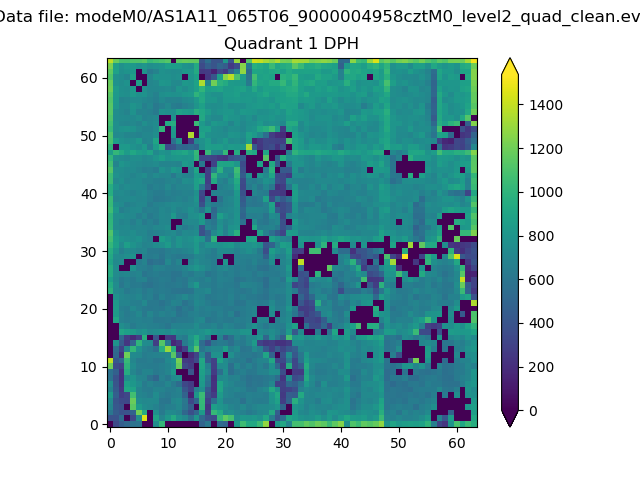
Histogram calculated using DETX and DETY for each event in the final _common_clean file
| Quadrant A |  |
 |
Quadrant B |
|---|---|---|---|
| Quadrant D |  |
 |
Quadrant C |
| Plot type | Count rate plots | Images |
|---|---|---|
| Comparison with Poisson distribution Blue bars denote a histogram of data divided into 1 sec bins. Red curve is a Poisson curve with rate = median count rate of data. |
 |
 |
| Quadrant-wise count rates Data is divided into 100 sec bins |
 |
|
| Module-wise count rates for Quadrant A Data is divided into 100 sec bins |
 |
 |
| Module-wise count rates for Quadrant B Data is divided into 100 sec bins |
 |
 |
| Module-wise count rates for Quadrant C Data is divided into 100 sec bins |
 |
 |
| Module-wise count rates for Quadrant D Data is divided into 100 sec bins |
 |
 |
| Parameter | Plot |
|---|---|
| CZT HV Monitor |  |
| D_VDD |  |
| Temperature 1 |  |
| Veto HV Monitor |  |
| Veto LLD |  |
| Alpha Counter |  |
| _CPM_Rate |  |
| CZT Counter | 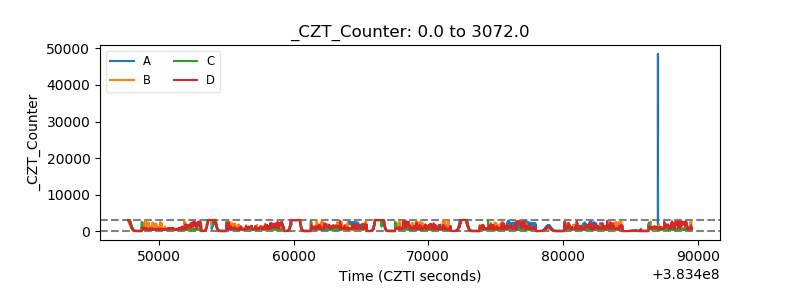 |
| +2.5 Volts monitor |  |
| +5 Volts monitor |  |
| _ROLL_ROT |  |
| _Roll_DEC |  |
| _Roll_RA |  |
| Veto Counter |  |