| Param | Original file | Final file |
|---|---|---|
| Filename | modeM0/AS1A11_065T06_9000004958_34672cztM0_level2.evt | modeM0/AS1A11_065T06_9000004958_34672cztM0_level2_quad_clean.evt |
| Size (bytes) | 335,139,840 | 59,342,400 |
| Size | 319.6 MB | 56.6 MB |
| Events in quadrant A | 2,010,032 | 403,832 |
| Events in quadrant B | 1,910,891 | 412,941 |
| Events in quadrant C | 1,749,896 | 400,649 |
| Events in quadrant D | 4,260,328 | 351,067 |
| Mode M0 | |||
|---|---|---|---|
| Quadrant | BADHDUFLAG | Total packets | Discarded packets |
| A | 0 | 8129 | 1 |
| B | 0 | 7762 | 1 |
| C | 0 | 7064 | 1 |
| D | 0 | 14940 | 1 |
| Mode SS | |||
|---|---|---|---|
| Quadrant | BADHDUFLAG | Total packets | Discarded packets |
| A | 0 | 64 | 0 |
| B | 0 | 64 | 0 |
| C | 0 | 64 | 0 |
| D | 0 | 64 | 0 |
| Quadrant | Total seconds | Saturated seconds | Saturation percentage |
|---|---|---|---|
| A | 3212 | 17 | 0.529265% |
| B | 3212 | 54 | 1.681196% |
| C | 3212 | 51 | 1.587796% |
| D | 3212 | 570 | 17.745953% |
Noise dominated data is calculated using 1-second bins in cleaned event files. If a bin has >2000 counts, and if more than 50% of those come from <1% of pixels, then it is considered to be noise-dominated and hence unusable.
| Quadrant | # 1 sec bins | Bins with >0 counts | Bins with >2000 counts | High rate bins dominated by noise | Noise dominated (total time) | Noise dominated (detector-on time) | Marked lightcurve |
|---|---|---|---|---|---|---|---|
| A | 3212 | 3212 | 4 | 4 | 0.12% | 0.12% |  |
| B | 3212 | 3212 | 30 | 30 | 0.93% | 0.93% |  |
| C | 3212 | 3212 | 35 | 35 | 1.09% | 1.09% |  |
| D | 3212 | 3212 | 650 | 650 | 20.24% | 20.24% |  |
Top three noisy pixels from each quadrant. If the there are fewer than three noisy pixels in the level2.evt file, extra rows are filled as -1
| Pixel properties | Quadrant properties | ||||||
|---|---|---|---|---|---|---|---|
| Quadrant | DetID | PixID | Counts | Sigma | Mean | Median | Sigma |
| A | 15 | 169 | 539541 | 7109.37 | 368 | 360 | 75.8 |
| A | 10 | 83 | 21594 | 279.98 | 368 | 360 | 75.8 |
| A | 7 | 48 | 12711 | 162.85 | 368 | 360 | 75.8 |
| B | 5 | 255 | 172178 | 2429.37 | 363 | 354 | 70.7 |
| B | 5 | 172 | 94409 | 1329.82 | 363 | 354 | 70.7 |
| B | 0 | 190 | 92126 | 1297.54 | 363 | 354 | 70.7 |
| C | 0 | 10 | 156241 | 1880.84 | 354 | 356 | 82.9 |
| C | 15 | 214 | 138216 | 1663.36 | 354 | 356 | 82.9 |
| C | 14 | 67 | 54930 | 658.46 | 354 | 356 | 82.9 |
| D | 8 | 195 | 1563525 | 17430.33 | 339 | 331 | 89.7 |
| D | 7 | 38 | 830755 | 9259.61 | 339 | 331 | 89.7 |
| D | 13 | 249 | 173849 | 1934.81 | 339 | 331 | 89.7 |
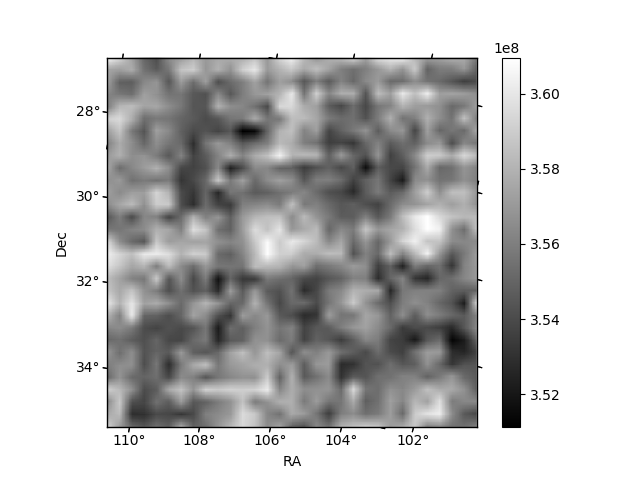
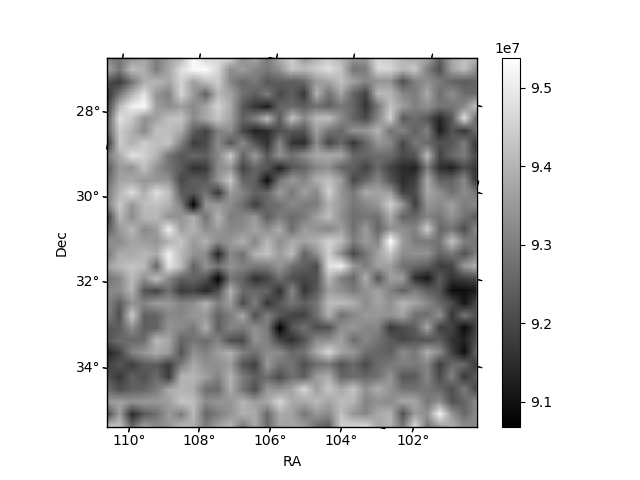
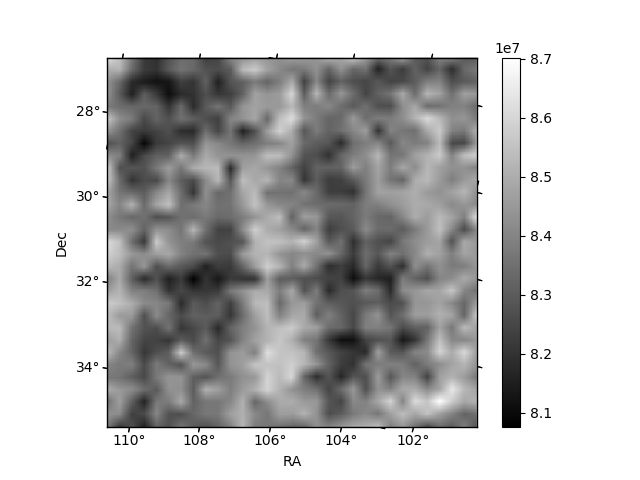
Histogram calculated using DETX and DETY for each event in the final _common_clean file
| Quadrant A | 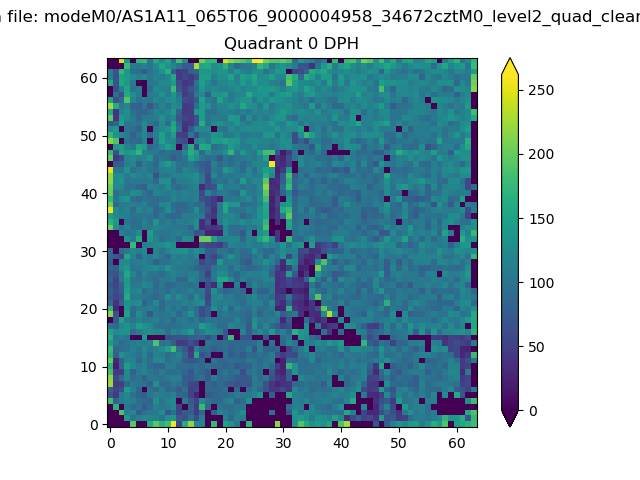 |
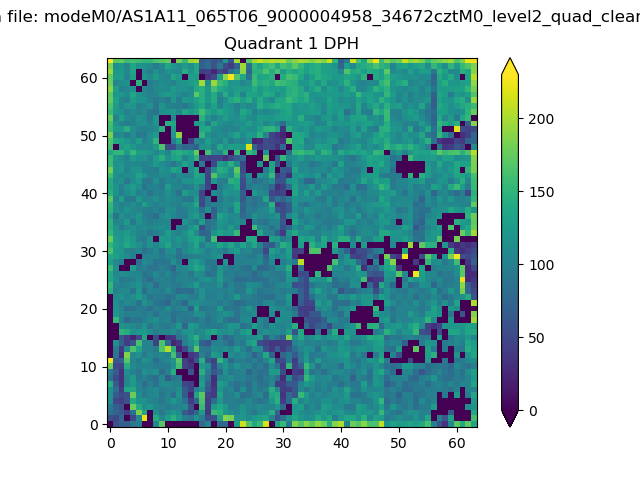 |
Quadrant B |
|---|---|---|---|
| Quadrant D | 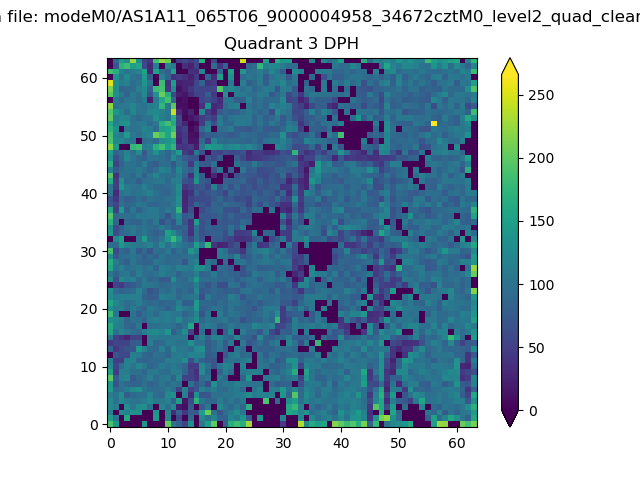 |
 |
Quadrant C |
| Plot type | Count rate plots | Images |
|---|---|---|
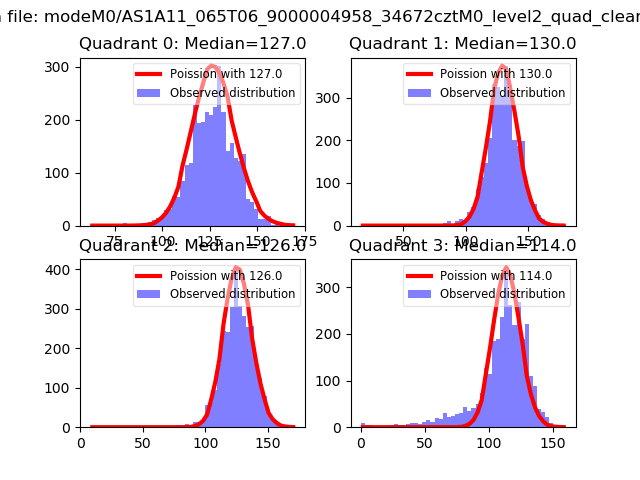
| Comparison with Poisson distribution Blue bars denote a histogram of data divided into 1 sec bins. Red curve is a Poisson curve with rate = median count rate of data. |
 |
 |
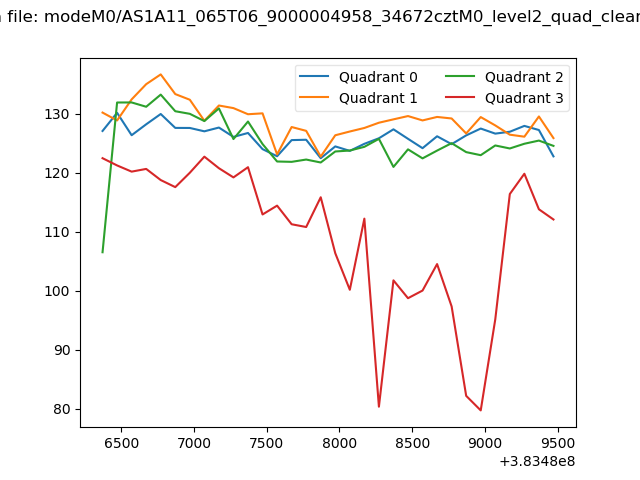
| Quadrant-wise count rates Data is divided into 100 sec bins |
 |
|
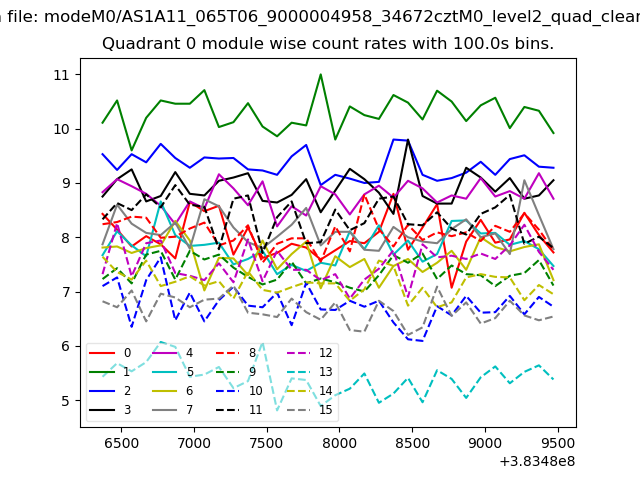
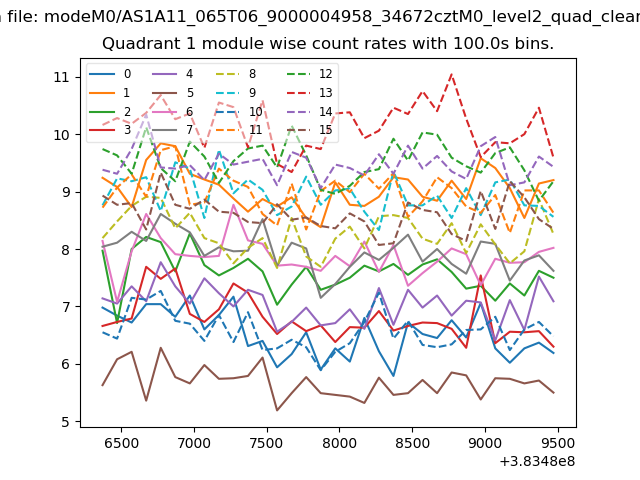
| Module-wise count rates for Quadrant A Data is divided into 100 sec bins |
 |
 |
| Module-wise count rates for Quadrant B Data is divided into 100 sec bins |
 |
 |
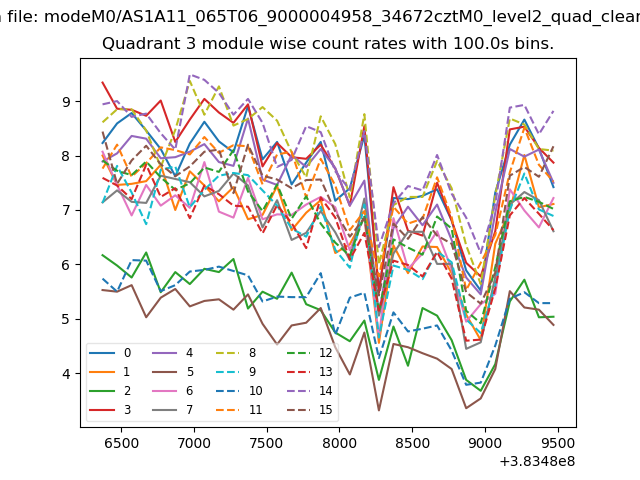
| Module-wise count rates for Quadrant C Data is divided into 100 sec bins |
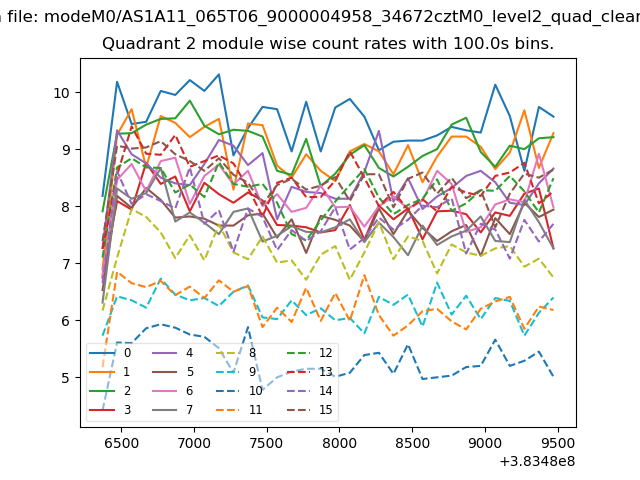 |
 |
| Module-wise count rates for Quadrant D Data is divided into 100 sec bins |
 |
 |
| Parameter | Plot |
|---|---|
| CZT HV Monitor | 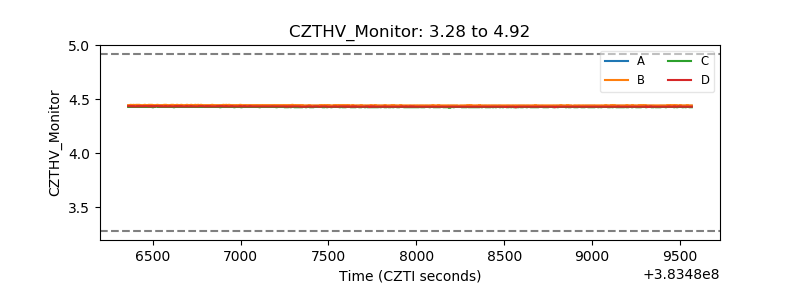 |
| D_VDD | 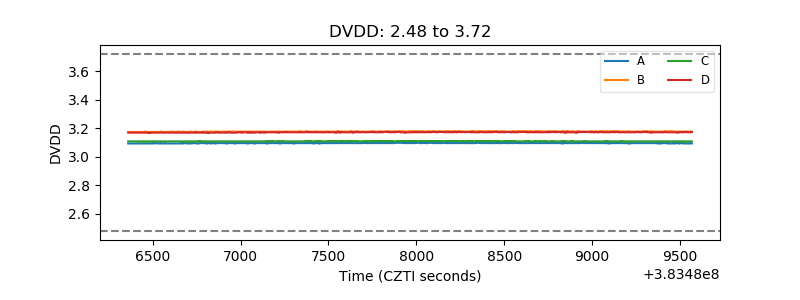 |
| Temperature 1 | 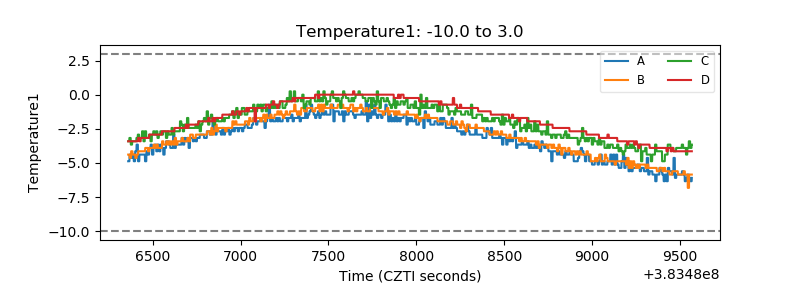 |
| Veto HV Monitor | 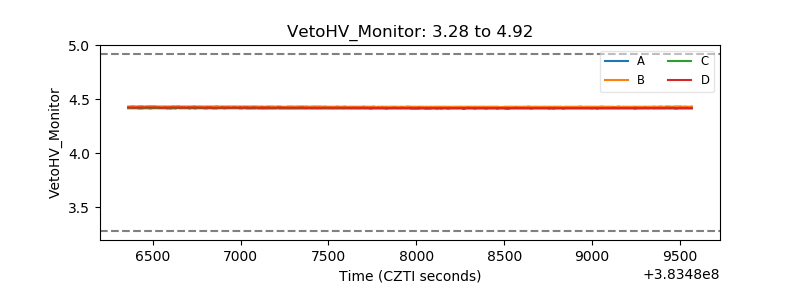 |
| Veto LLD | 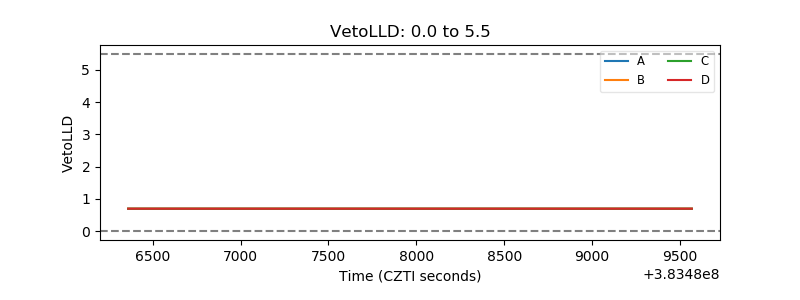 |
| Alpha Counter | 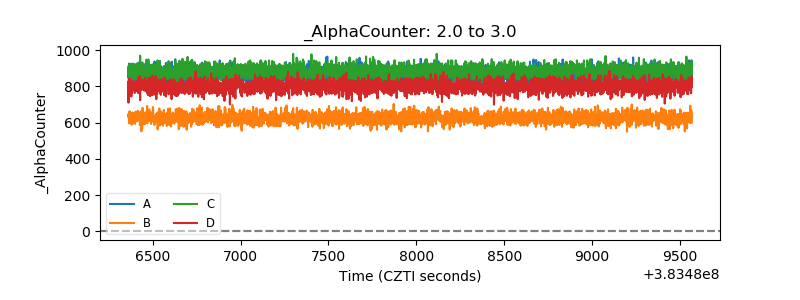 |
| _CPM_Rate | 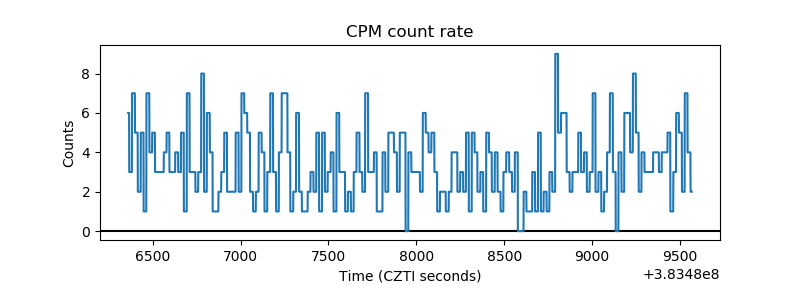 |
| CZT Counter | 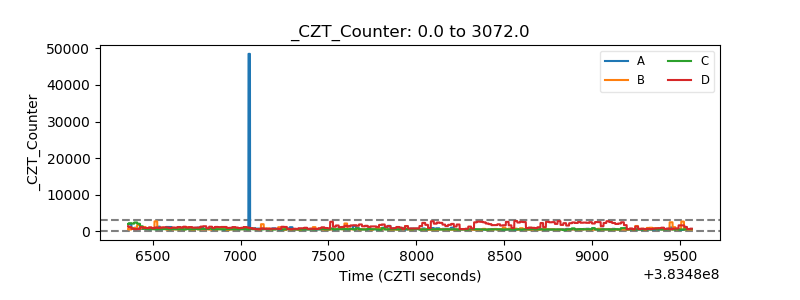 |
| +2.5 Volts monitor |  |
| +5 Volts monitor |  |
| _ROLL_ROT |  |
| _Roll_DEC | 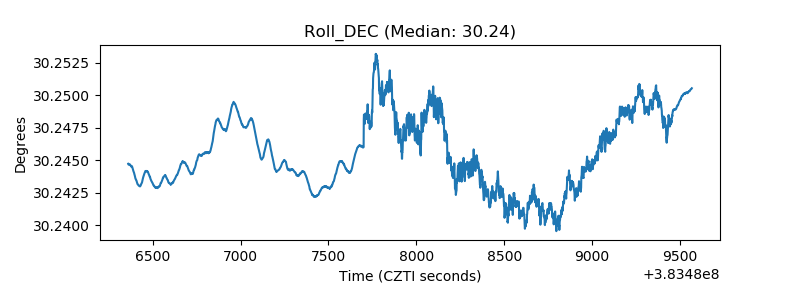 |
| _Roll_RA | 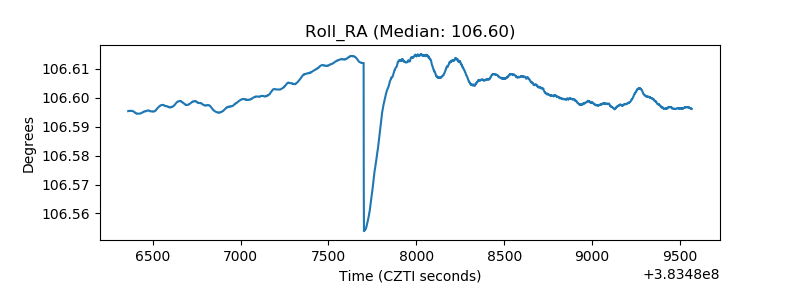 |
| Veto Counter |  |