| Param | Original file | Final file |
|---|---|---|
| Filename | modeM0/AS1A11_065T13_9000004960cztM0_level2.fits | modeM0/AS1A11_065T13_9000004960cztM0_level2_quad_clean.evt |
| Size (bytes) | 151,781,760 | 153,455,040 |
| Size | 144.8 MB | 146.3 MB |
| Events in quadrant A | 932,622 | 965,843 |
| Events in quadrant B | 871,746 | 941,203 |
| Events in quadrant C | 903,408 | 901,808 |
| Events in quadrant D | 730,670 | 680,814 |
| Mode M9 | |||
|---|---|---|---|
| Quadrant | BADHDUFLAG | Total packets | Discarded packets |
| A | 0 | 55 | 0 |
| B | 0 | 55 | 0 |
| C | 0 | 55 | 0 |
| D | 0 | 55 | 0 |
| Mode M0 | |||
|---|---|---|---|
| Quadrant | BADHDUFLAG | Total packets | Discarded packets |
| A | 0 | 37531 | 0 |
| B | 0 | 45736 | 0 |
| C | 0 | 35864 | 0 |
| D | 0 | 67530 | 0 |
| Mode SS | |||
|---|---|---|---|
| Quadrant | BADHDUFLAG | Total packets | Discarded packets |
| A | 0 | 346 | 0 |
| B | 0 | 346 | 0 |
| C | 0 | 346 | 0 |
| D | 0 | 346 | 0 |
| Quadrant | Total seconds | Saturated seconds | Saturation percentage |
|---|---|---|---|
| A | 16770 | 245 | 1.460942% |
| B | 16770 | 1031 | 6.147883% |
| C | 16770 | 122 | 0.727490% |
| D | 16770 | 2121 | 12.647585% |
Noise dominated data is calculated using 1-second bins in cleaned event files. If a bin has >2000 counts, and if more than 50% of those come from <1% of pixels, then it is considered to be noise-dominated and hence unusable.
| Quadrant | # 1 sec bins | Bins with >0 counts | Bins with >2000 counts | High rate bins dominated by noise | Noise dominated (total time) | Noise dominated (detector-on time) | Marked lightcurve |
|---|---|---|---|---|---|---|---|
| A | 22351 | 16770 | 0 | 0 | 0.00% | 0.00% | 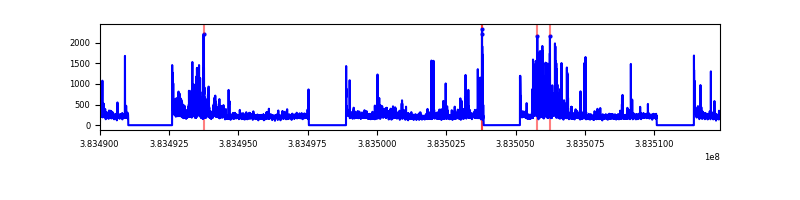 |
| B | 22351 | 16769 | 0 | 0 | 0.00% | 0.00% |  |
| C | 22351 | 16766 | 0 | 0 | 0.00% | 0.00% |  |
| D | 22351 | 16747 | 0 | 0 | 0.00% | 0.00% |  |
Top three noisy pixels from each quadrant. If the there are fewer than three noisy pixels in the level2.evt file, extra rows are filled as -1
| Pixel properties | Quadrant properties | ||||||
|---|---|---|---|---|---|---|---|
| Quadrant | DetID | PixID | Counts | Sigma | Mean | Median | Sigma |
| A | 7 | 110 | 774 | 8.78 | 243 | 229 | 62.1 |
| A | 0 | 29 | 767 | 8.66 | 243 | 229 | 62.1 |
| A | 9 | 19 | 725 | 7.99 | 243 | 229 | 62.1 |
| B | 2 | 9 | 772 | 11.42 | 231 | 221 | 48.2 |
| B | 2 | 8 | 625 | 8.38 | 231 | 221 | 48.2 |
| B | 3 | 80 | 625 | 8.38 | 231 | 221 | 48.2 |
| C | 3 | 203 | 719 | 8.08 | 239 | 225 | 61.2 |
| C | 3 | 202 | 716 | 8.03 | 239 | 225 | 61.2 |
| C | 3 | 187 | 671 | 7.29 | 239 | 225 | 61.2 |
| D | 4 | 160 | 548 | 6.21 | 209 | 190 | 57.7 |
| D | 10 | 113 | 543 | 6.12 | 209 | 190 | 57.7 |
| D | 7 | 3 | 536 | 6.0 | 209 | 190 | 57.7 |
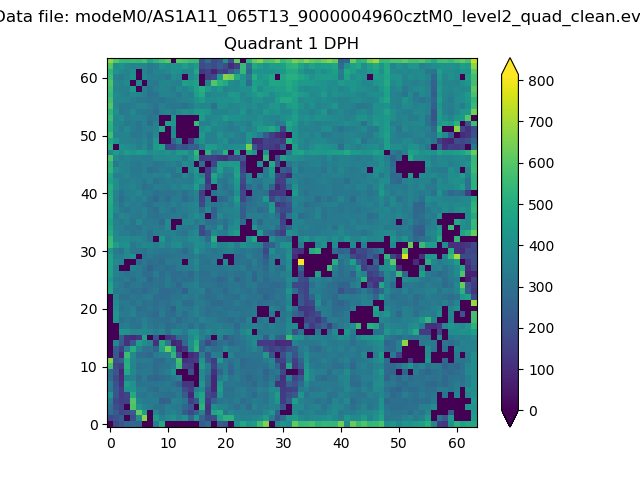
Histogram calculated using DETX and DETY for each event in the final _common_clean file
| Quadrant A |  |
 |
Quadrant B |
|---|---|---|---|
| Quadrant D | 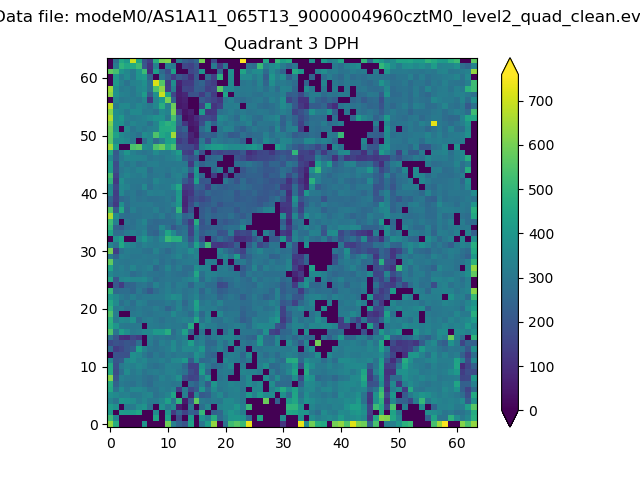 |
 |
Quadrant C |
| Plot type | Count rate plots | Images |
|---|---|---|
| Comparison with Poisson distribution Blue bars denote a histogram of data divided into 1 sec bins. Red curve is a Poisson curve with rate = median count rate of data. |
 |
 |
| Quadrant-wise count rates Data is divided into 100 sec bins |
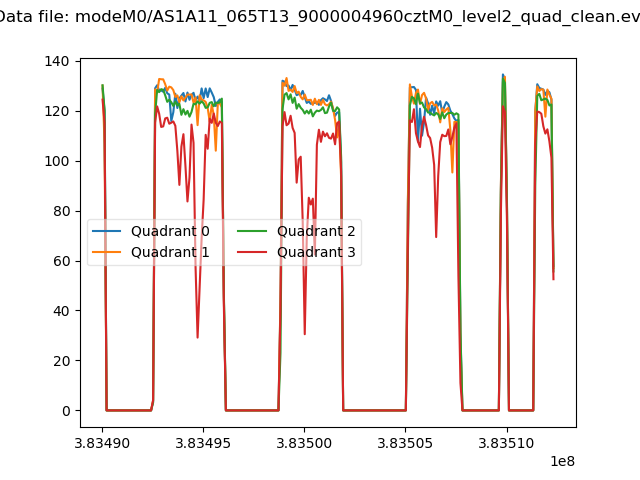 |
|
| Module-wise count rates for Quadrant A Data is divided into 100 sec bins |
 |
 |
| Module-wise count rates for Quadrant B Data is divided into 100 sec bins |
 |
 |
| Module-wise count rates for Quadrant C Data is divided into 100 sec bins |
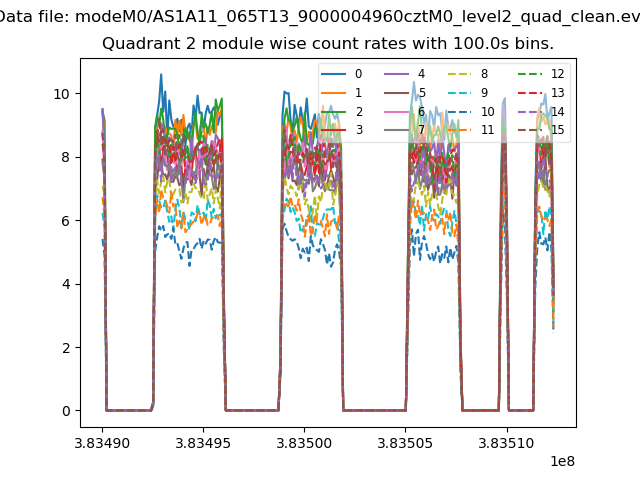 |
 |
| Module-wise count rates for Quadrant D Data is divided into 100 sec bins |
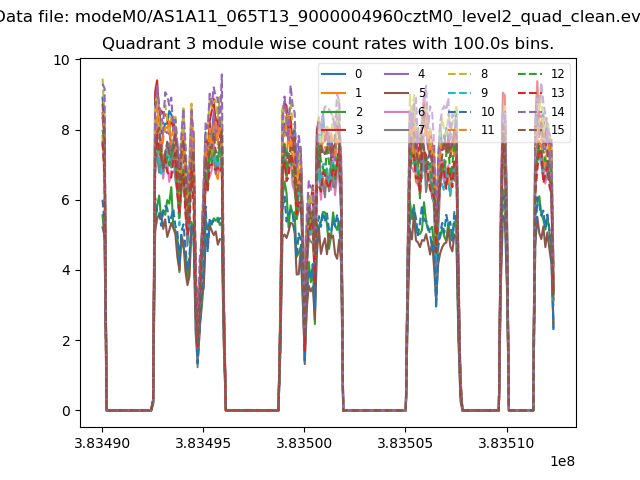 |
 |
| Parameter | Plot |
|---|---|
| CZT HV Monitor |  |
| D_VDD |  |
| Temperature 1 |  |
| Veto HV Monitor | 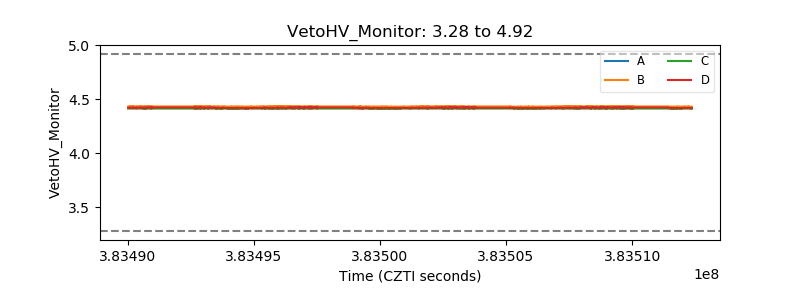 |
| Veto LLD | 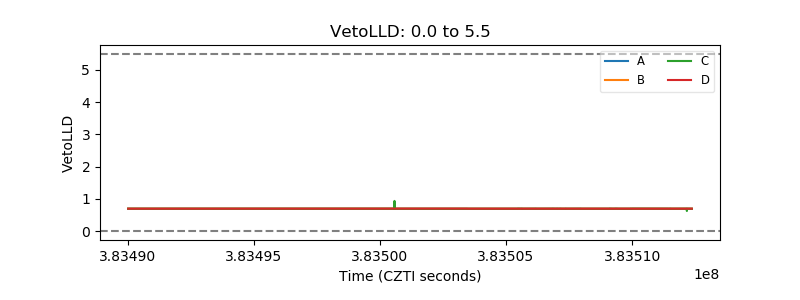 |
| Alpha Counter |  |
| _CPM_Rate |  |
| CZT Counter | 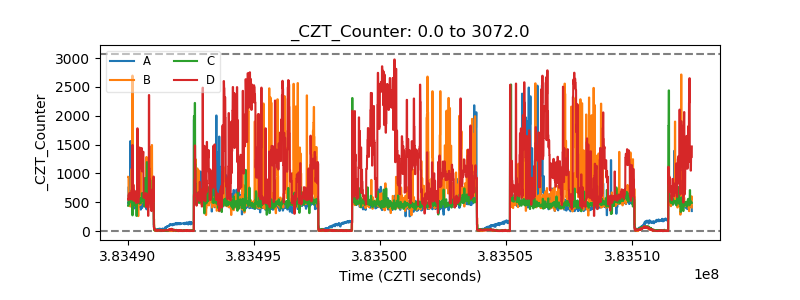 |
| +2.5 Volts monitor |  |
| +5 Volts monitor |  |
| _ROLL_ROT |  |
| _Roll_DEC | 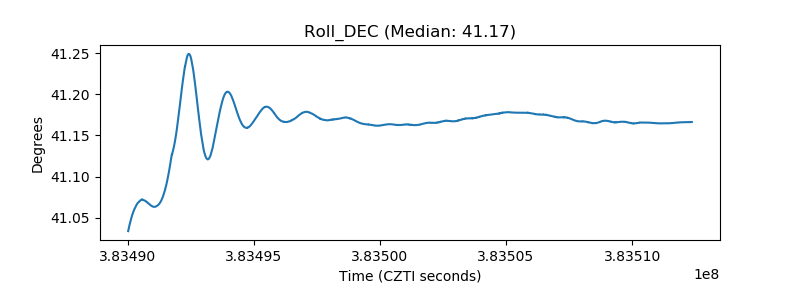 |
| _Roll_RA |  |
| Veto Counter |  |