| Param | Original file | Final file |
|---|---|---|
| Filename | modeM0/AS1T04_078T01_9000004962cztM0_level2.fits | modeM0/AS1T04_078T01_9000004962cztM0_level2_quad_clean.evt |
| Size (bytes) | 395,775,360 | 259,444,800 |
| Size | 377.4 MB | 247.4 MB |
| Events in quadrant A | 2,494,804 | 1,341,022 |
| Events in quadrant B | 2,290,706 | 1,279,666 |
| Events in quadrant C | 2,404,112 | 1,304,206 |
| Events in quadrant D | 2,023,140 | 1,157,905 |
| Mode M0 | |||
|---|---|---|---|
| Quadrant | BADHDUFLAG | Total packets | Discarded packets |
| A | 0 | 91335 | 0 |
| B | 0 | 113401 | 0 |
| C | 0 | 89816 | 0 |
| D | 0 | 150786 | 0 |
| Mode M9 | |||
|---|---|---|---|
| Quadrant | BADHDUFLAG | Total packets | Discarded packets |
| A | 0 | 168 | 0 |
| B | 0 | 168 | 0 |
| C | 0 | 168 | 0 |
| D | 0 | 168 | 0 |
| Mode SS | |||
|---|---|---|---|
| Quadrant | BADHDUFLAG | Total packets | Discarded packets |
| A | 0 | 826 | 0 |
| B | 0 | 826 | 0 |
| C | 0 | 826 | 0 |
| D | 0 | 826 | 0 |
| Quadrant | Total seconds | Saturated seconds | Saturation percentage |
|---|---|---|---|
| A | 40367 | 422 | 1.045408% |
| B | 40367 | 2921 | 7.236109% |
| C | 40367 | 237 | 0.587113% |
| D | 40367 | 2235 | 5.536701% |
Noise dominated data is calculated using 1-second bins in cleaned event files. If a bin has >2000 counts, and if more than 50% of those come from <1% of pixels, then it is considered to be noise-dominated and hence unusable.
| Quadrant | # 1 sec bins | Bins with >0 counts | Bins with >2000 counts | High rate bins dominated by noise | Noise dominated (total time) | Noise dominated (detector-on time) | Marked lightcurve |
|---|---|---|---|---|---|---|---|
| A | 57165 | 40357 | 0 | 0 | 0.00% | 0.00% |  |
| B | 57165 | 40352 | 0 | 0 | 0.00% | 0.00% |  |
| C | 57165 | 40365 | 0 | 0 | 0.00% | 0.00% |  |
| D | 57165 | 40363 | 0 | 0 | 0.00% | 0.00% | 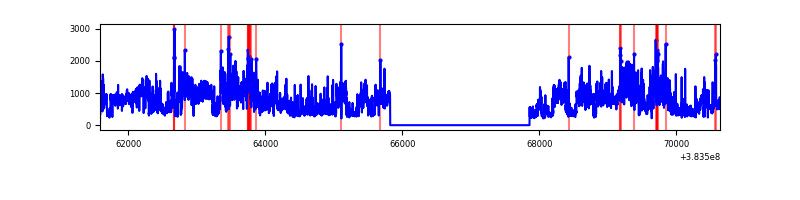 |
Top three noisy pixels from each quadrant. If the there are fewer than three noisy pixels in the level2.evt file, extra rows are filled as -1
| Pixel properties | Quadrant properties | ||||||
|---|---|---|---|---|---|---|---|
| Quadrant | DetID | PixID | Counts | Sigma | Mean | Median | Sigma |
| A | 7 | 110 | 2069 | 9.24 | 652 | 615 | 157.4 |
| A | 0 | 29 | 1972 | 8.62 | 652 | 615 | 157.4 |
| A | 9 | 19 | 1956 | 8.52 | 652 | 615 | 157.4 |
| B | 2 | 9 | 2088 | 12.28 | 609 | 582 | 122.6 |
| B | 3 | 80 | 1837 | 10.23 | 609 | 582 | 122.6 |
| B | 2 | 8 | 1612 | 8.4 | 609 | 582 | 122.6 |
| C | 1 | 81 | 1969 | 8.43 | 636 | 600 | 162.4 |
| C | 1 | 80 | 1939 | 8.24 | 636 | 600 | 162.4 |
| C | 3 | 202 | 1911 | 8.07 | 636 | 600 | 162.4 |
| D | 7 | 3 | 1483 | 6.27 | 579 | 531 | 151.8 |
| D | 6 | 231 | 1460 | 6.12 | 579 | 531 | 151.8 |
| D | 6 | 67 | 1449 | 6.05 | 579 | 531 | 151.8 |
Histogram calculated using DETX and DETY for each event in the final _common_clean file
| Quadrant A | 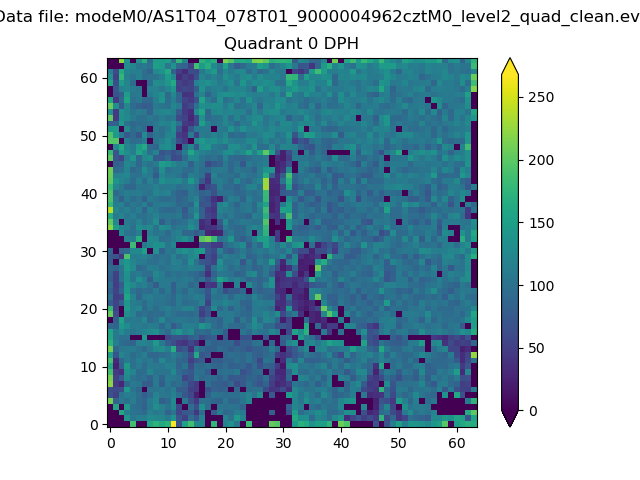 |
 |
Quadrant B |
|---|---|---|---|
| Quadrant D | 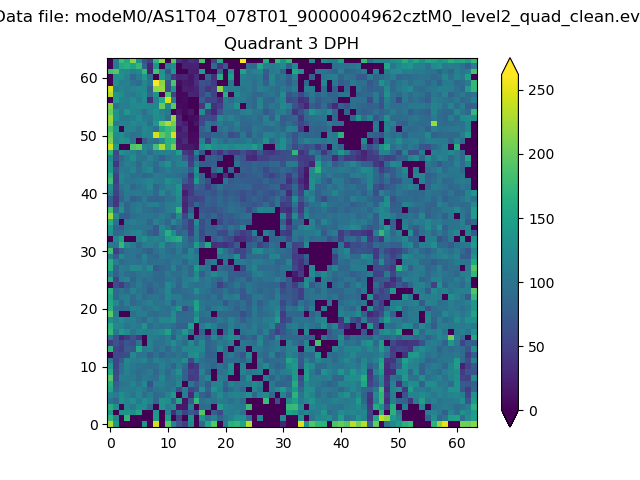 |
 |
Quadrant C |
| Plot type | Count rate plots | Images |
|---|---|---|
| Comparison with Poisson distribution Blue bars denote a histogram of data divided into 1 sec bins. Red curve is a Poisson curve with rate = median count rate of data. |
 |
 |
| Quadrant-wise count rates Data is divided into 100 sec bins |
 |
|
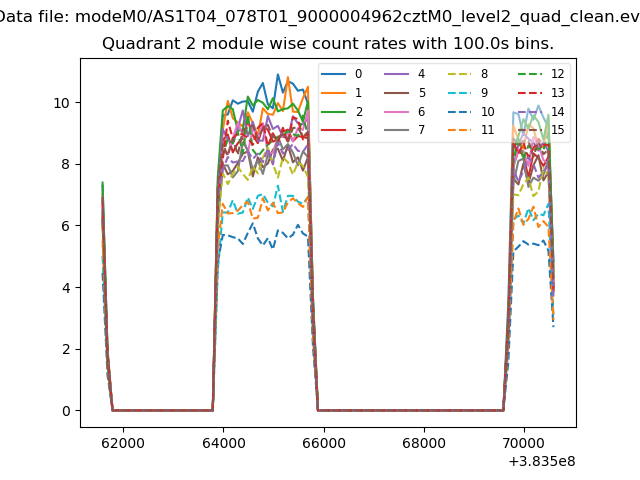
| Module-wise count rates for Quadrant A Data is divided into 100 sec bins |
 |
 |
| Module-wise count rates for Quadrant B Data is divided into 100 sec bins |
 |
 |
| Module-wise count rates for Quadrant C Data is divided into 100 sec bins |
 |
 |
| Module-wise count rates for Quadrant D Data is divided into 100 sec bins |
 |
 |
| Parameter | Plot |
|---|---|
| CZT HV Monitor |  |
| D_VDD | 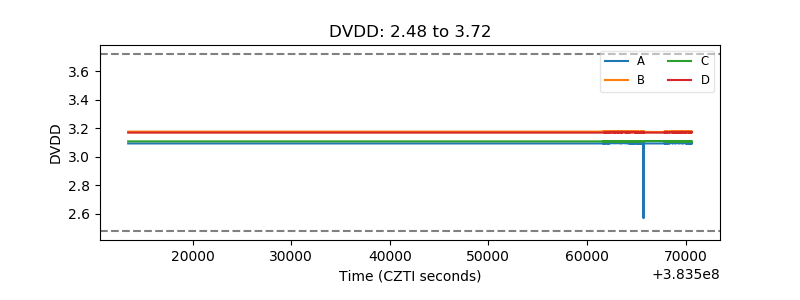 |
| Temperature 1 | 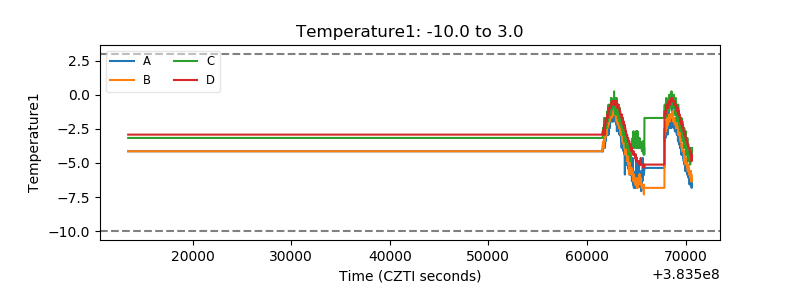 |
| Veto HV Monitor |  |
| Veto LLD |  |
| Alpha Counter |  |
| _CPM_Rate |  |
| CZT Counter |  |
| +2.5 Volts monitor |  |
| +5 Volts monitor |  |
| _ROLL_ROT |  |
| _Roll_DEC | 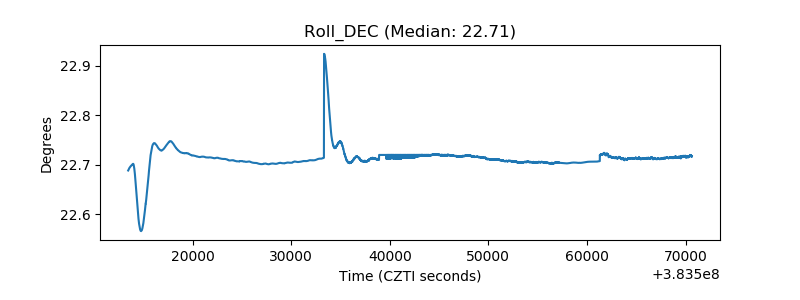 |
| _Roll_RA |  |
| Veto Counter | 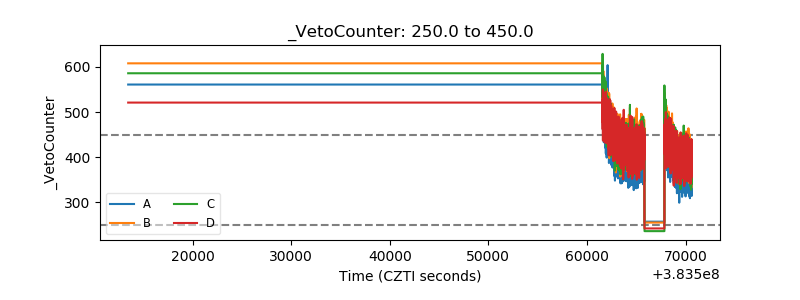 |