| Param | Original file | Final file |
|---|---|---|
| Filename | modeM0/AS1T04_078T01_9000004962_34677cztM0_level2.evt | modeM0/AS1T04_078T01_9000004962_34677cztM0_level2_quad_clean.evt |
| Size (bytes) | 565,280,640 | 77,500,800 |
| Size | 539.1 MB | 73.9 MB |
| Events in quadrant A | 3,665,427 | 484,616 |
| Events in quadrant B | 4,569,760 | 486,201 |
| Events in quadrant C | 2,925,628 | 504,103 |
| Events in quadrant D | 5,571,820 | 471,572 |
| Mode M0 | |||
|---|---|---|---|
| Quadrant | BADHDUFLAG | Total packets | Discarded packets |
| A | 0 | 14752 | 3 |
| B | 0 | 17456 | 2 |
| C | 0 | 12248 | 2 |
| D | 0 | 20582 | 2 |
| Mode M9 | |||
|---|---|---|---|
| Quadrant | BADHDUFLAG | Total packets | Discarded packets |
| A | 0 | 24 | 0 |
| B | 0 | 24 | 0 |
| C | 0 | 24 | 0 |
| D | 0 | 25 | 0 |
| Mode SS | |||
|---|---|---|---|
| Quadrant | BADHDUFLAG | Total packets | Discarded packets |
| A | 0 | 116 | 0 |
| B | 0 | 116 | 0 |
| C | 0 | 116 | 0 |
| D | 0 | 116 | 0 |
| Quadrant | Total seconds | Saturated seconds | Saturation percentage |
|---|---|---|---|
| A | 5723 | 240 | 4.193605% |
| B | 5723 | 540 | 9.435611% |
| C | 5723 | 32 | 0.559147% |
| D | 5723 | 188 | 3.284990% |
Noise dominated data is calculated using 1-second bins in cleaned event files. If a bin has >2000 counts, and if more than 50% of those come from <1% of pixels, then it is considered to be noise-dominated and hence unusable.
| Quadrant | # 1 sec bins | Bins with >0 counts | Bins with >2000 counts | High rate bins dominated by noise | Noise dominated (total time) | Noise dominated (detector-on time) | Marked lightcurve |
|---|---|---|---|---|---|---|---|
| A | 7276 | 5724 | 178 | 178 | 2.45% | 3.11% | 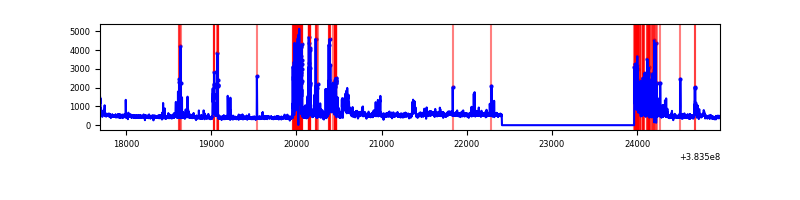 |
| B | 7276 | 5724 | 353 | 353 | 4.85% | 6.17% | 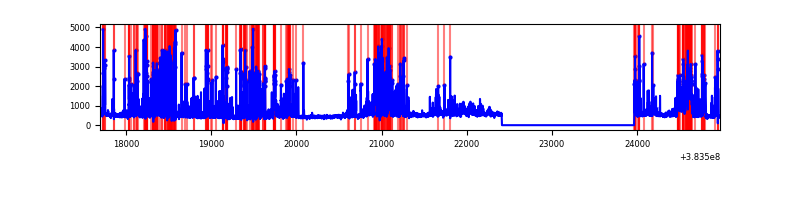 |
| C | 7276 | 5724 | 25 | 25 | 0.34% | 0.44% | 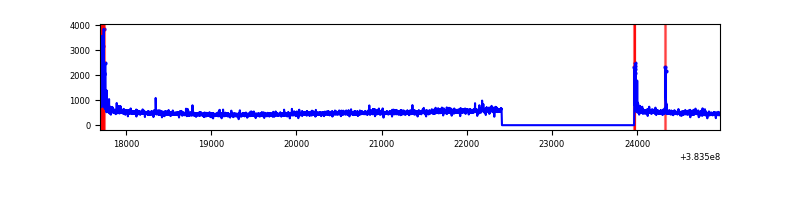 |
| D | 7276 | 5724 | 125 | 125 | 1.72% | 2.18% | 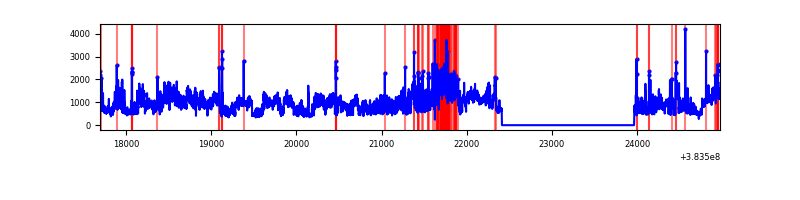 |
Top three noisy pixels from each quadrant. If the there are fewer than three noisy pixels in the level2.evt file, extra rows are filled as -1
| Pixel properties | Quadrant properties | ||||||
|---|---|---|---|---|---|---|---|
| Quadrant | DetID | PixID | Counts | Sigma | Mean | Median | Sigma |
| A | 15 | 169 | 1064435 | 8232.32 | 643 | 631 | 129.2 |
| A | 10 | 83 | 45769 | 349.3 | 643 | 631 | 129.2 |
| A | 9 | 143 | 16267 | 121.0 | 643 | 631 | 129.2 |
| B | 5 | 172 | 1546852 | 12644.04 | 633 | 617 | 122.3 |
| B | 5 | 255 | 230378 | 1878.83 | 633 | 617 | 122.3 |
| B | 0 | 190 | 182325 | 1485.88 | 633 | 617 | 122.3 |
| C | 15 | 214 | 244164 | 1605.4 | 639 | 642 | 151.7 |
| C | 0 | 10 | 103914 | 680.81 | 639 | 642 | 151.7 |
| C | 14 | 67 | 64497 | 420.96 | 639 | 642 | 151.7 |
| D | 8 | 195 | 1805359 | 11530.12 | 631 | 612 | 156.5 |
| D | 7 | 223 | 836699 | 5341.57 | 631 | 612 | 156.5 |
| D | 2 | 249 | 136711 | 869.51 | 631 | 612 | 156.5 |
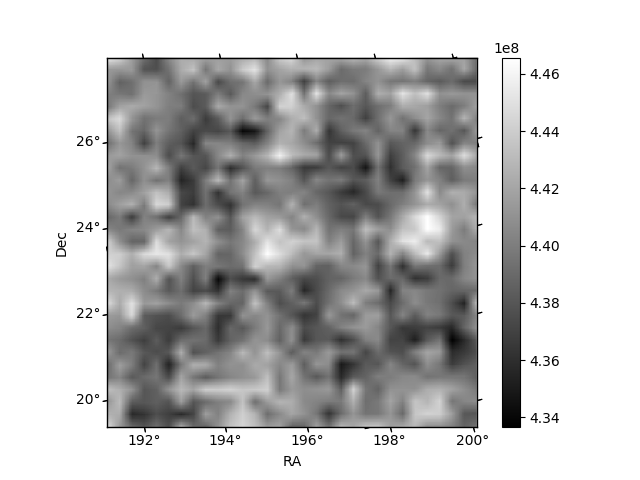
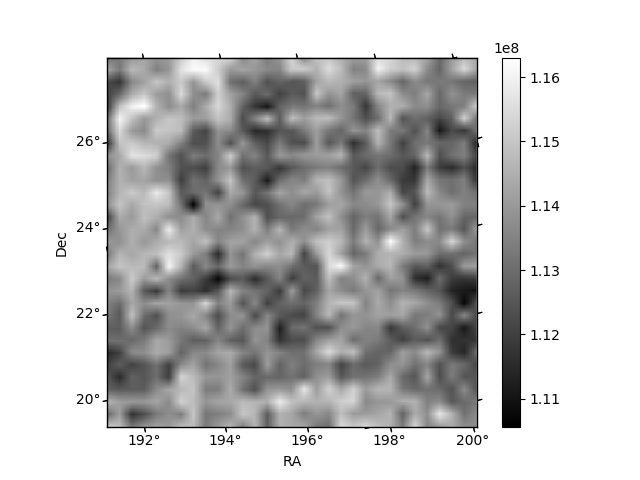
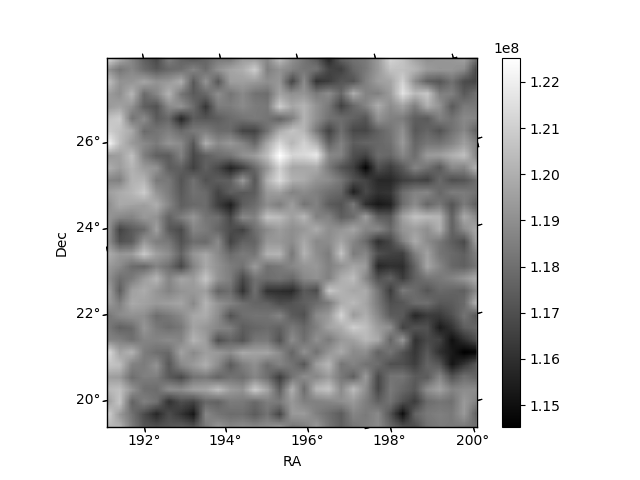
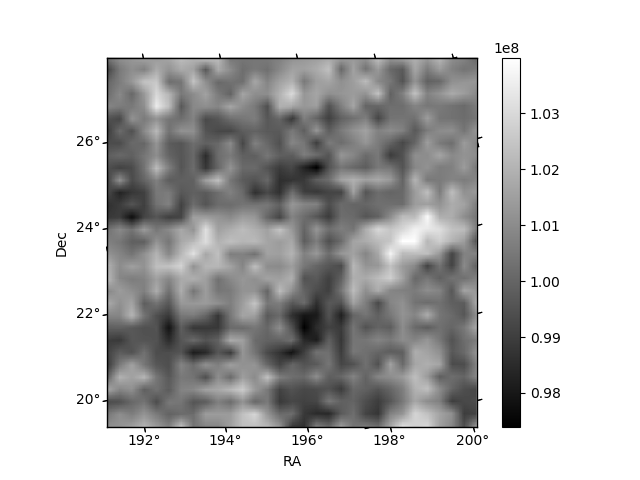
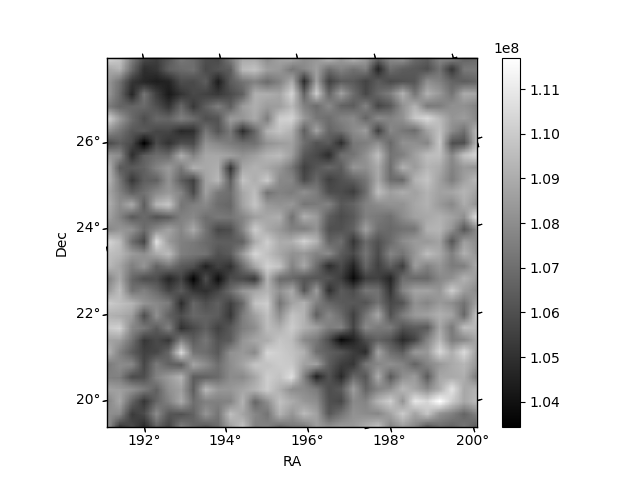
Histogram calculated using DETX and DETY for each event in the final _common_clean file
| Quadrant A | 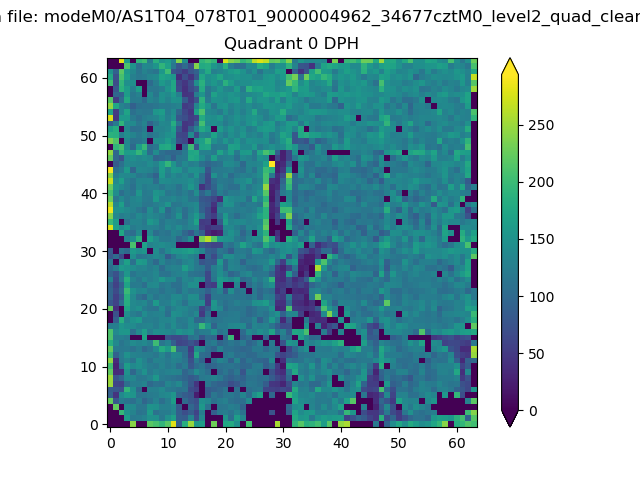 |
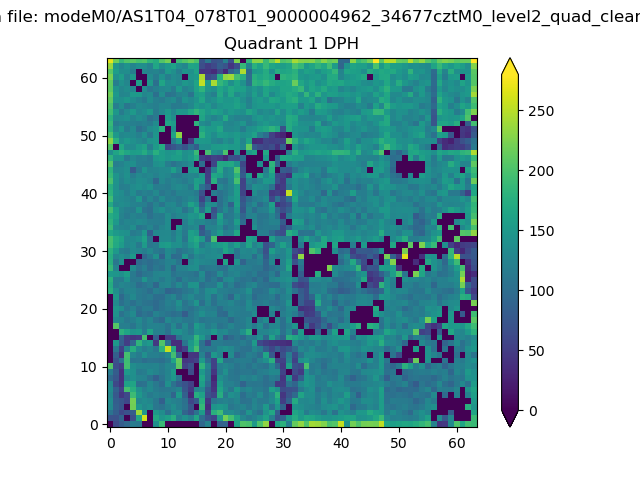 |
Quadrant B |
|---|---|---|---|
| Quadrant D | 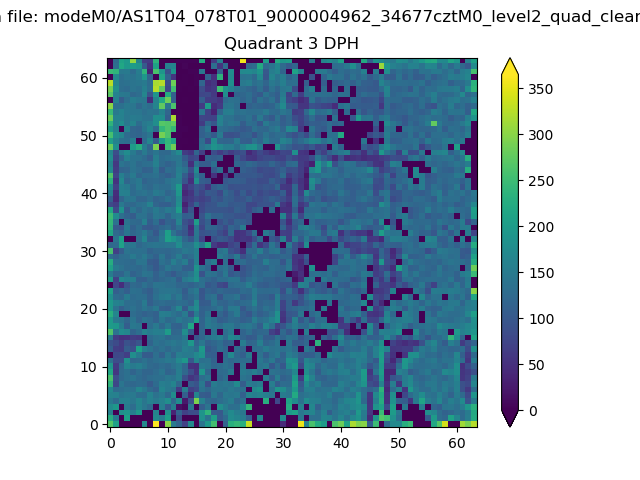 |
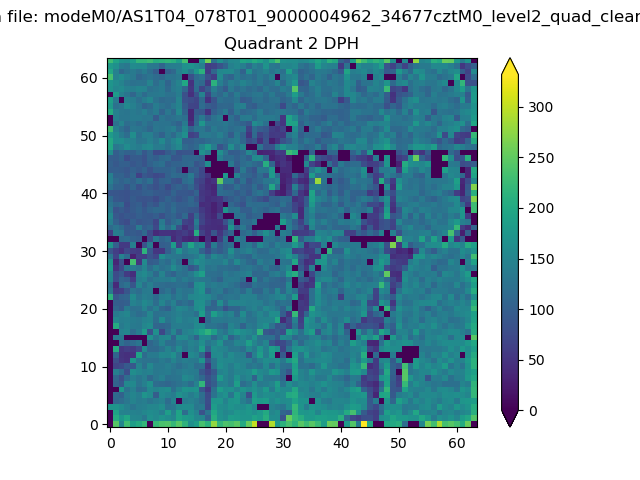 |
Quadrant C |
| Plot type | Count rate plots | Images |
|---|---|---|
| Comparison with Poisson distribution Blue bars denote a histogram of data divided into 1 sec bins. Red curve is a Poisson curve with rate = median count rate of data. |
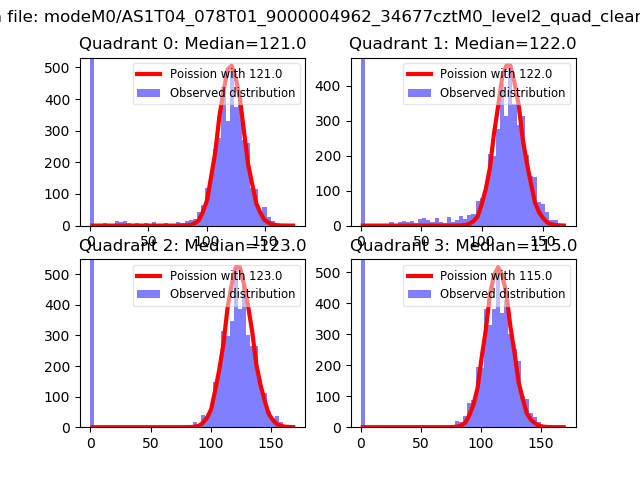 |
 |
| Quadrant-wise count rates Data is divided into 100 sec bins |
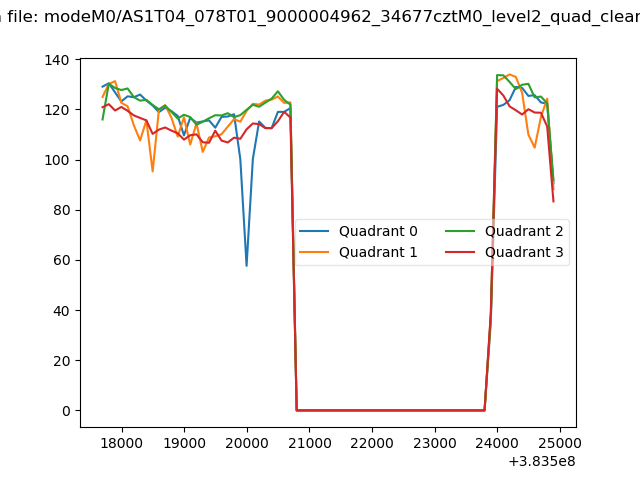 |
|
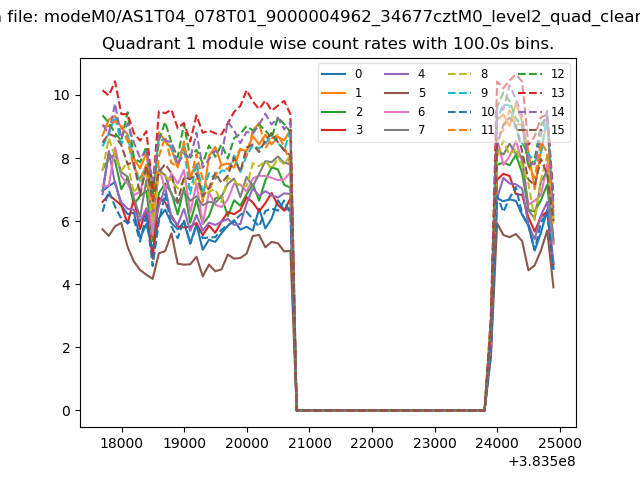
| Module-wise count rates for Quadrant A Data is divided into 100 sec bins |
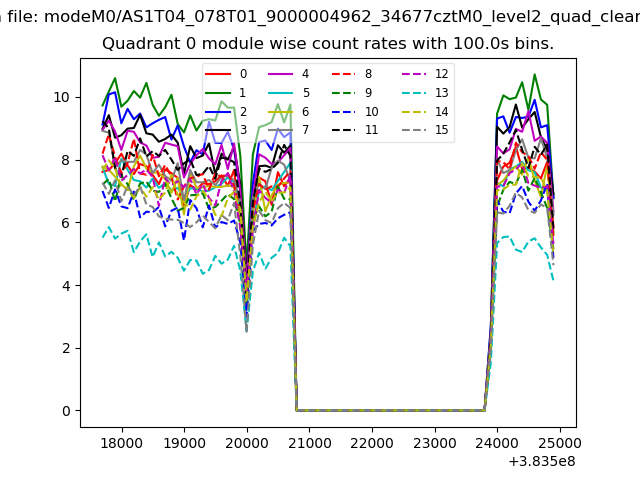 |
 |
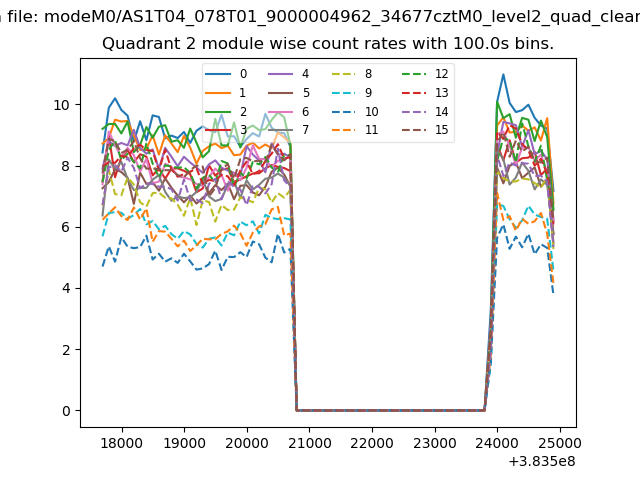
| Module-wise count rates for Quadrant B Data is divided into 100 sec bins |
 |
 |
| Module-wise count rates for Quadrant C Data is divided into 100 sec bins |
 |
 |
| Module-wise count rates for Quadrant D Data is divided into 100 sec bins |
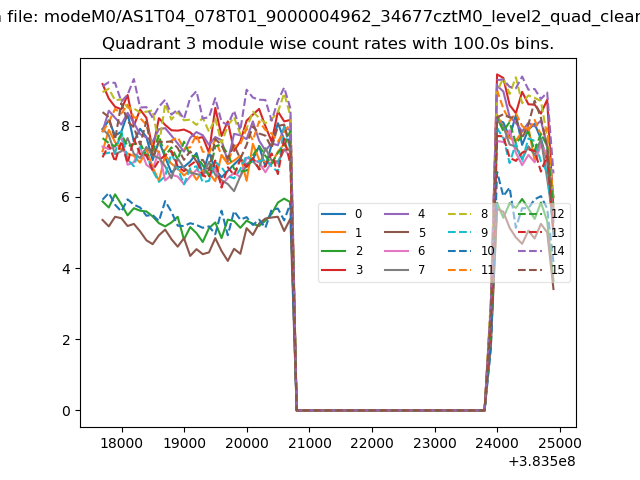 |
 |
| Parameter | Plot |
|---|---|
| CZT HV Monitor | 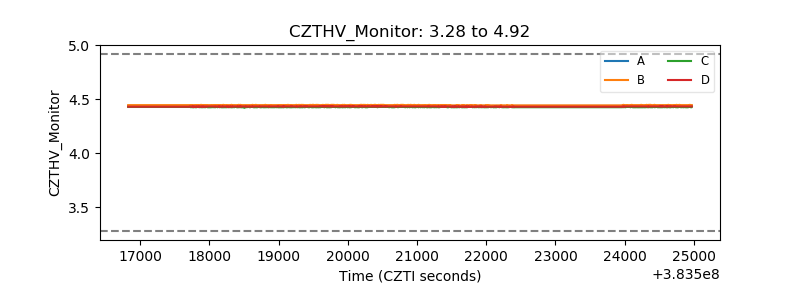 |
| D_VDD | 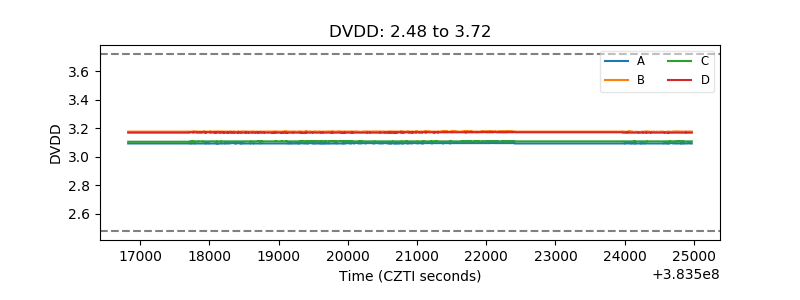 |
| Temperature 1 | 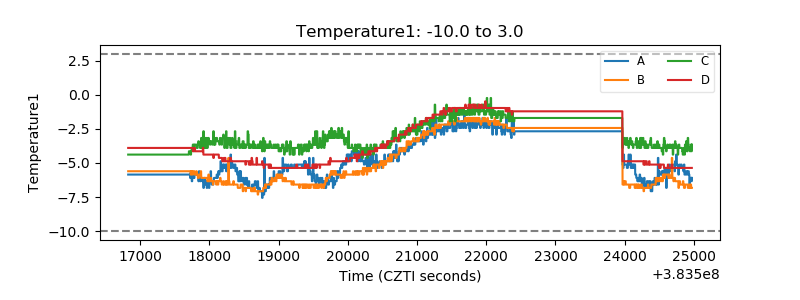 |
| Veto HV Monitor | 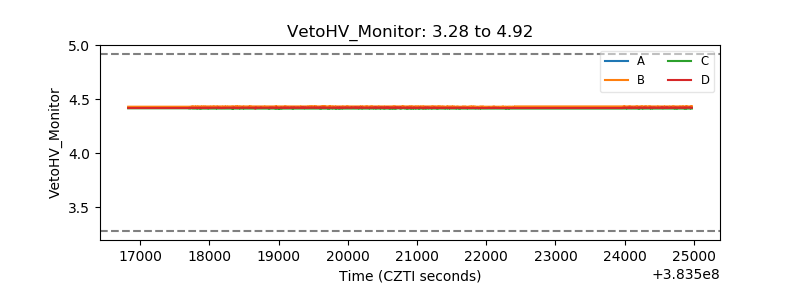 |
| Veto LLD | 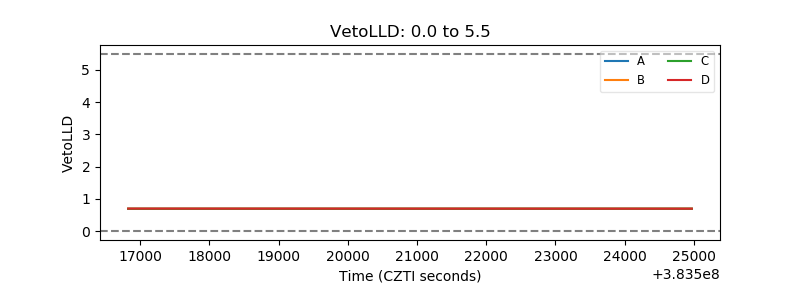 |
| Alpha Counter | 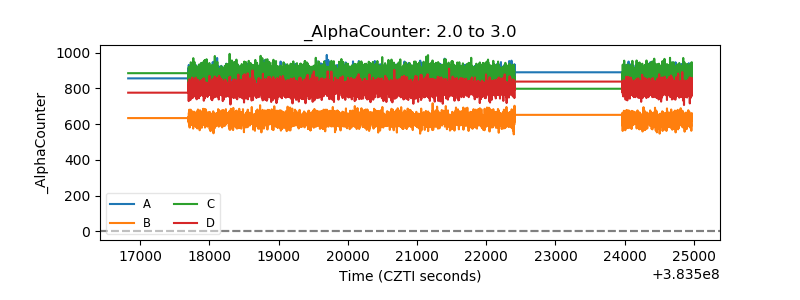 |
| _CPM_Rate | 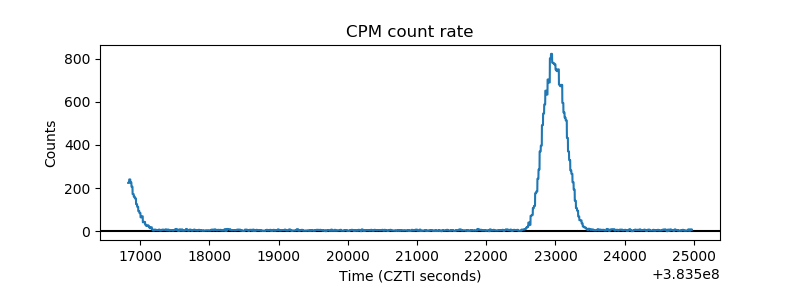 |
| CZT Counter | 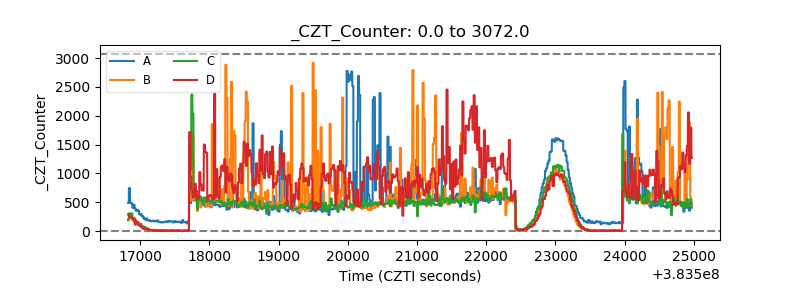 |
| +2.5 Volts monitor |  |
| +5 Volts monitor | 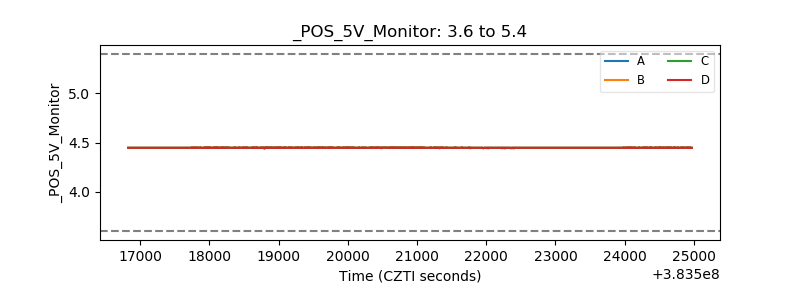 |
| _ROLL_ROT | 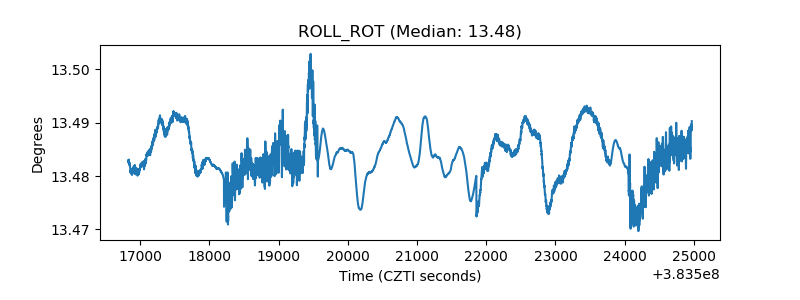 |
| _Roll_DEC | 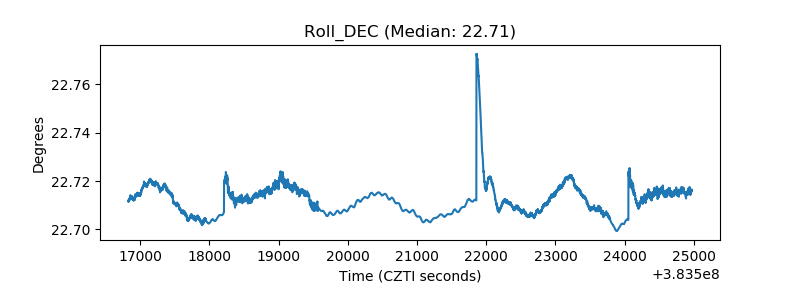 |
| _Roll_RA | 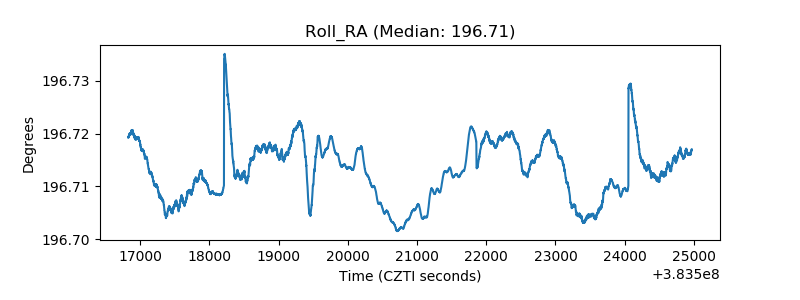 |
| Veto Counter | 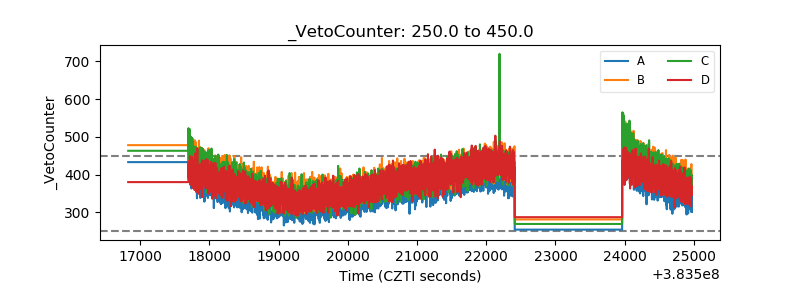 |