| Param | Original file | Final file |
|---|---|---|
| Filename | modeM0/AS1T04_078T01_9000004962_34683cztM0_level2.evt | modeM0/AS1T04_078T01_9000004962_34683cztM0_level2_quad_clean.evt |
| Size (bytes) | 510,451,200 | 60,491,520 |
| Size | 486.8 MB | 57.7 MB |
| Events in quadrant A | 3,045,450 | 386,612 |
| Events in quadrant B | 3,904,305 | 369,409 |
| Events in quadrant C | 2,795,399 | 376,576 |
| Events in quadrant D | 5,382,645 | 355,337 |
| Mode M0 | |||
|---|---|---|---|
| Quadrant | BADHDUFLAG | Total packets | Discarded packets |
| A | 0 | 11971 | 3 |
| B | 0 | 14557 | 2 |
| C | 0 | 10985 | 2 |
| D | 0 | 19478 | 2 |
| Mode M9 | |||
|---|---|---|---|
| Quadrant | BADHDUFLAG | Total packets | Discarded packets |
| A | 0 | 21 | 0 |
| B | 0 | 21 | 0 |
| C | 0 | 21 | 0 |
| D | 0 | 22 | 0 |
| Mode SS | |||
|---|---|---|---|
| Quadrant | BADHDUFLAG | Total packets | Discarded packets |
| A | 0 | 100 | 0 |
| B | 0 | 100 | 0 |
| C | 0 | 100 | 0 |
| D | 0 | 100 | 0 |
| Quadrant | Total seconds | Saturated seconds | Saturation percentage |
|---|---|---|---|
| A | 4897 | 33 | 0.673882% |
| B | 4897 | 445 | 9.087196% |
| C | 4897 | 20 | 0.408413% |
| D | 4897 | 334 | 6.820502% |
Noise dominated data is calculated using 1-second bins in cleaned event files. If a bin has >2000 counts, and if more than 50% of those come from <1% of pixels, then it is considered to be noise-dominated and hence unusable.
| Quadrant | # 1 sec bins | Bins with >0 counts | Bins with >2000 counts | High rate bins dominated by noise | Noise dominated (total time) | Noise dominated (detector-on time) | Marked lightcurve |
|---|---|---|---|---|---|---|---|
| A | 7020 | 4898 | 15 | 15 | 0.21% | 0.31% | 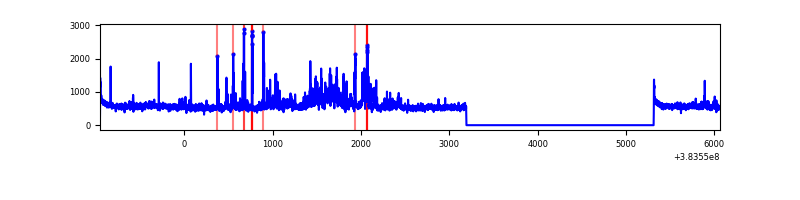 |
| B | 7020 | 4898 | 314 | 314 | 4.47% | 6.41% | 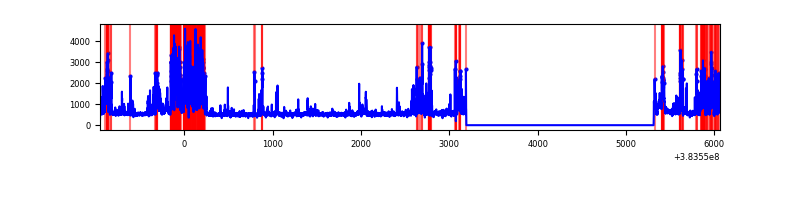 |
| C | 7020 | 4898 | 11 | 11 | 0.16% | 0.22% | 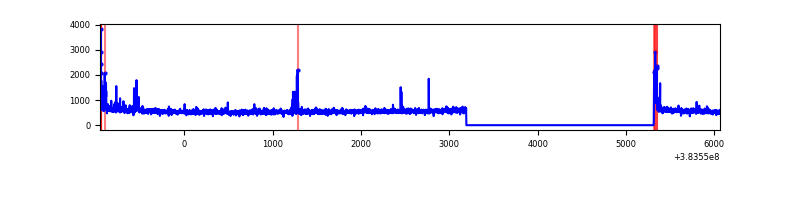 |
| D | 7020 | 4898 | 306 | 306 | 4.36% | 6.25% | 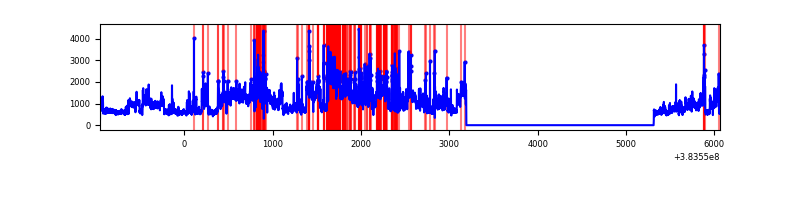 |
Top three noisy pixels from each quadrant. If the there are fewer than three noisy pixels in the level2.evt file, extra rows are filled as -1
| Pixel properties | Quadrant properties | ||||||
|---|---|---|---|---|---|---|---|
| Quadrant | DetID | PixID | Counts | Sigma | Mean | Median | Sigma |
| A | 15 | 169 | 416539 | 3200.74 | 644 | 634 | 129.9 |
| A | 10 | 83 | 46976 | 356.64 | 644 | 634 | 129.9 |
| A | 9 | 143 | 25962 | 194.92 | 644 | 634 | 129.9 |
| B | 5 | 172 | 744817 | 6418.9 | 610 | 595 | 115.9 |
| B | 5 | 255 | 408664 | 3519.59 | 610 | 595 | 115.9 |
| B | 4 | 81 | 121001 | 1038.5 | 610 | 595 | 115.9 |
| C | 15 | 214 | 212017 | 1503.12 | 609 | 613 | 140.6 |
| C | 0 | 10 | 79865 | 563.5 | 609 | 613 | 140.6 |
| C | 15 | 159 | 59583 | 419.29 | 609 | 613 | 140.6 |
| D | 8 | 195 | 2005494 | 13540.76 | 606 | 588 | 148.1 |
| D | 7 | 38 | 384253 | 2591.2 | 606 | 588 | 148.1 |
| D | 2 | 249 | 153407 | 1032.11 | 606 | 588 | 148.1 |
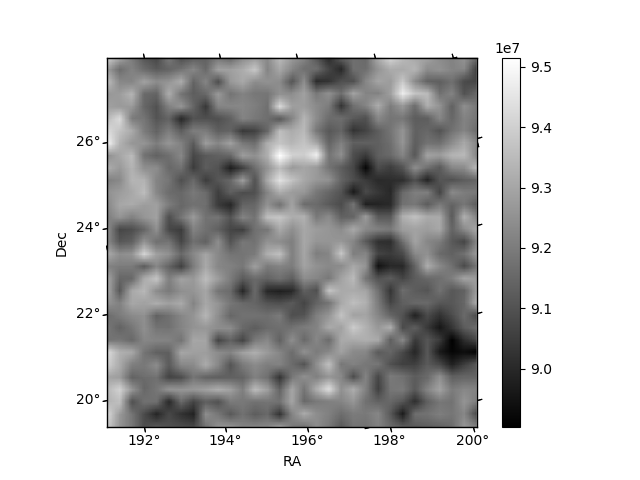
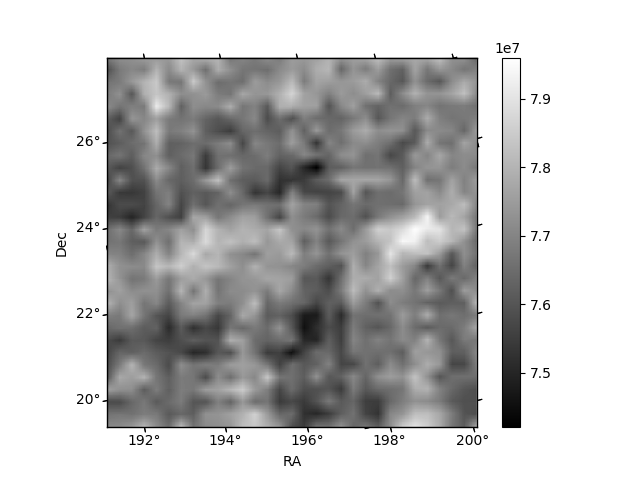
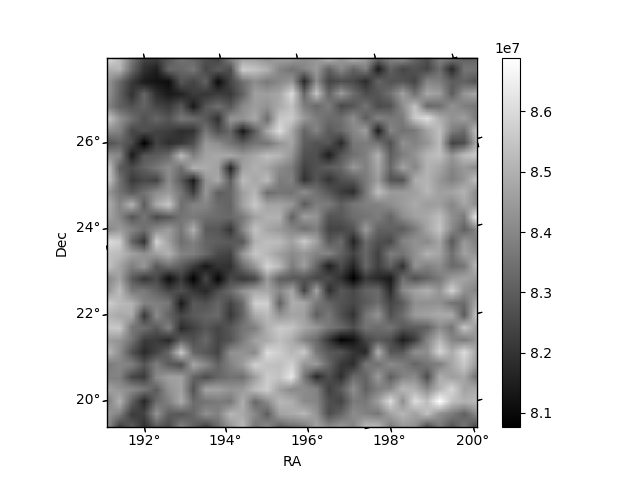
Histogram calculated using DETX and DETY for each event in the final _common_clean file
| Quadrant A | 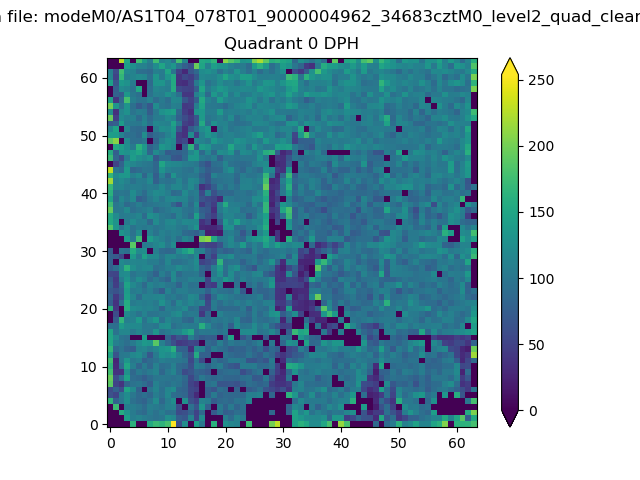 |
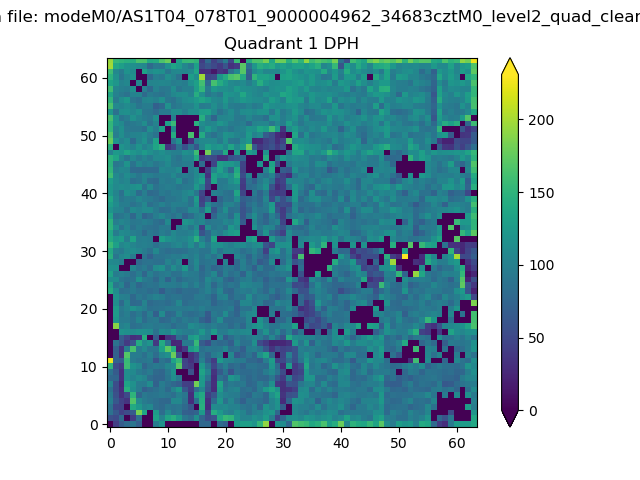 |
Quadrant B |
|---|---|---|---|
| Quadrant D | 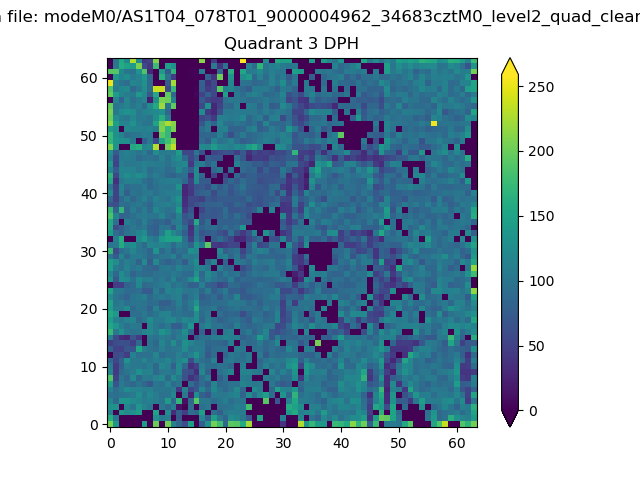 |
 |
Quadrant C |
| Plot type | Count rate plots | Images |
|---|---|---|
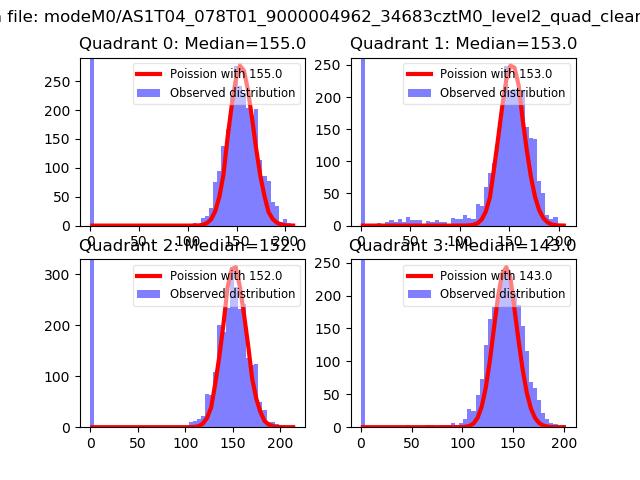
| Comparison with Poisson distribution Blue bars denote a histogram of data divided into 1 sec bins. Red curve is a Poisson curve with rate = median count rate of data. |
 |
 |
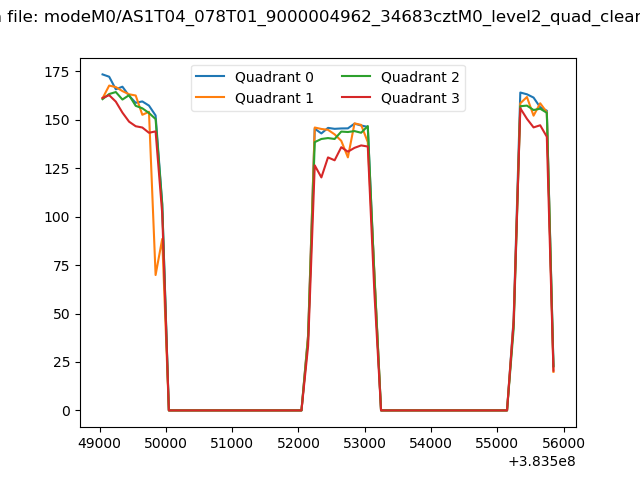
| Quadrant-wise count rates Data is divided into 100 sec bins |
 |
|
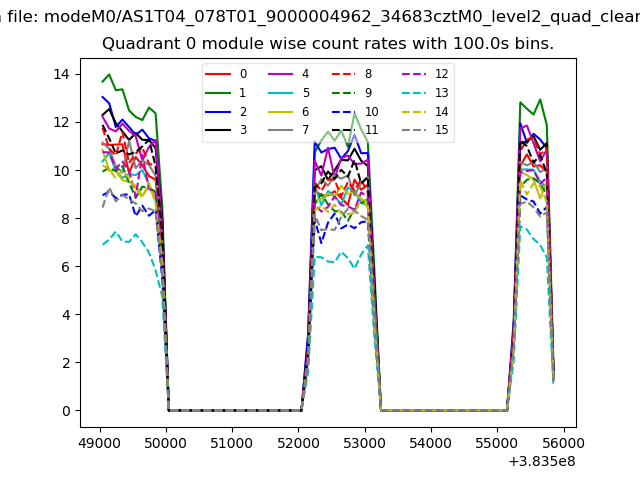
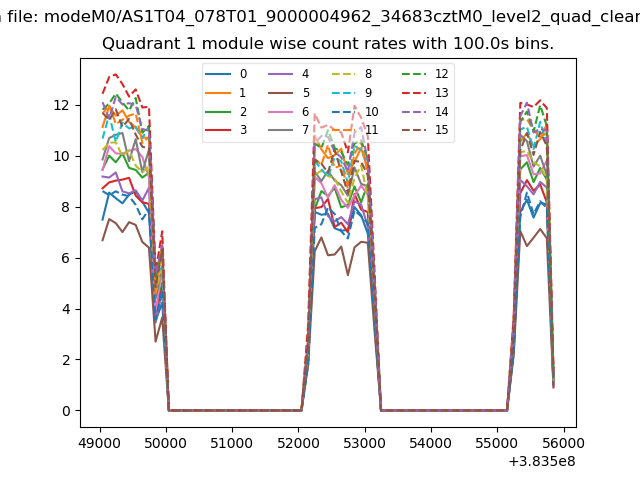
| Module-wise count rates for Quadrant A Data is divided into 100 sec bins |
 |
 |
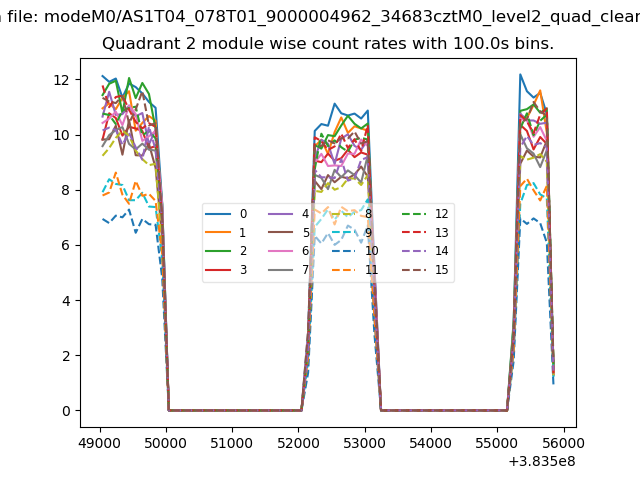
| Module-wise count rates for Quadrant B Data is divided into 100 sec bins |
 |
 |
| Module-wise count rates for Quadrant C Data is divided into 100 sec bins |
 |
 |
| Module-wise count rates for Quadrant D Data is divided into 100 sec bins |
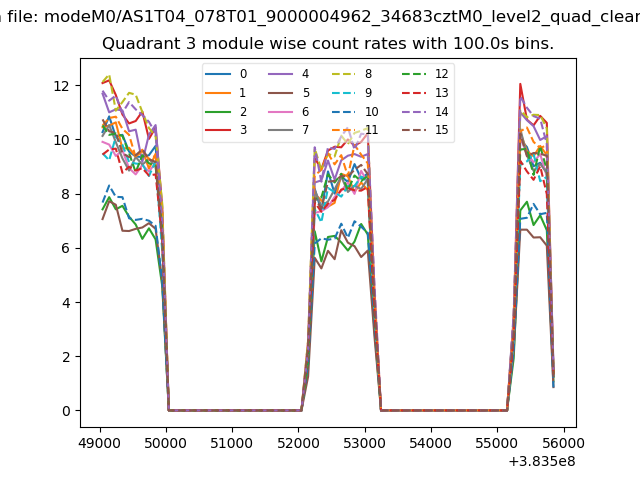 |
 |
| Parameter | Plot |
|---|---|
| CZT HV Monitor | 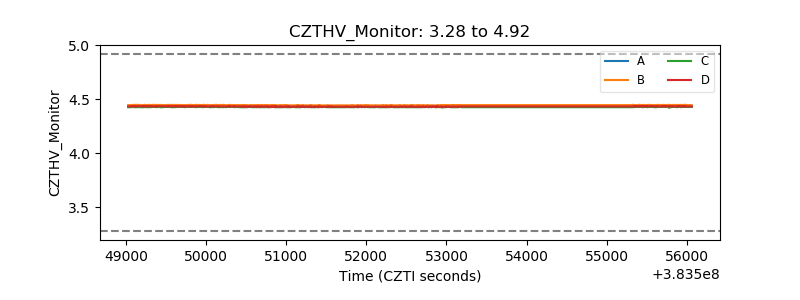 |
| D_VDD | 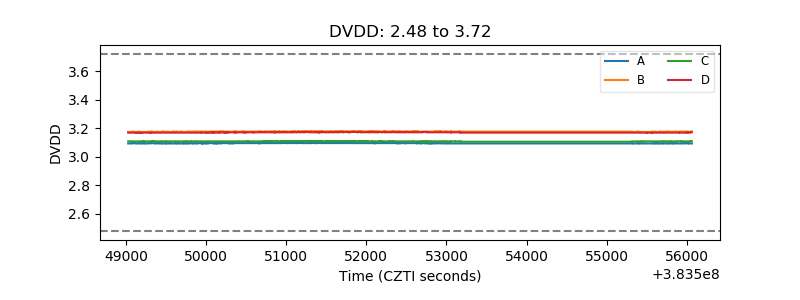 |
| Temperature 1 | 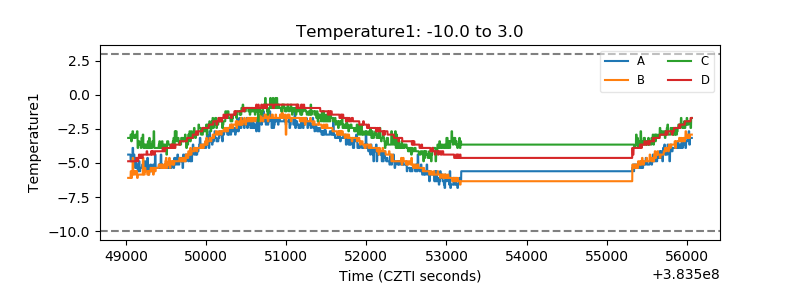 |
| Veto HV Monitor | 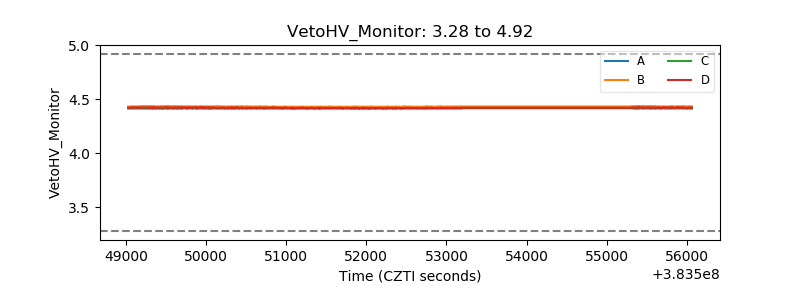 |
| Veto LLD | 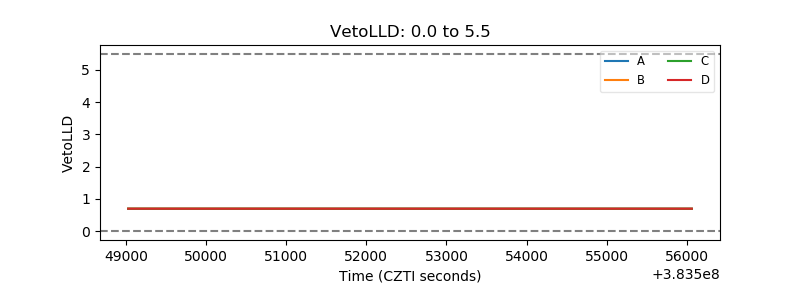 |
| Alpha Counter | 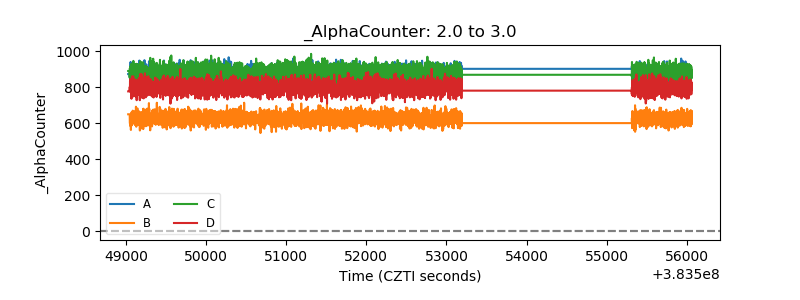 |
| _CPM_Rate | 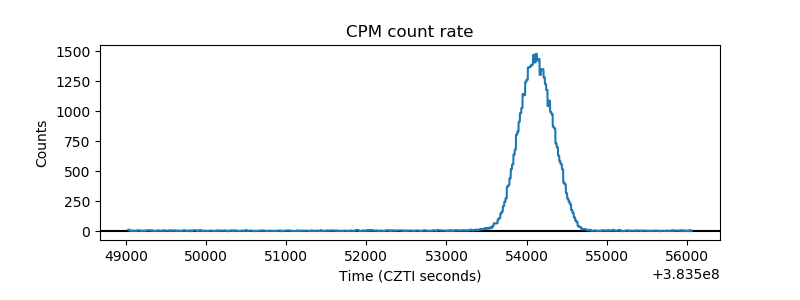 |
| CZT Counter | 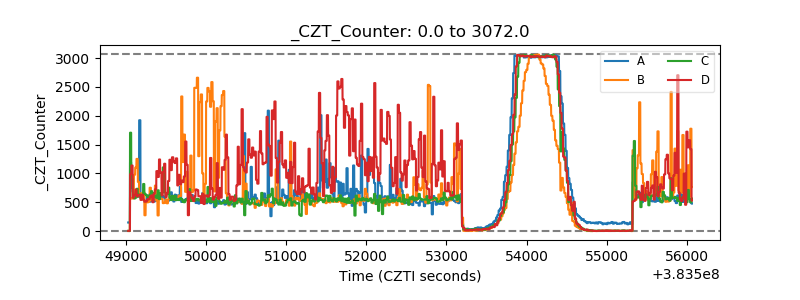 |
| +2.5 Volts monitor |  |
| +5 Volts monitor | 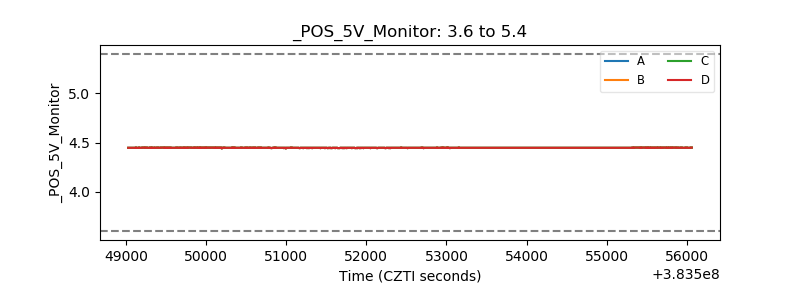 |
| _ROLL_ROT | 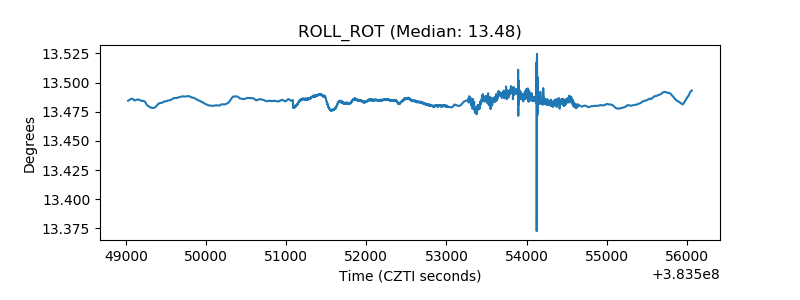 |
| _Roll_DEC | 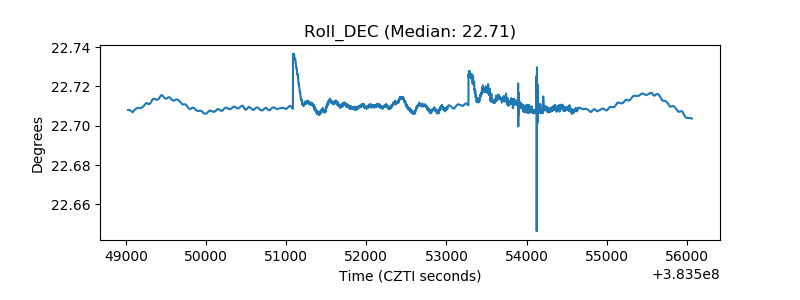 |
| _Roll_RA | 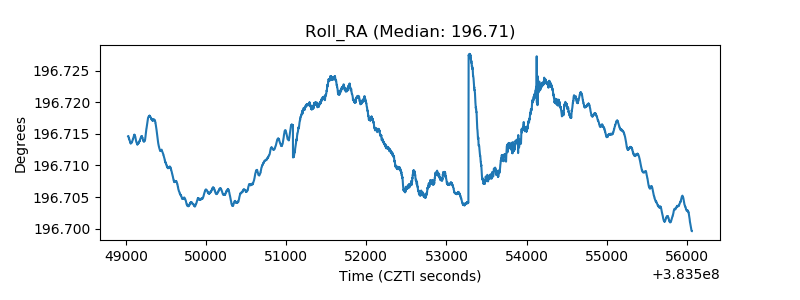 |
| Veto Counter | 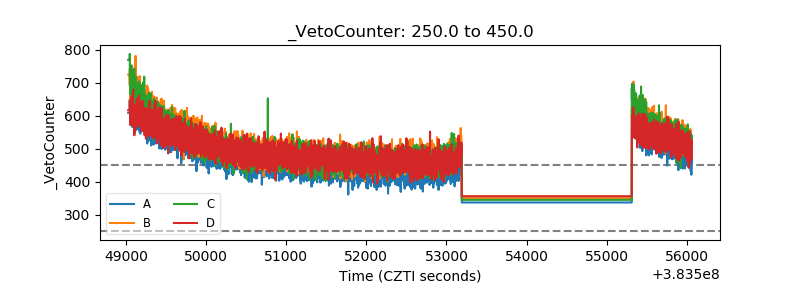 |