| Param | Original file | Final file |
|---|---|---|
| Filename | modeM0/AS1A07_093T11_9000004964cztM0_level2.fits | modeM0/AS1A07_093T11_9000004964cztM0_level2_quad_clean.evt |
| Size (bytes) | 71,876,160 | 111,208,320 |
| Size | 68.5 MB | 106.1 MB |
| Events in quadrant A | 443,950 | 774,345 |
| Events in quadrant B | 394,516 | 708,168 |
| Events in quadrant C | 433,306 | 728,634 |
| Events in quadrant D | 352,598 | 604,577 |
| Mode M9 | |||
|---|---|---|---|
| Quadrant | BADHDUFLAG | Total packets | Discarded packets |
| A | 0 | 31 | 0 |
| B | 0 | 31 | 0 |
| C | 0 | 31 | 0 |
| D | 0 | 31 | 0 |
| Mode M0 | |||
|---|---|---|---|
| Quadrant | BADHDUFLAG | Total packets | Discarded packets |
| A | 0 | 16344 | 0 |
| B | 0 | 23620 | 0 |
| C | 0 | 16717 | 0 |
| D | 0 | 31835 | 0 |
| Mode SS | |||
|---|---|---|---|
| Quadrant | BADHDUFLAG | Total packets | Discarded packets |
| A | 0 | 164 | 0 |
| B | 0 | 164 | 0 |
| C | 0 | 164 | 0 |
| D | 0 | 164 | 0 |
| Quadrant | Total seconds | Saturated seconds | Saturation percentage |
|---|---|---|---|
| A | 7936 | 29 | 0.365423% |
| B | 7936 | 958 | 12.071573% |
| C | 7936 | 40 | 0.504032% |
| D | 7936 | 849 | 10.698085% |
Noise dominated data is calculated using 1-second bins in cleaned event files. If a bin has >2000 counts, and if more than 50% of those come from <1% of pixels, then it is considered to be noise-dominated and hence unusable.
| Quadrant | # 1 sec bins | Bins with >0 counts | Bins with >2000 counts | High rate bins dominated by noise | Noise dominated (total time) | Noise dominated (detector-on time) | Marked lightcurve |
|---|---|---|---|---|---|---|---|
| A | 11099 | 7936 | 0 | 0 | 0.00% | 0.00% |  |
| B | 11099 | 7919 | 0 | 0 | 0.00% | 0.00% |  |
| C | 11099 | 7936 | 0 | 0 | 0.00% | 0.00% |  |
| D | 11099 | 7924 | 0 | 0 | 0.00% | 0.00% |  |
Top three noisy pixels from each quadrant. If the there are fewer than three noisy pixels in the level2.evt file, extra rows are filled as -1
| Pixel properties | Quadrant properties | ||||||
|---|---|---|---|---|---|---|---|
| Quadrant | DetID | PixID | Counts | Sigma | Mean | Median | Sigma |
| A | 9 | 19 | 366 | 8.44 | 116 | 109 | 30.4 |
| A | 7 | 110 | 344 | 7.72 | 116 | 109 | 30.4 |
| A | 0 | 29 | 342 | 7.66 | 116 | 109 | 30.4 |
| B | 2 | 9 | 364 | 12.09 | 104 | 100 | 21.8 |
| B | 3 | 80 | 328 | 10.44 | 104 | 100 | 21.8 |
| B | 2 | 8 | 313 | 9.75 | 104 | 100 | 21.8 |
| C | 3 | 202 | 363 | 8.1 | 114 | 108 | 31.5 |
| C | 3 | 203 | 361 | 8.04 | 114 | 108 | 31.5 |
| C | 3 | 187 | 304 | 6.23 | 114 | 108 | 31.5 |
| D | 6 | 67 | 276 | 6.54 | 100 | 91 | 28.3 |
| D | 4 | 160 | 275 | 6.5 | 100 | 91 | 28.3 |
| D | 10 | 189 | 274 | 6.46 | 100 | 91 | 28.3 |
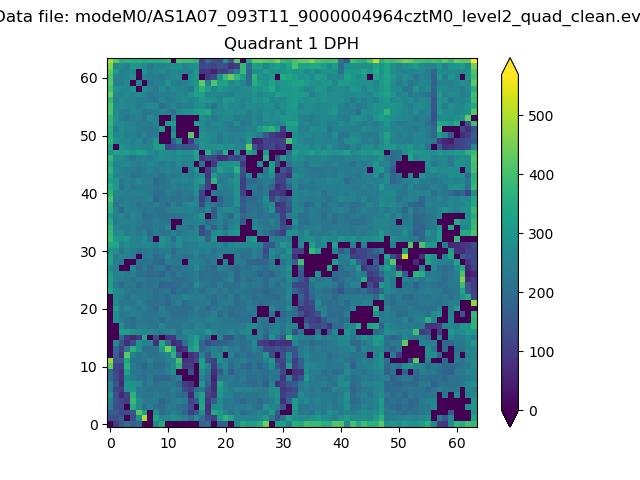
Histogram calculated using DETX and DETY for each event in the final _common_clean file
| Quadrant A |  |
 |
Quadrant B |
|---|---|---|---|
| Quadrant D |  |
 |
Quadrant C |
| Plot type | Count rate plots | Images |
|---|---|---|
| Comparison with Poisson distribution Blue bars denote a histogram of data divided into 1 sec bins. Red curve is a Poisson curve with rate = median count rate of data. |
 |
 |
| Quadrant-wise count rates Data is divided into 100 sec bins |
 |
|
| Module-wise count rates for Quadrant A Data is divided into 100 sec bins |
 |
 |
| Module-wise count rates for Quadrant B Data is divided into 100 sec bins |
 |
 |
| Module-wise count rates for Quadrant C Data is divided into 100 sec bins |
 |
 |
| Module-wise count rates for Quadrant D Data is divided into 100 sec bins |
 |
 |
| Parameter | Plot |
|---|---|
| CZT HV Monitor |  |
| D_VDD |  |
| Temperature 1 |  |
| Veto HV Monitor |  |
| Veto LLD |  |
| Alpha Counter |  |
| _CPM_Rate |  |
| CZT Counter |  |
| +2.5 Volts monitor |  |
| +5 Volts monitor |  |
| _ROLL_ROT |  |
| _Roll_DEC |  |
| _Roll_RA |  |
| Veto Counter |  |