| Param | Original file | Final file |
|---|---|---|
| Filename | modeM0/AS1A07_093T16_9000004966cztM0_level2.fits | modeM0/AS1A07_093T16_9000004966cztM0_level2_quad_clean.evt |
| Size (bytes) | 77,094,720 | 93,142,080 |
| Size | 73.5 MB | 88.8 MB |
| Events in quadrant A | 472,526 | 615,413 |
| Events in quadrant B | 432,648 | 573,403 |
| Events in quadrant C | 461,010 | 580,237 |
| Events in quadrant D | 374,088 | 457,168 |
| Mode M0 | |||
|---|---|---|---|
| Quadrant | BADHDUFLAG | Total packets | Discarded packets |
| A | 0 | 17808 | 0 |
| B | 0 | 24223 | 0 |
| C | 0 | 17618 | 0 |
| D | 0 | 33083 | 0 |
| Mode M9 | |||
|---|---|---|---|
| Quadrant | BADHDUFLAG | Total packets | Discarded packets |
| A | 0 | 26 | 0 |
| B | 0 | 26 | 0 |
| C | 0 | 26 | 0 |
| D | 0 | 26 | 0 |
| Mode SS | |||
|---|---|---|---|
| Quadrant | BADHDUFLAG | Total packets | Discarded packets |
| A | 0 | 174 | 0 |
| B | 0 | 174 | 0 |
| C | 0 | 174 | 0 |
| D | 0 | 174 | 0 |
| Quadrant | Total seconds | Saturated seconds | Saturation percentage |
|---|---|---|---|
| A | 8557 | 24 | 0.280472% |
| B | 8557 | 711 | 8.308987% |
| C | 8557 | 26 | 0.303845% |
| D | 8557 | 1002 | 11.709711% |
Noise dominated data is calculated using 1-second bins in cleaned event files. If a bin has >2000 counts, and if more than 50% of those come from <1% of pixels, then it is considered to be noise-dominated and hence unusable.
| Quadrant | # 1 sec bins | Bins with >0 counts | Bins with >2000 counts | High rate bins dominated by noise | Noise dominated (total time) | Noise dominated (detector-on time) | Marked lightcurve |
|---|---|---|---|---|---|---|---|
| A | 11151 | 8557 | 0 | 0 | 0.00% | 0.00% | 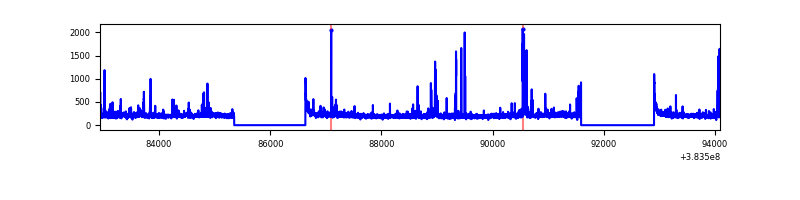 |
| B | 11151 | 8541 | 0 | 0 | 0.00% | 0.00% | 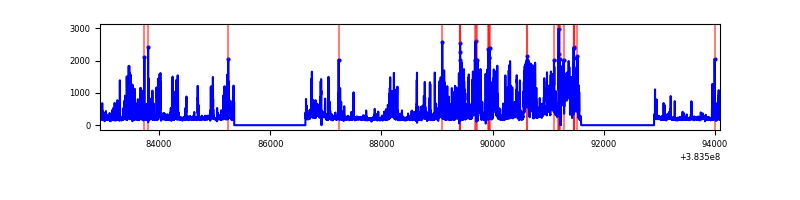 |
| C | 11151 | 8557 | 0 | 0 | 0.00% | 0.00% | 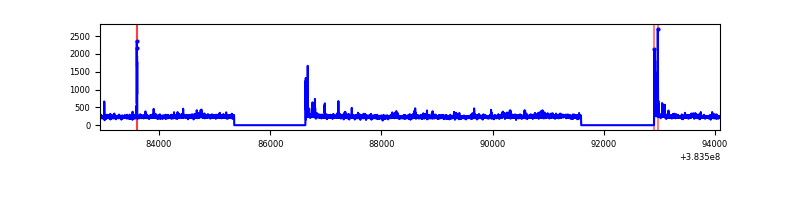 |
| D | 11151 | 8536 | 0 | 0 | 0.00% | 0.00% | 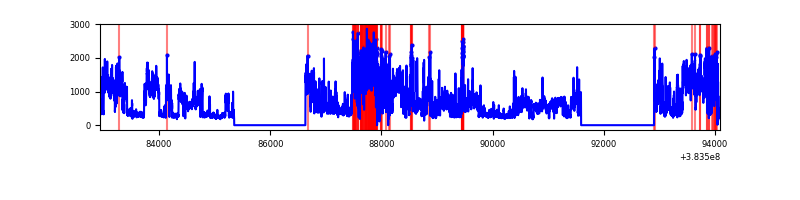 |
Top three noisy pixels from each quadrant. If the there are fewer than three noisy pixels in the level2.evt file, extra rows are filled as -1
| Pixel properties | Quadrant properties | ||||||
|---|---|---|---|---|---|---|---|
| Quadrant | DetID | PixID | Counts | Sigma | Mean | Median | Sigma |
| A | 7 | 110 | 391 | 8.47 | 123 | 116 | 32.5 |
| A | 0 | 29 | 389 | 8.41 | 123 | 116 | 32.5 |
| A | 15 | 236 | 384 | 8.26 | 123 | 116 | 32.5 |
| B | 2 | 9 | 342 | 9.26 | 114 | 110 | 25.0 |
| B | 3 | 80 | 340 | 9.18 | 114 | 110 | 25.0 |
| B | 3 | 17 | 299 | 7.55 | 114 | 110 | 25.0 |
| C | 1 | 80 | 396 | 8.46 | 121 | 114 | 33.3 |
| C | 1 | 81 | 387 | 8.19 | 121 | 114 | 33.3 |
| C | 3 | 203 | 385 | 8.13 | 121 | 114 | 33.3 |
| D | 1 | 3 | 294 | 6.68 | 106 | 97 | 29.4 |
| D | 6 | 67 | 285 | 6.37 | 106 | 97 | 29.4 |
| D | 10 | 113 | 281 | 6.24 | 106 | 97 | 29.4 |
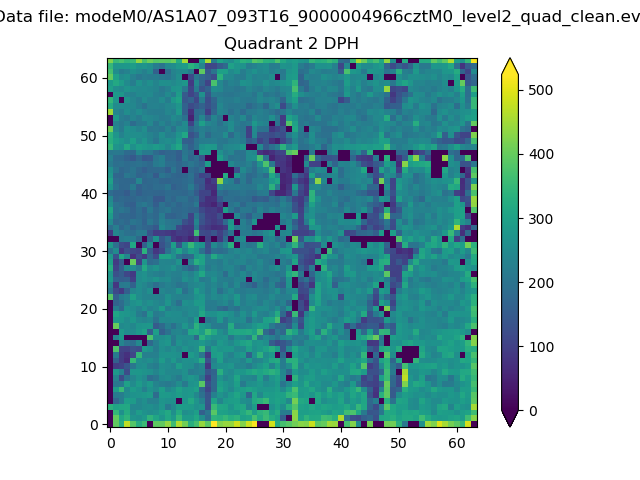
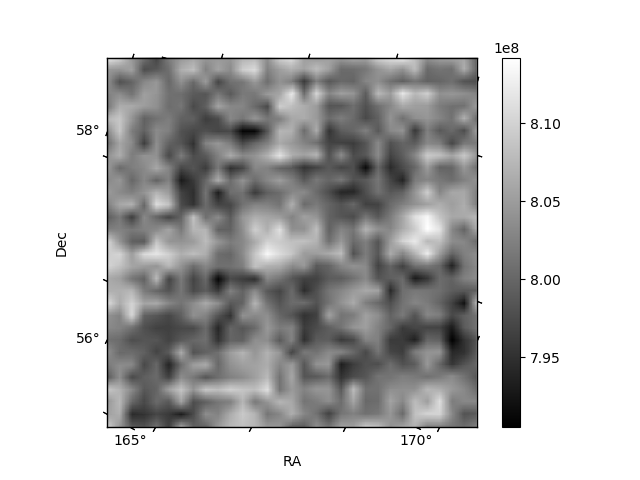
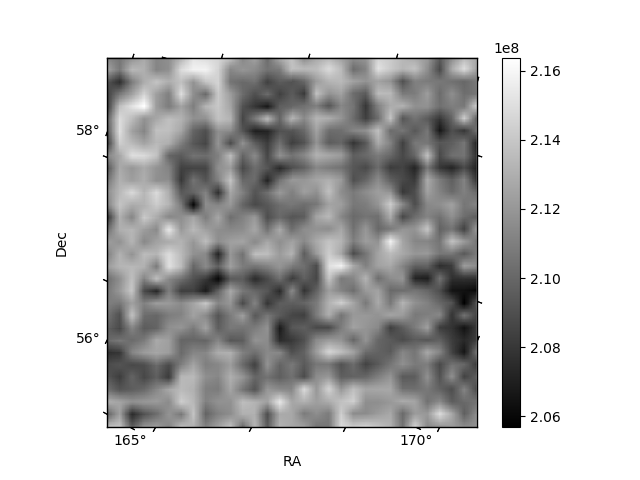
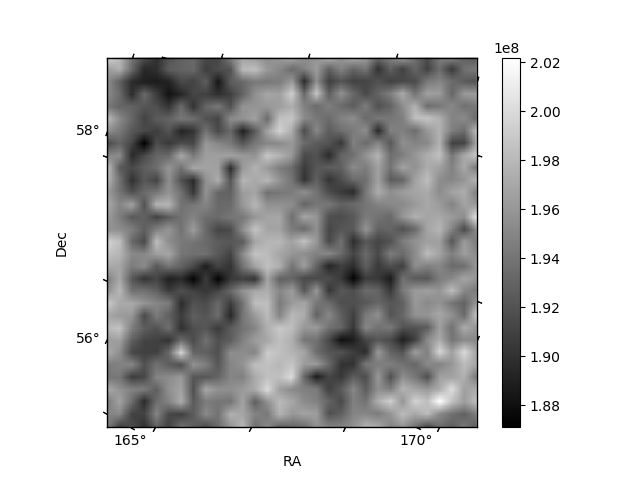
Histogram calculated using DETX and DETY for each event in the final _common_clean file
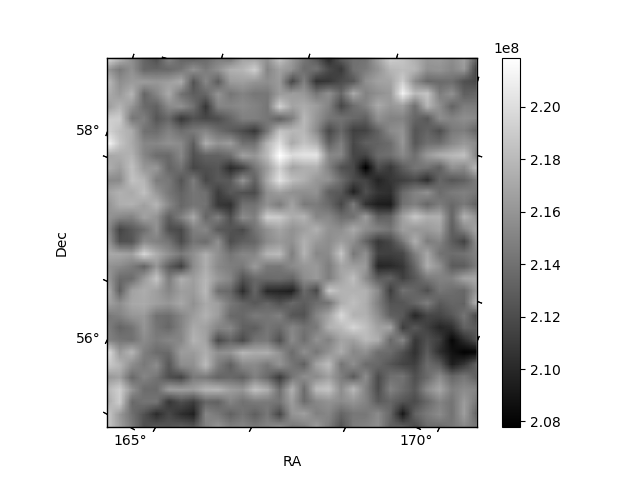
| Quadrant A | 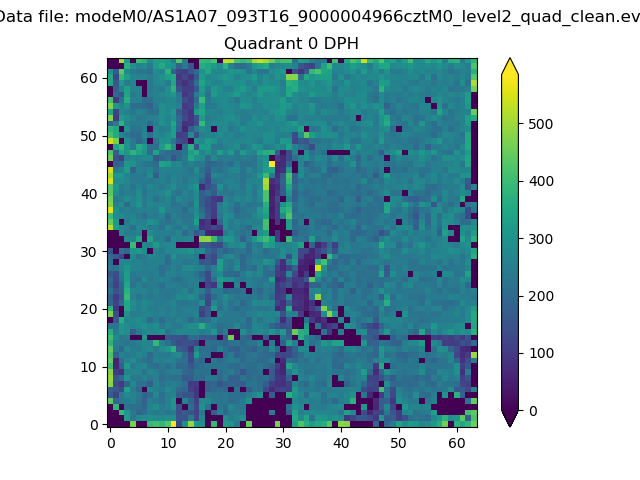 |
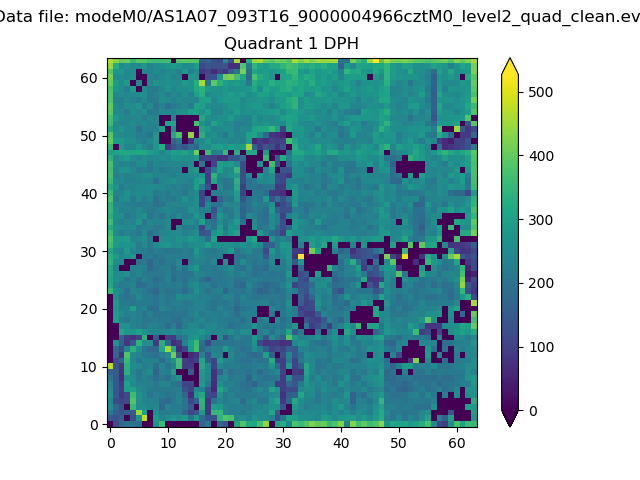 |
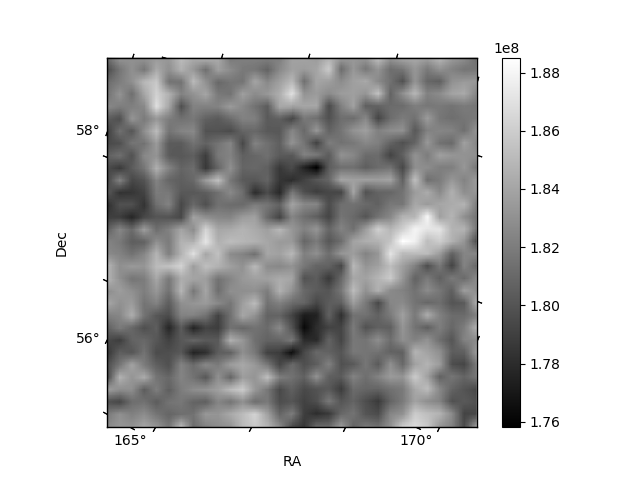
Quadrant B |
|---|---|---|---|
| Quadrant D | 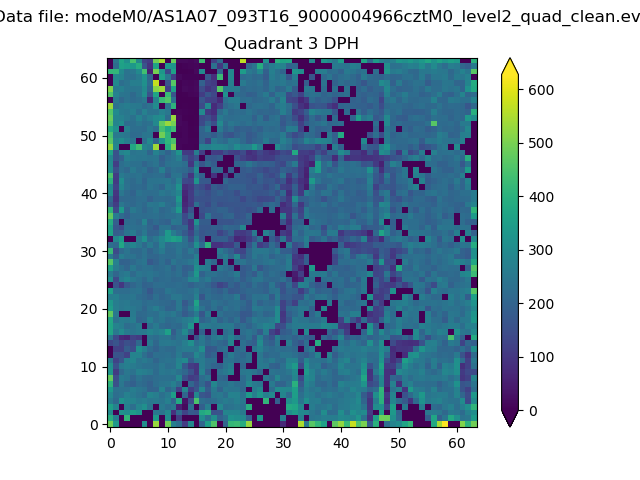 |
 |
Quadrant C |
| Plot type | Count rate plots | Images |
|---|---|---|
| Comparison with Poisson distribution Blue bars denote a histogram of data divided into 1 sec bins. Red curve is a Poisson curve with rate = median count rate of data. |
 |
 |
| Quadrant-wise count rates Data is divided into 100 sec bins |
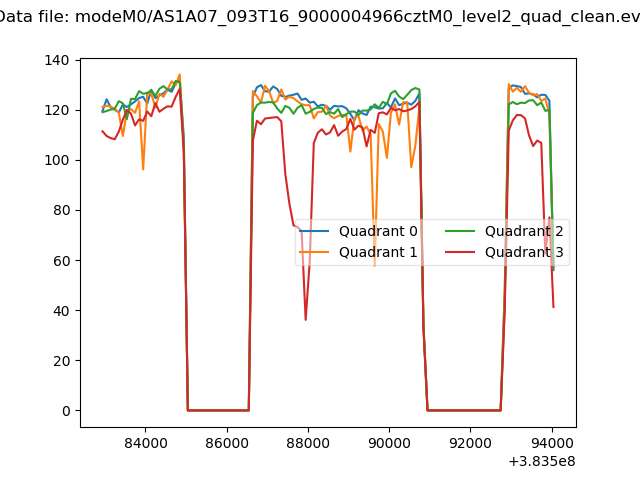 |
|
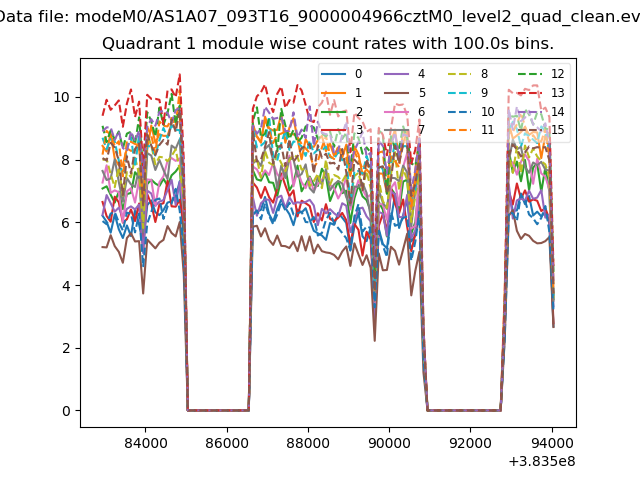
| Module-wise count rates for Quadrant A Data is divided into 100 sec bins |
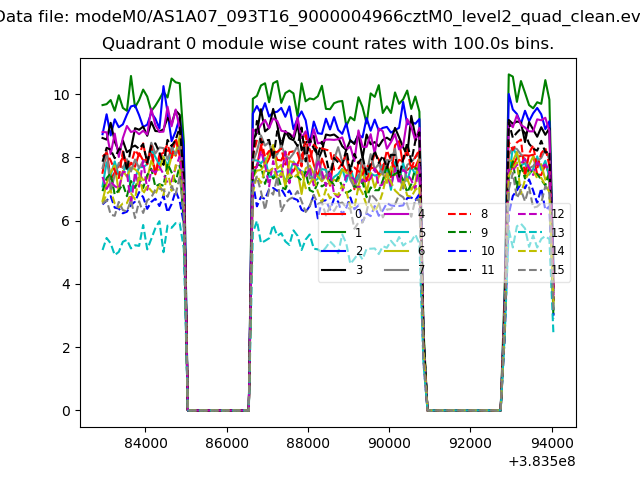 |
 |
| Module-wise count rates for Quadrant B Data is divided into 100 sec bins |
 |
 |
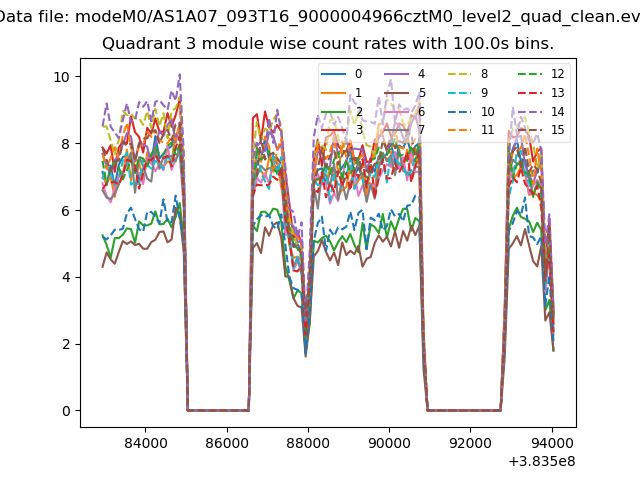
| Module-wise count rates for Quadrant C Data is divided into 100 sec bins |
 |
 |
| Module-wise count rates for Quadrant D Data is divided into 100 sec bins |
 |
 |
| Parameter | Plot |
|---|---|
| CZT HV Monitor |  |
| D_VDD | 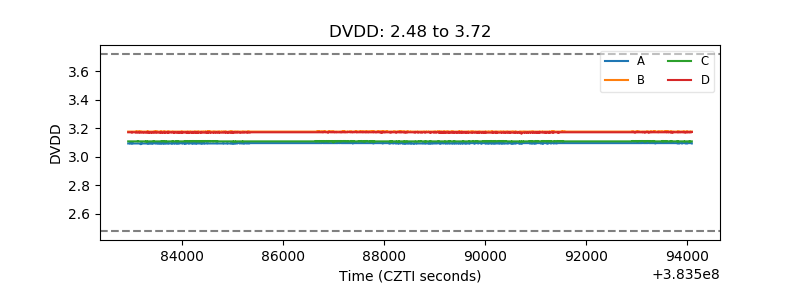 |
| Temperature 1 | 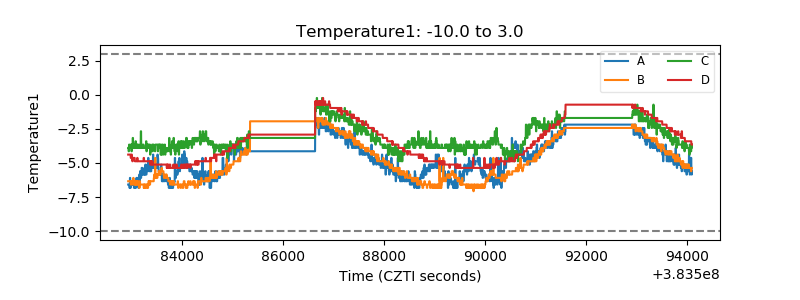 |
| Veto HV Monitor |  |
| Veto LLD | 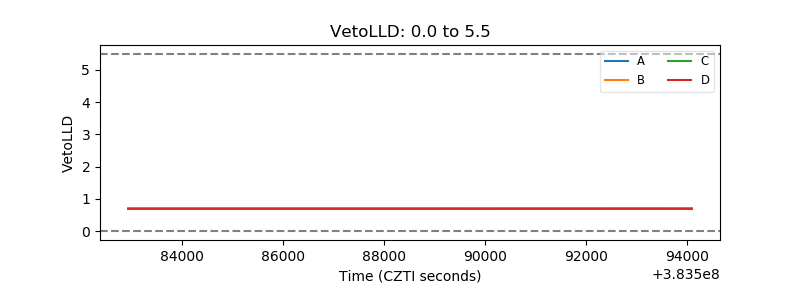 |
| Alpha Counter |  |
| _CPM_Rate | 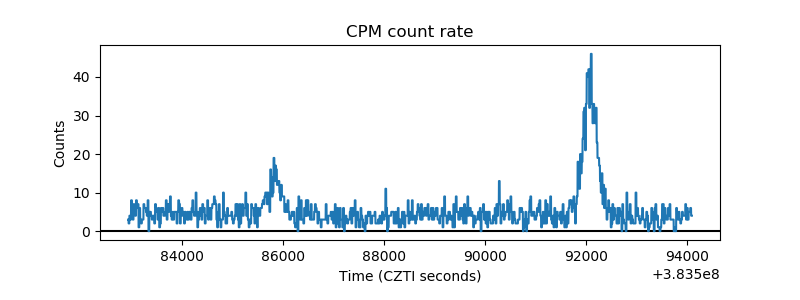 |
| CZT Counter | 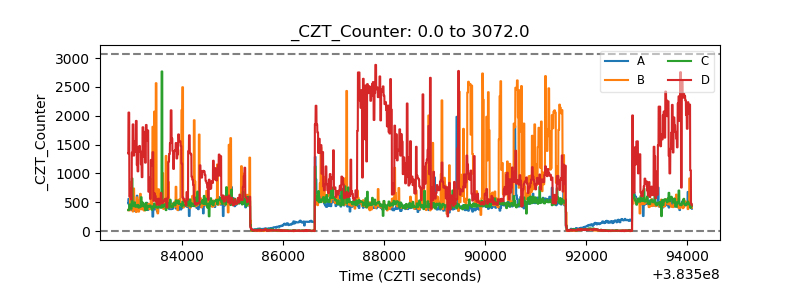 |
| +2.5 Volts monitor |  |
| +5 Volts monitor | 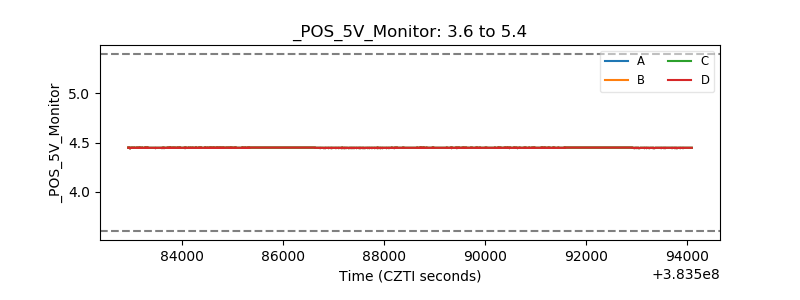 |
| _ROLL_ROT | 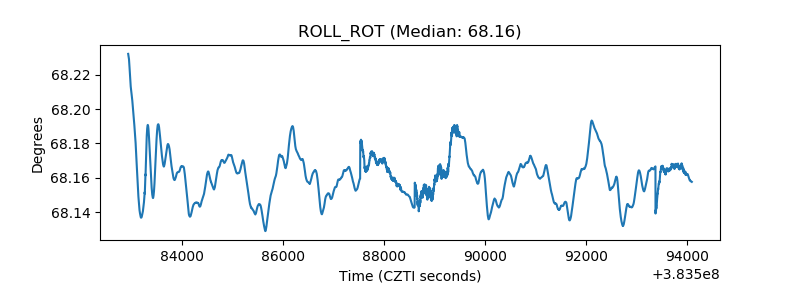 |
| _Roll_DEC | 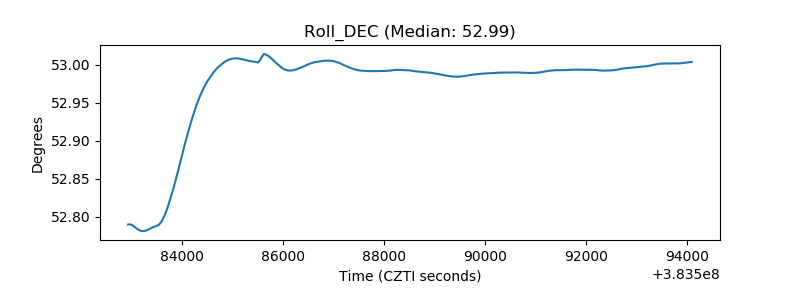 |
| _Roll_RA | 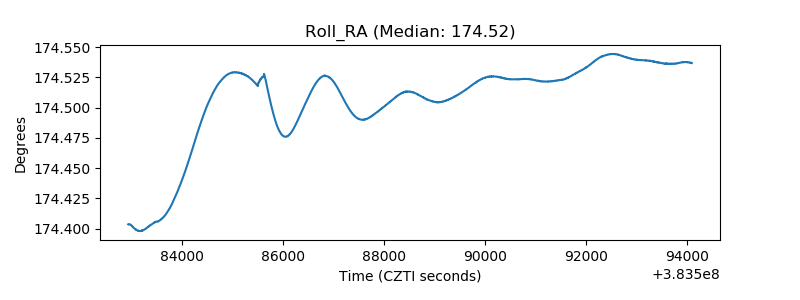 |
| Veto Counter | 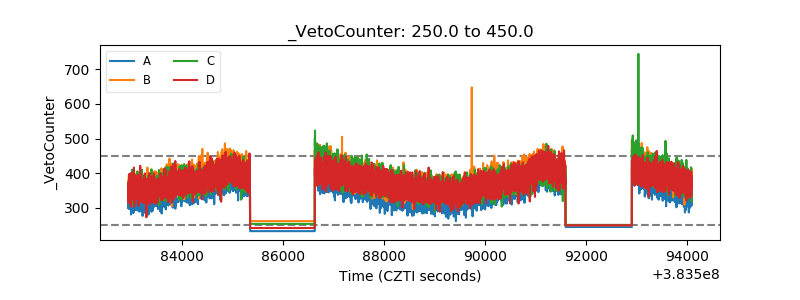 |