| Param | Original file | Final file |
|---|---|---|
| Filename | modeM0/AS1A07_093T29_9000004968cztM0_level2.fits | modeM0/AS1A07_093T29_9000004968cztM0_level2_quad_clean.evt |
| Size (bytes) | 119,165,760 | 120,988,800 |
| Size | 113.6 MB | 115.4 MB |
| Events in quadrant A | 725,736 | 729,708 |
| Events in quadrant B | 663,468 | 668,822 |
| Events in quadrant C | 709,538 | 714,069 |
| Events in quadrant D | 604,108 | 645,153 |
| Mode M9 | |||
|---|---|---|---|
| Quadrant | BADHDUFLAG | Total packets | Discarded packets |
| A | 0 | 45 | 0 |
| B | 0 | 45 | 0 |
| C | 0 | 45 | 0 |
| D | 0 | 45 | 0 |
| Mode M0 | |||
|---|---|---|---|
| Quadrant | BADHDUFLAG | Total packets | Discarded packets |
| A | 0 | 30144 | 0 |
| B | 0 | 39157 | 0 |
| C | 0 | 27643 | 0 |
| D | 0 | 40737 | 0 |
| Mode SS | |||
|---|---|---|---|
| Quadrant | BADHDUFLAG | Total packets | Discarded packets |
| A | 0 | 268 | 0 |
| B | 0 | 268 | 0 |
| C | 0 | 268 | 0 |
| D | 0 | 268 | 0 |
| Quadrant | Total seconds | Saturated seconds | Saturation percentage |
|---|---|---|---|
| A | 13106 | 172 | 1.312376% |
| B | 13106 | 1178 | 8.988250% |
| C | 13106 | 98 | 0.747749% |
| D | 13106 | 324 | 2.472150% |
Noise dominated data is calculated using 1-second bins in cleaned event files. If a bin has >2000 counts, and if more than 50% of those come from <1% of pixels, then it is considered to be noise-dominated and hence unusable.
| Quadrant | # 1 sec bins | Bins with >0 counts | Bins with >2000 counts | High rate bins dominated by noise | Noise dominated (total time) | Noise dominated (detector-on time) | Marked lightcurve |
|---|---|---|---|---|---|---|---|
| A | 17583 | 13106 | 0 | 0 | 0.00% | 0.00% |  |
| B | 17583 | 13062 | 0 | 0 | 0.00% | 0.00% |  |
| C | 17583 | 13107 | 0 | 0 | 0.00% | 0.00% | 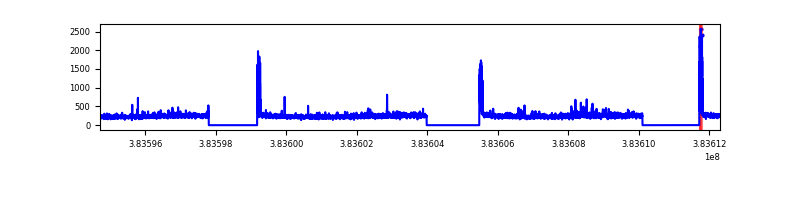 |
| D | 17583 | 13105 | 0 | 0 | 0.00% | 0.00% |  |
Top three noisy pixels from each quadrant. If the there are fewer than three noisy pixels in the level2.evt file, extra rows are filled as -1
| Pixel properties | Quadrant properties | ||||||
|---|---|---|---|---|---|---|---|
| Quadrant | DetID | PixID | Counts | Sigma | Mean | Median | Sigma |
| A | 9 | 19 | 595 | 8.59 | 189 | 178 | 48.5 |
| A | 7 | 110 | 591 | 8.51 | 189 | 178 | 48.5 |
| A | 0 | 29 | 584 | 8.37 | 189 | 178 | 48.5 |
| B | 2 | 9 | 570 | 11.07 | 175 | 167 | 36.4 |
| B | 3 | 80 | 514 | 9.53 | 175 | 167 | 36.4 |
| B | 5 | 128 | 490 | 8.87 | 175 | 167 | 36.4 |
| C | 1 | 80 | 578 | 8.2 | 187 | 176 | 49.0 |
| C | 1 | 81 | 557 | 7.77 | 187 | 176 | 49.0 |
| C | 3 | 187 | 500 | 6.61 | 187 | 176 | 49.0 |
| D | 10 | 189 | 454 | 6.22 | 172 | 157 | 47.7 |
| D | 4 | 160 | 447 | 6.08 | 172 | 157 | 47.7 |
| D | 10 | 113 | 434 | 5.8 | 172 | 157 | 47.7 |
Histogram calculated using DETX and DETY for each event in the final _common_clean file
| Quadrant A |  |
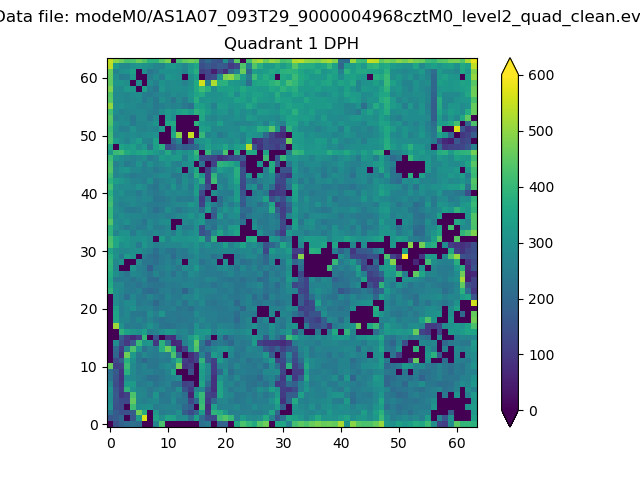 |
Quadrant B |
|---|---|---|---|
| Quadrant D |  |
 |
Quadrant C |
| Plot type | Count rate plots | Images |
|---|---|---|
| Comparison with Poisson distribution Blue bars denote a histogram of data divided into 1 sec bins. Red curve is a Poisson curve with rate = median count rate of data. |
 |
 |
| Quadrant-wise count rates Data is divided into 100 sec bins |
 |
|
| Module-wise count rates for Quadrant A Data is divided into 100 sec bins |
 |
 |
| Module-wise count rates for Quadrant B Data is divided into 100 sec bins |
 |
 |
| Module-wise count rates for Quadrant C Data is divided into 100 sec bins |
 |
 |
| Module-wise count rates for Quadrant D Data is divided into 100 sec bins |
 |
 |
| Parameter | Plot |
|---|---|
| CZT HV Monitor |  |
| D_VDD | 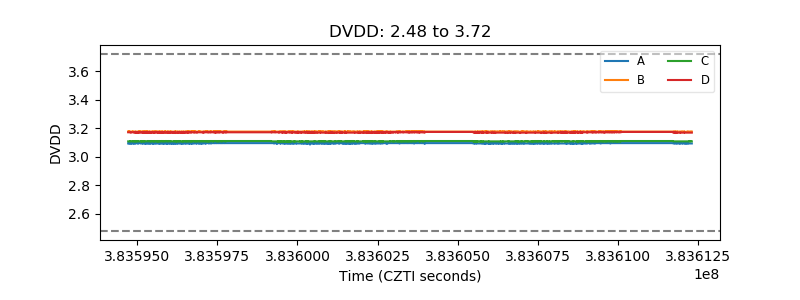 |
| Temperature 1 |  |
| Veto HV Monitor |  |
| Veto LLD |  |
| Alpha Counter |  |
| _CPM_Rate | 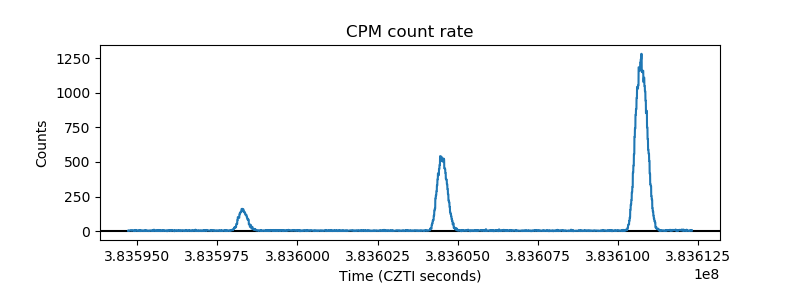 |
| CZT Counter |  |
| +2.5 Volts monitor |  |
| +5 Volts monitor |  |
| _ROLL_ROT |  |
| _Roll_DEC |  |
| _Roll_RA |  |
| Veto Counter |  |