| Param | Original file | Final file |
|---|---|---|
| Filename | modeM0/AS1A07_138T08_9000004970_34697cztM0_level2.evt | modeM0/AS1A07_138T08_9000004970_34697cztM0_level2_quad_clean.evt |
| Size (bytes) | 516,438,720 | 74,033,280 |
| Size | 492.5 MB | 70.6 MB |
| Events in quadrant A | 2,669,372 | 489,692 |
| Events in quadrant B | 4,328,686 | 464,505 |
| Events in quadrant C | 2,770,389 | 484,711 |
| Events in quadrant D | 5,520,721 | 439,260 |
| Mode M0 | |||
|---|---|---|---|
| Quadrant | BADHDUFLAG | Total packets | Discarded packets |
| A | 0 | 10936 | 2 |
| B | 0 | 16104 | 1 |
| C | 0 | 11157 | 1 |
| D | 0 | 19827 | 1 |
| Mode M9 | |||
|---|---|---|---|
| Quadrant | BADHDUFLAG | Total packets | Discarded packets |
| A | 0 | 27 | 0 |
| B | 0 | 27 | 0 |
| C | 0 | 27 | 0 |
| D | 0 | 28 | 0 |
| Mode SS | |||
|---|---|---|---|
| Quadrant | BADHDUFLAG | Total packets | Discarded packets |
| A | 0 | 104 | 0 |
| B | 0 | 104 | 0 |
| C | 0 | 104 | 0 |
| D | 0 | 104 | 0 |
| Quadrant | Total seconds | Saturated seconds | Saturation percentage |
|---|---|---|---|
| A | 5192 | 20 | 0.385208% |
| B | 5192 | 507 | 9.765023% |
| C | 5192 | 13 | 0.250385% |
| D | 5192 | 468 | 9.013867% |
Noise dominated data is calculated using 1-second bins in cleaned event files. If a bin has >2000 counts, and if more than 50% of those come from <1% of pixels, then it is considered to be noise-dominated and hence unusable.
| Quadrant | # 1 sec bins | Bins with >0 counts | Bins with >2000 counts | High rate bins dominated by noise | Noise dominated (total time) | Noise dominated (detector-on time) | Marked lightcurve |
|---|---|---|---|---|---|---|---|
| A | 7286 | 5193 | 10 | 10 | 0.14% | 0.19% | 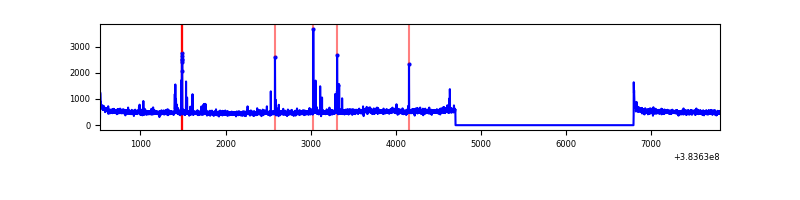 |
| B | 7286 | 5193 | 397 | 397 | 5.45% | 7.64% | 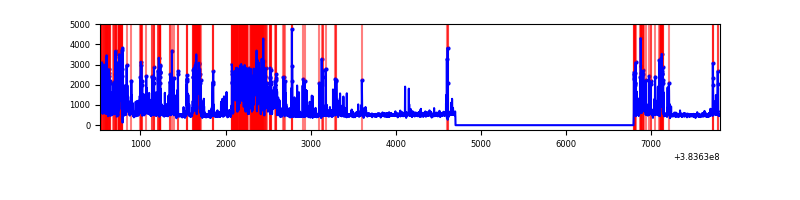 |
| C | 7286 | 5193 | 6 | 6 | 0.08% | 0.12% |  |
| D | 7286 | 5193 | 388 | 388 | 5.33% | 7.47% | 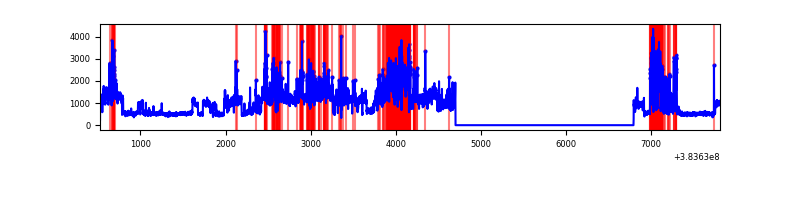 |
Top three noisy pixels from each quadrant. If the there are fewer than three noisy pixels in the level2.evt file, extra rows are filled as -1
| Pixel properties | Quadrant properties | ||||||
|---|---|---|---|---|---|---|---|
| Quadrant | DetID | PixID | Counts | Sigma | Mean | Median | Sigma |
| A | 10 | 83 | 47598 | 368.1 | 648 | 637 | 127.6 |
| A | 9 | 143 | 38451 | 296.4 | 648 | 637 | 127.6 |
| A | 14 | 250 | 27386 | 209.67 | 648 | 637 | 127.6 |
| B | 5 | 172 | 1500876 | 12917.3 | 619 | 605 | 116.1 |
| B | 5 | 255 | 275288 | 2365.01 | 619 | 605 | 116.1 |
| B | 0 | 190 | 65611 | 559.7 | 619 | 605 | 116.1 |
| C | 15 | 214 | 222592 | 1571.65 | 618 | 622 | 141.2 |
| C | 0 | 10 | 61833 | 433.4 | 618 | 622 | 141.2 |
| C | 14 | 67 | 46799 | 326.96 | 618 | 622 | 141.2 |
| D | 8 | 195 | 1819638 | 12493.59 | 599 | 584 | 145.6 |
| D | 2 | 250 | 400515 | 2746.8 | 599 | 584 | 145.6 |
| D | 12 | 238 | 378903 | 2598.36 | 599 | 584 | 145.6 |
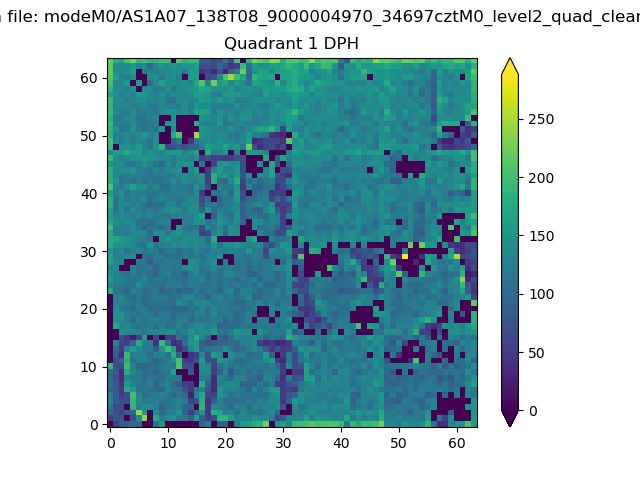
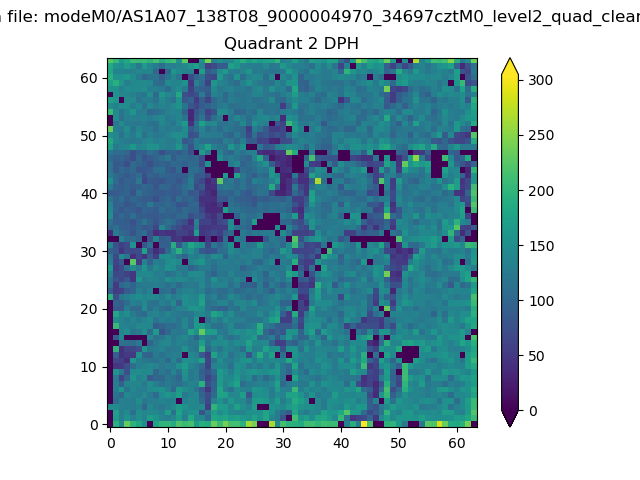
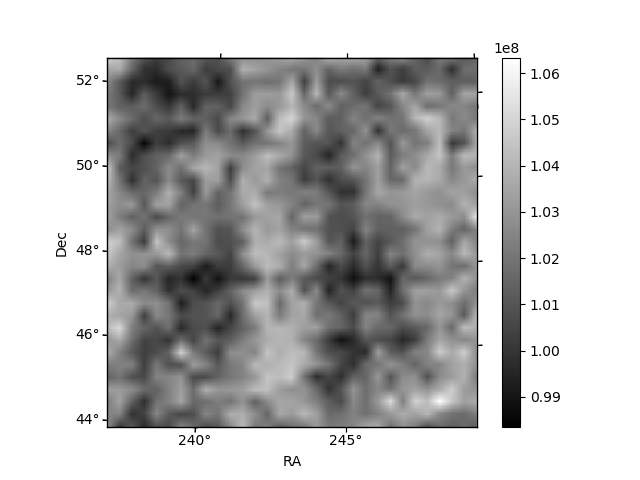
Histogram calculated using DETX and DETY for each event in the final _common_clean file
| Quadrant A | 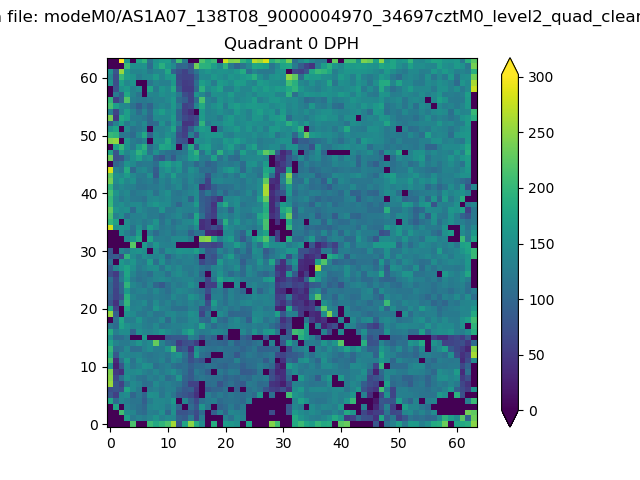 |
 |
Quadrant B |
|---|---|---|---|
| Quadrant D | 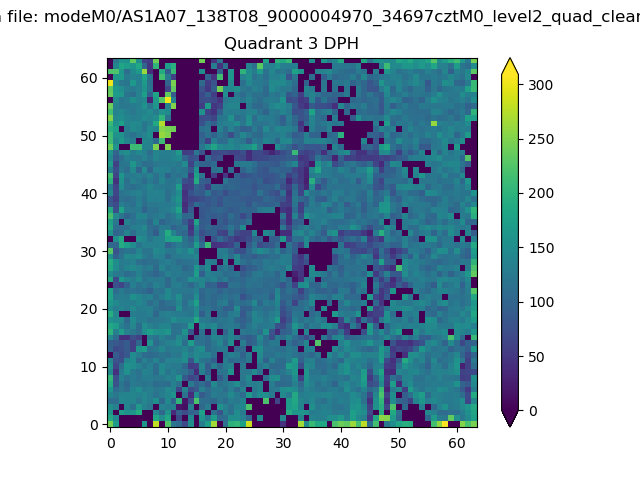 |
 |
Quadrant C |
| Plot type | Count rate plots | Images |
|---|---|---|
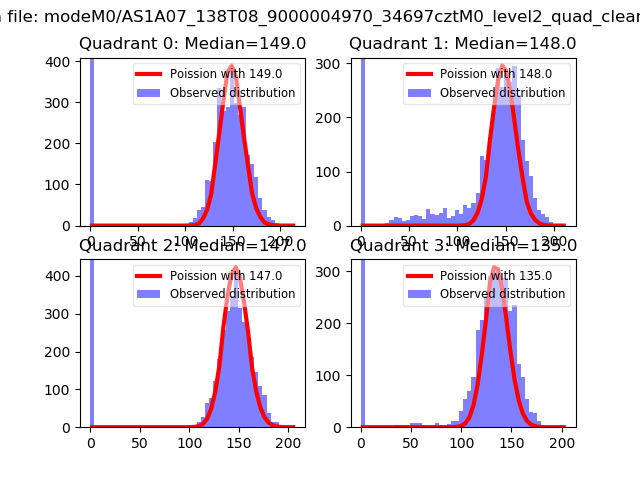
| Comparison with Poisson distribution Blue bars denote a histogram of data divided into 1 sec bins. Red curve is a Poisson curve with rate = median count rate of data. |
 |
 |
| Quadrant-wise count rates Data is divided into 100 sec bins |
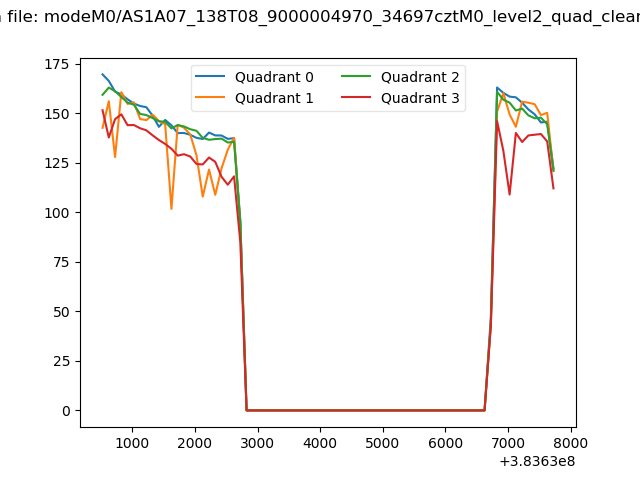 |
|
| Module-wise count rates for Quadrant A Data is divided into 100 sec bins |
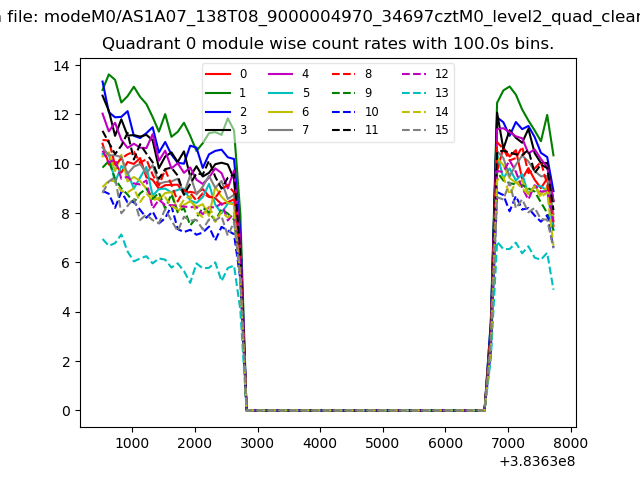 |
 |
| Module-wise count rates for Quadrant B Data is divided into 100 sec bins |
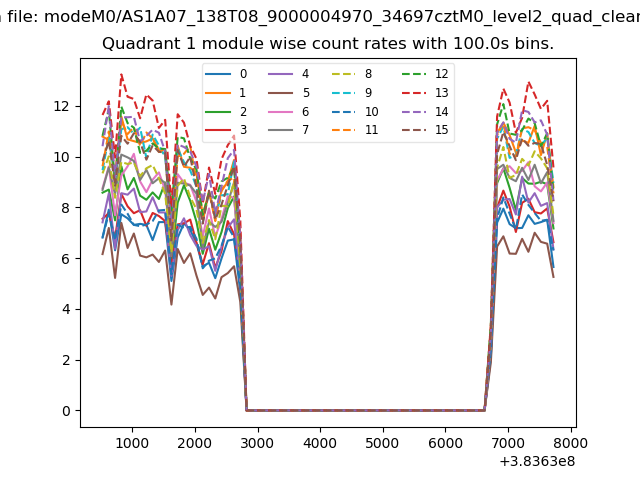 |
 |
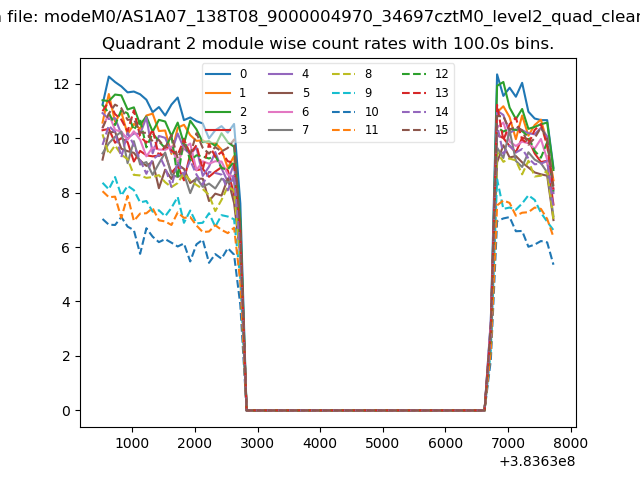
| Module-wise count rates for Quadrant C Data is divided into 100 sec bins |
 |
 |
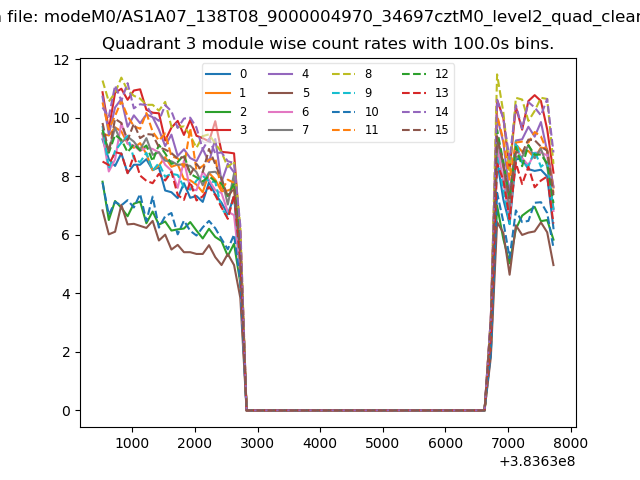
| Module-wise count rates for Quadrant D Data is divided into 100 sec bins |
 |
 |
| Parameter | Plot |
|---|---|
| CZT HV Monitor | 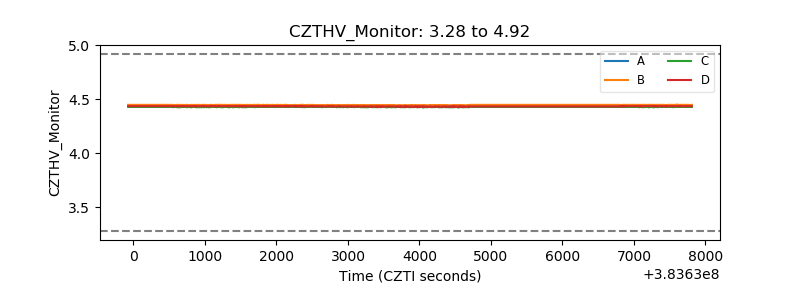 |
| D_VDD | 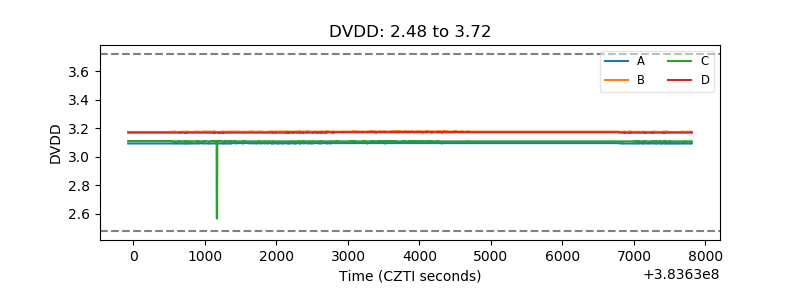 |
| Temperature 1 | 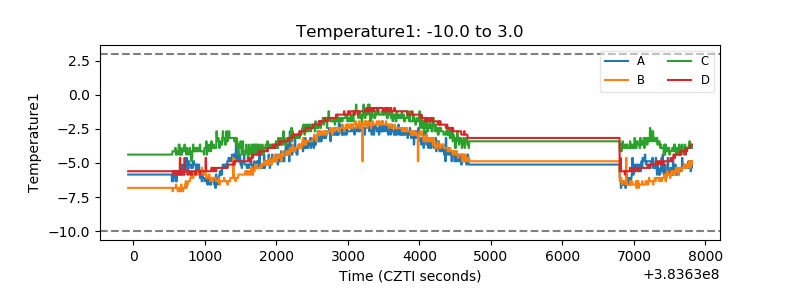 |
| Veto HV Monitor | 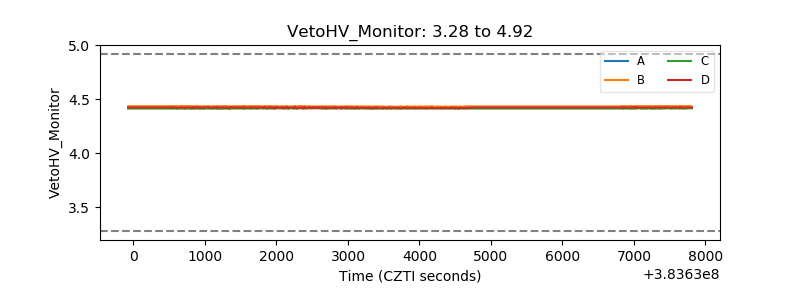 |
| Veto LLD | 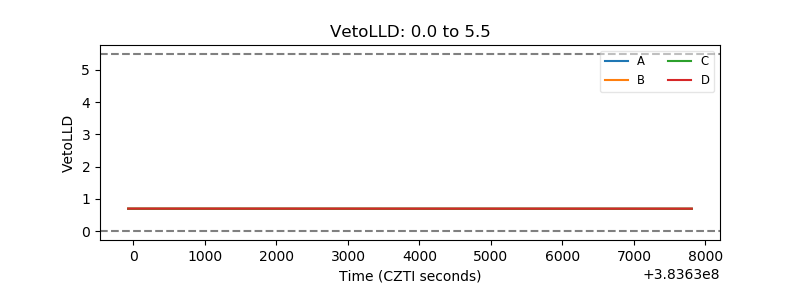 |
| Alpha Counter | 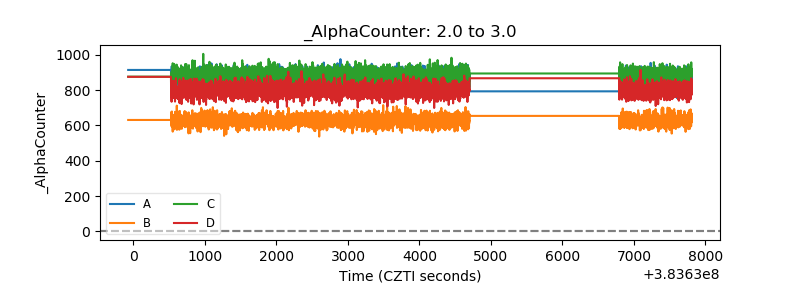 |
| _CPM_Rate | 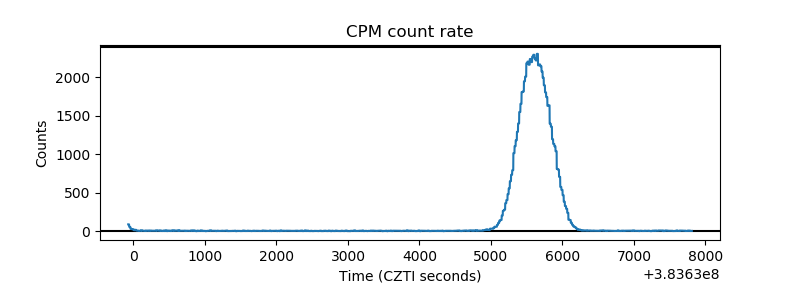 |
| CZT Counter |  |
| +2.5 Volts monitor |  |
| +5 Volts monitor |  |
| _ROLL_ROT | 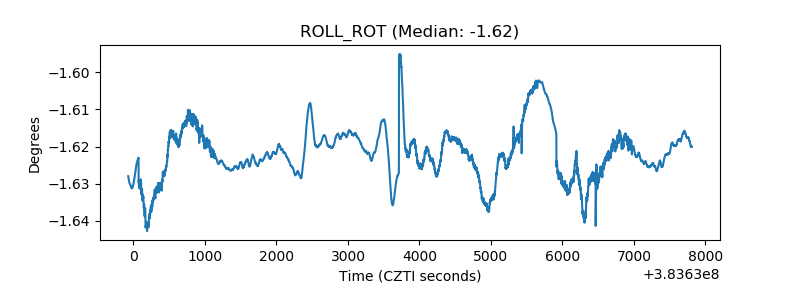 |
| _Roll_DEC | 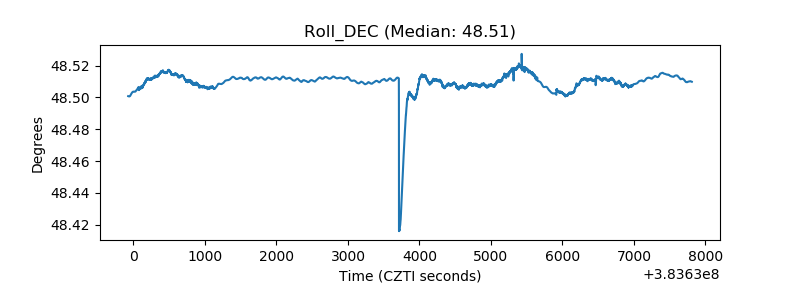 |
| _Roll_RA | 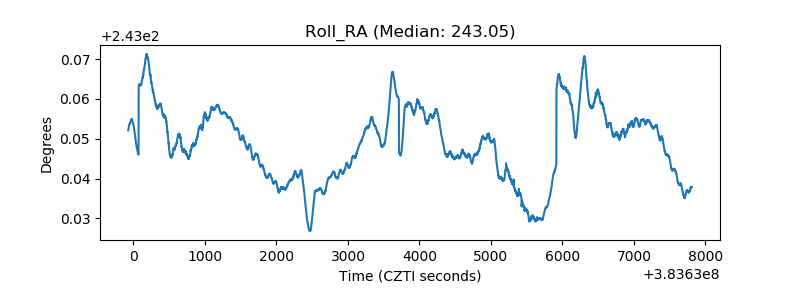 |
| Veto Counter | 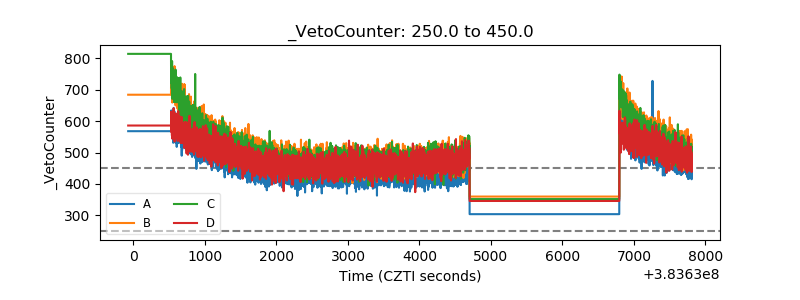 |