| Param | Original file | Final file |
|---|---|---|
| Filename | modeM0/AS1A09_038T30_9000004974cztM0_level2.fits | modeM0/AS1A09_038T30_9000004974cztM0_level2_quad_clean.evt |
| Size (bytes) | 34,968,960 | 24,194,880 |
| Size | 33.3 MB | 23.1 MB |
| Events in quadrant A | 197,588 | 92,694 |
| Events in quadrant B | 206,472 | 137,076 |
| Events in quadrant C | 210,378 | 129,169 |
| Events in quadrant D | 176,728 | 104,849 |
| Mode SS | |||
|---|---|---|---|
| Quadrant | BADHDUFLAG | Total packets | Discarded packets |
| A | 0 | 78 | 0 |
| B | 0 | 78 | 0 |
| C | 0 | 78 | 0 |
| D | 0 | 78 | 0 |
| Mode M0 | |||
|---|---|---|---|
| Quadrant | BADHDUFLAG | Total packets | Discarded packets |
| A | 0 | 11566 | 0 |
| B | 0 | 8738 | 0 |
| C | 0 | 7778 | 0 |
| D | 0 | 12112 | 0 |
| Mode M9 | |||
|---|---|---|---|
| Quadrant | BADHDUFLAG | Total packets | Discarded packets |
| A | 0 | 16 | 0 |
| B | 0 | 16 | 0 |
| C | 0 | 16 | 0 |
| D | 0 | 16 | 0 |
| Quadrant | Total seconds | Saturated seconds | Saturation percentage |
|---|---|---|---|
| A | 3787 | 504 | 13.308688% |
| B | 3787 | 42 | 1.109057% |
| C | 3787 | 12 | 0.316874% |
| D | 3787 | 228 | 6.020597% |
Noise dominated data is calculated using 1-second bins in cleaned event files. If a bin has >2000 counts, and if more than 50% of those come from <1% of pixels, then it is considered to be noise-dominated and hence unusable.
| Quadrant | # 1 sec bins | Bins with >0 counts | Bins with >2000 counts | High rate bins dominated by noise | Noise dominated (total time) | Noise dominated (detector-on time) | Marked lightcurve |
|---|---|---|---|---|---|---|---|
| A | 5341 | 3779 | 0 | 0 | 0.00% | 0.00% |  |
| B | 5341 | 3787 | 0 | 0 | 0.00% | 0.00% |  |
| C | 5341 | 3787 | 0 | 0 | 0.00% | 0.00% |  |
| D | 5341 | 3783 | 0 | 0 | 0.00% | 0.00% |  |
Top three noisy pixels from each quadrant. If the there are fewer than three noisy pixels in the level2.evt file, extra rows are filled as -1
| Pixel properties | Quadrant properties | ||||||
|---|---|---|---|---|---|---|---|
| Quadrant | DetID | PixID | Counts | Sigma | Mean | Median | Sigma |
| A | 9 | 19 | 168 | 8.19 | 51 | 48 | 14.7 |
| A | 0 | 29 | 157 | 7.44 | 51 | 48 | 14.7 |
| A | 14 | 79 | 149 | 6.89 | 51 | 48 | 14.7 |
| B | 3 | 80 | 173 | 9.51 | 54 | 52 | 12.7 |
| B | 2 | 9 | 160 | 8.48 | 54 | 52 | 12.7 |
| B | 5 | 128 | 151 | 7.78 | 54 | 52 | 12.7 |
| C | 3 | 187 | 162 | 7.0 | 55 | 52 | 15.7 |
| C | 7 | 233 | 159 | 6.81 | 55 | 52 | 15.7 |
| C | 1 | 81 | 155 | 6.56 | 55 | 52 | 15.7 |
| D | 7 | 4 | 138 | 6.23 | 50 | 46 | 14.8 |
| D | 7 | 3 | 138 | 6.23 | 50 | 46 | 14.8 |
| D | 15 | 63 | 130 | 5.69 | 50 | 46 | 14.8 |
Histogram calculated using DETX and DETY for each event in the final _common_clean file
| Quadrant A |  |
 |
Quadrant B |
|---|---|---|---|
| Quadrant D | 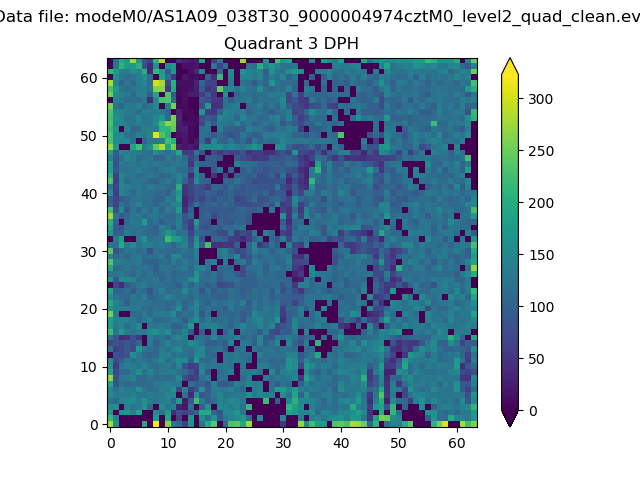 |
 |
Quadrant C |
| Plot type | Count rate plots | Images |
|---|---|---|
| Comparison with Poisson distribution Blue bars denote a histogram of data divided into 1 sec bins. Red curve is a Poisson curve with rate = median count rate of data. |
 |
 |
| Quadrant-wise count rates Data is divided into 100 sec bins |
 |
|
| Module-wise count rates for Quadrant A Data is divided into 100 sec bins |
 |
 |
| Module-wise count rates for Quadrant B Data is divided into 100 sec bins |
 |
 |
| Module-wise count rates for Quadrant C Data is divided into 100 sec bins |
 |
 |
| Module-wise count rates for Quadrant D Data is divided into 100 sec bins |
 |
 |
| Parameter | Plot |
|---|---|
| CZT HV Monitor |  |
| D_VDD | 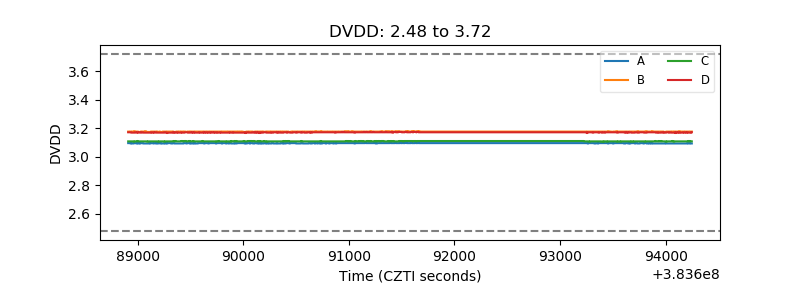 |
| Temperature 1 |  |
| Veto HV Monitor |  |
| Veto LLD | 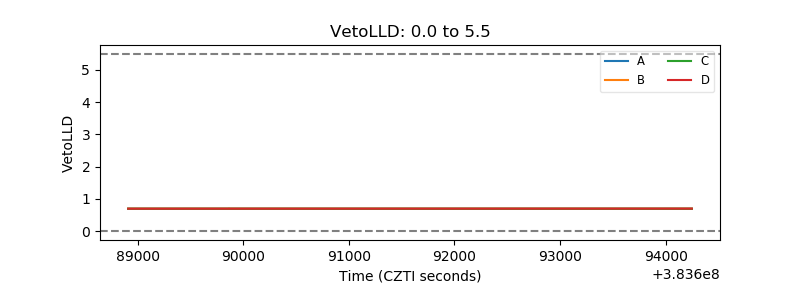 |
| Alpha Counter |  |
| _CPM_Rate |  |
| CZT Counter |  |
| +2.5 Volts monitor |  |
| +5 Volts monitor |  |
| _ROLL_ROT |  |
| _Roll_DEC |  |
| _Roll_RA |  |
| Veto Counter |  |