| Param | Original file | Final file |
|---|---|---|
| Filename | modeM0/AS1A09_038T36_9000004976cztM0_level2.fits | modeM0/AS1A09_038T36_9000004976cztM0_level2_quad_clean.evt |
| Size (bytes) | 206,838,720 | 179,706,240 |
| Size | 197.3 MB | 171.4 MB |
| Events in quadrant A | 1,235,644 | 921,401 |
| Events in quadrant B | 1,250,220 | 1,120,286 |
| Events in quadrant C | 1,295,502 | 1,082,066 |
| Events in quadrant D | 1,089,484 | 924,765 |
| Mode M9 | |||
|---|---|---|---|
| Quadrant | BADHDUFLAG | Total packets | Discarded packets |
| A | 0 | 75 | 0 |
| B | 0 | 75 | 0 |
| C | 0 | 75 | 0 |
| D | 0 | 75 | 0 |
| Mode M0 | |||
|---|---|---|---|
| Quadrant | BADHDUFLAG | Total packets | Discarded packets |
| A | 0 | 66900 | 0 |
| B | 0 | 46083 | 0 |
| C | 0 | 43831 | 0 |
| D | 0 | 71759 | 0 |
| Mode SS | |||
|---|---|---|---|
| Quadrant | BADHDUFLAG | Total packets | Discarded packets |
| A | 0 | 412 | 0 |
| B | 0 | 412 | 0 |
| C | 0 | 412 | 0 |
| D | 0 | 412 | 0 |
| Quadrant | Total seconds | Saturated seconds | Saturation percentage |
|---|---|---|---|
| A | 20219 | 2509 | 12.409120% |
| B | 20219 | 354 | 1.750828% |
| C | 20219 | 148 | 0.731985% |
| D | 20219 | 865 | 4.278154% |
Noise dominated data is calculated using 1-second bins in cleaned event files. If a bin has >2000 counts, and if more than 50% of those come from <1% of pixels, then it is considered to be noise-dominated and hence unusable.
| Quadrant | # 1 sec bins | Bins with >0 counts | Bins with >2000 counts | High rate bins dominated by noise | Noise dominated (total time) | Noise dominated (detector-on time) | Marked lightcurve |
|---|---|---|---|---|---|---|---|
| A | 27719 | 20217 | 0 | 0 | 0.00% | 0.00% |  |
| B | 27719 | 20218 | 0 | 0 | 0.00% | 0.00% |  |
| C | 27719 | 20219 | 0 | 0 | 0.00% | 0.00% |  |
| D | 27719 | 20217 | 0 | 0 | 0.00% | 0.00% |  |
Top three noisy pixels from each quadrant. If the there are fewer than three noisy pixels in the level2.evt file, extra rows are filled as -1
| Pixel properties | Quadrant properties | ||||||
|---|---|---|---|---|---|---|---|
| Quadrant | DetID | PixID | Counts | Sigma | Mean | Median | Sigma |
| A | 9 | 19 | 1024 | 9.02 | 323 | 306 | 79.6 |
| A | 7 | 110 | 998 | 8.69 | 323 | 306 | 79.6 |
| A | 0 | 29 | 914 | 7.64 | 323 | 306 | 79.6 |
| B | 2 | 9 | 1056 | 11.18 | 332 | 320 | 65.8 |
| B | 3 | 80 | 1012 | 10.51 | 332 | 320 | 65.8 |
| B | 5 | 128 | 875 | 8.43 | 332 | 320 | 65.8 |
| C | 1 | 81 | 1120 | 9.17 | 342 | 326 | 86.6 |
| C | 1 | 80 | 1104 | 8.98 | 342 | 326 | 86.6 |
| C | 3 | 202 | 1071 | 8.6 | 342 | 326 | 86.6 |
| D | 6 | 38 | 814 | 6.39 | 312 | 286 | 82.6 |
| D | 11 | 66 | 805 | 6.28 | 312 | 286 | 82.6 |
| D | 10 | 189 | 803 | 6.26 | 312 | 286 | 82.6 |
Histogram calculated using DETX and DETY for each event in the final _common_clean file
| Quadrant A | 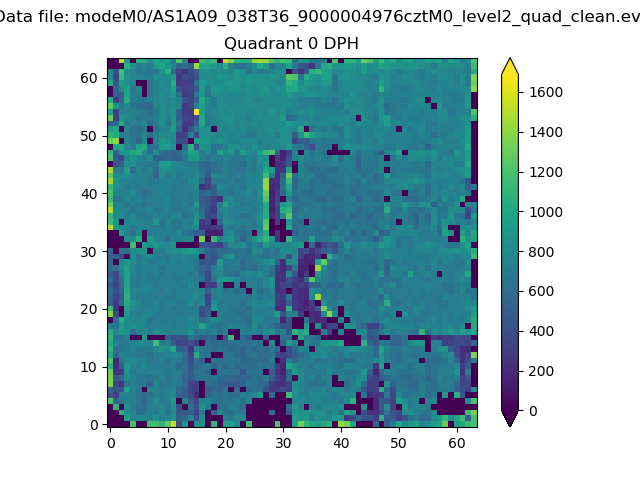 |
 |
Quadrant B |
|---|---|---|---|
| Quadrant D | 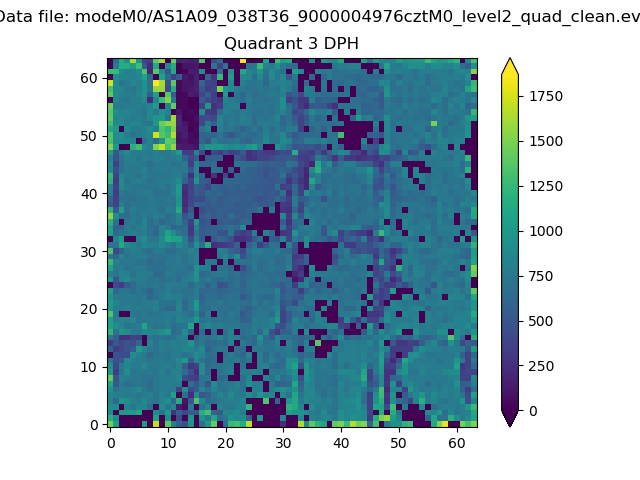 |
 |
Quadrant C |
| Plot type | Count rate plots | Images |
|---|---|---|
| Comparison with Poisson distribution Blue bars denote a histogram of data divided into 1 sec bins. Red curve is a Poisson curve with rate = median count rate of data. |
 |
 |
| Quadrant-wise count rates Data is divided into 100 sec bins |
 |
|
| Module-wise count rates for Quadrant A Data is divided into 100 sec bins |
 |
 |
| Module-wise count rates for Quadrant B Data is divided into 100 sec bins |
 |
 |
| Module-wise count rates for Quadrant C Data is divided into 100 sec bins |
 |
 |
| Module-wise count rates for Quadrant D Data is divided into 100 sec bins |
 |
 |
| Parameter | Plot |
|---|---|
| CZT HV Monitor |  |
| D_VDD |  |
| Temperature 1 |  |
| Veto HV Monitor | 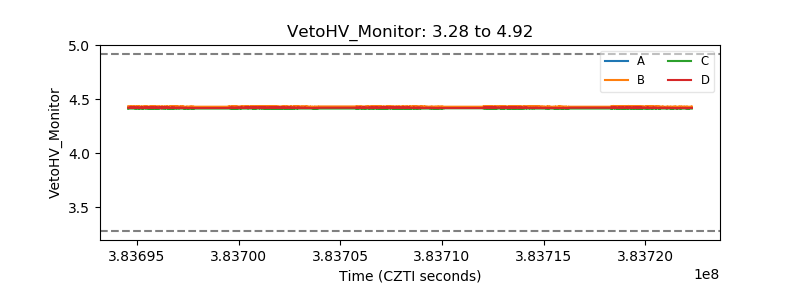 |
| Veto LLD |  |
| Alpha Counter |  |
| _CPM_Rate |  |
| CZT Counter |  |
| +2.5 Volts monitor |  |
| +5 Volts monitor |  |
| _ROLL_ROT |  |
| _Roll_DEC |  |
| _Roll_RA |  |
| Veto Counter |  |