| Param | Original file | Final file |
|---|---|---|
| Filename | modeM0/AS1A09_038T36_9000004976_34710cztM0_level2.evt | modeM0/AS1A09_038T36_9000004976_34710cztM0_level2_quad_clean.evt |
| Size (bytes) | 554,005,440 | 114,048,000 |
| Size | 528.3 MB | 108.8 MB |
| Events in quadrant A | 5,900,606 | 722,803 |
| Events in quadrant B | 2,908,502 | 816,273 |
| Events in quadrant C | 3,103,758 | 796,714 |
| Events in quadrant D | 4,502,001 | 742,247 |
| Mode M9 | |||
|---|---|---|---|
| Quadrant | BADHDUFLAG | Total packets | Discarded packets |
| A | 0 | 27 | 0 |
| B | 0 | 27 | 0 |
| C | 0 | 27 | 0 |
| D | 0 | 28 | 0 |
| Mode M0 | |||
|---|---|---|---|
| Quadrant | BADHDUFLAG | Total packets | Discarded packets |
| A | 0 | 20983 | 3 |
| B | 0 | 11802 | 2 |
| C | 0 | 12221 | 2 |
| D | 0 | 17028 | 2 |
| Mode SS | |||
|---|---|---|---|
| Quadrant | BADHDUFLAG | Total packets | Discarded packets |
| A | 0 | 108 | 0 |
| B | 0 | 108 | 0 |
| C | 0 | 108 | 0 |
| D | 0 | 108 | 0 |
| Quadrant | Total seconds | Saturated seconds | Saturation percentage |
|---|---|---|---|
| A | 5369 | 1389 | 25.870739% |
| B | 5369 | 34 | 0.633265% |
| C | 5369 | 89 | 1.657664% |
| D | 5369 | 138 | 2.570311% |
Noise dominated data is calculated using 1-second bins in cleaned event files. If a bin has >2000 counts, and if more than 50% of those come from <1% of pixels, then it is considered to be noise-dominated and hence unusable.
| Quadrant | # 1 sec bins | Bins with >0 counts | Bins with >2000 counts | High rate bins dominated by noise | Noise dominated (total time) | Noise dominated (detector-on time) | Marked lightcurve |
|---|---|---|---|---|---|---|---|
| A | 7311 | 5370 | 1163 | 1163 | 15.91% | 21.66% | 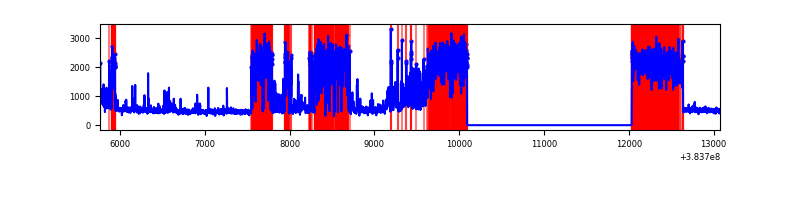 |
| B | 7311 | 5370 | 11 | 11 | 0.15% | 0.20% |  |
| C | 7311 | 5370 | 62 | 62 | 0.85% | 1.15% | 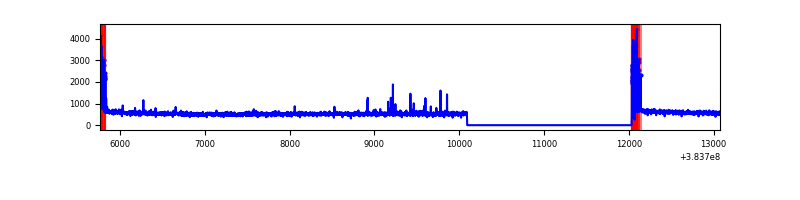 |
| D | 7311 | 5370 | 101 | 101 | 1.38% | 1.88% | 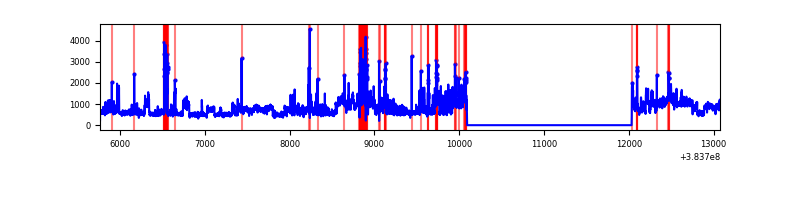 |
Top three noisy pixels from each quadrant. If the there are fewer than three noisy pixels in the level2.evt file, extra rows are filled as -1
| Pixel properties | Quadrant properties | ||||||
|---|---|---|---|---|---|---|---|
| Quadrant | DetID | PixID | Counts | Sigma | Mean | Median | Sigma |
| A | 15 | 169 | 3256422 | 26139.11 | 628 | 618 | 124.6 |
| A | 7 | 16 | 105121 | 839.0 | 628 | 618 | 124.6 |
| A | 9 | 143 | 50590 | 401.2 | 628 | 618 | 124.6 |
| B | 0 | 189 | 56689 | 448.05 | 675 | 659 | 125.1 |
| B | 5 | 172 | 53643 | 423.69 | 675 | 659 | 125.1 |
| B | 4 | 171 | 47847 | 377.35 | 675 | 659 | 125.1 |
| C | 0 | 10 | 231814 | 1530.33 | 666 | 672 | 151.0 |
| C | 15 | 214 | 228408 | 1507.78 | 666 | 672 | 151.0 |
| C | 15 | 159 | 16416 | 104.24 | 666 | 672 | 151.0 |
| D | 8 | 195 | 1128410 | 6404.94 | 654 | 641 | 176.1 |
| D | 7 | 38 | 176752 | 1000.19 | 654 | 641 | 176.1 |
| D | 13 | 249 | 176658 | 999.65 | 654 | 641 | 176.1 |
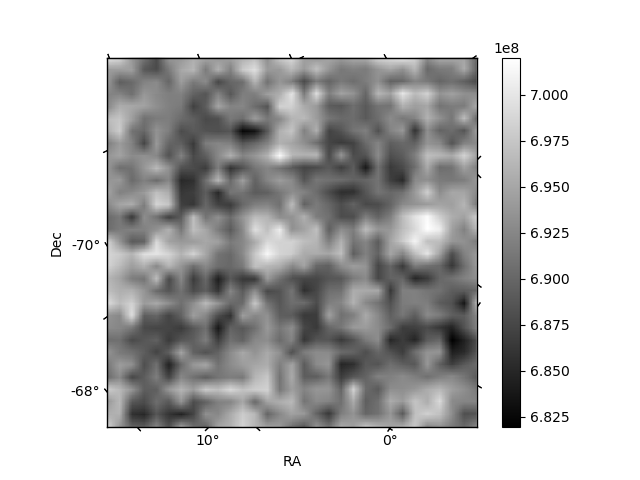
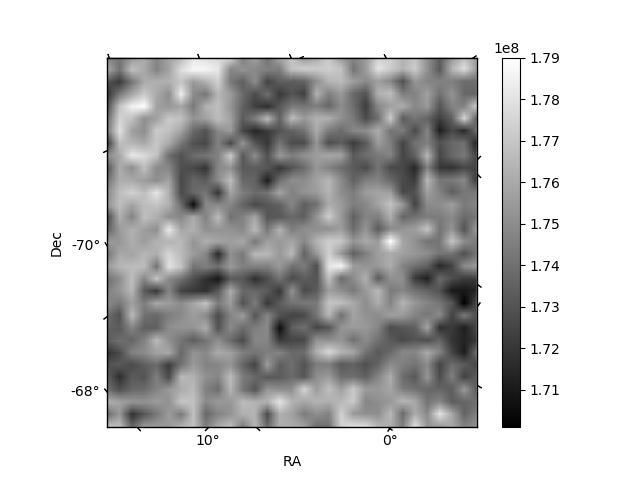
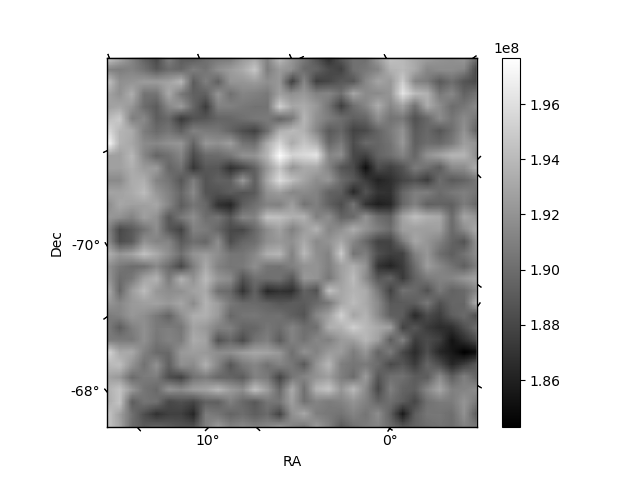
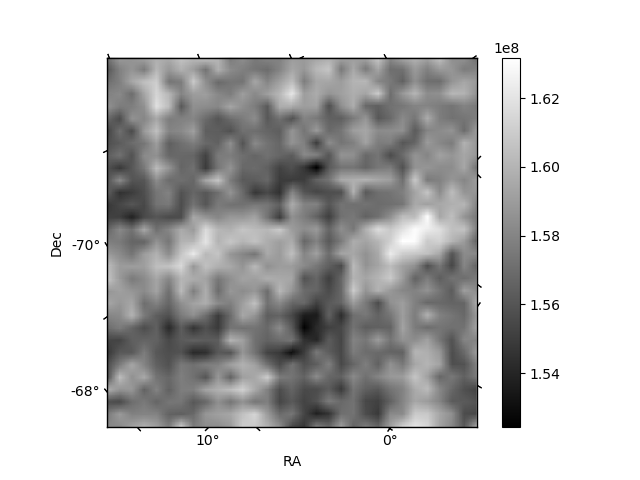
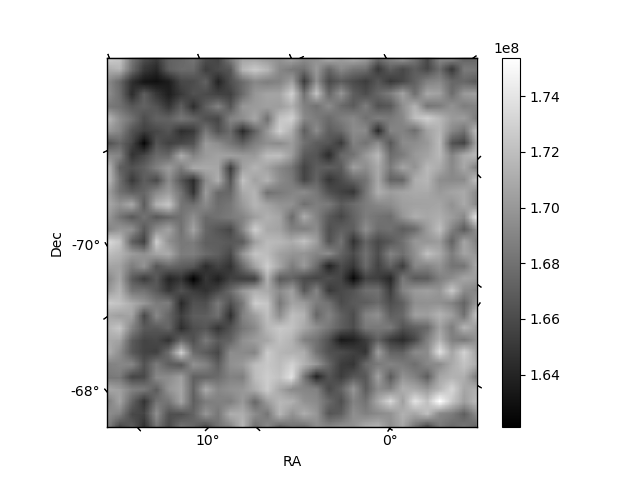
Histogram calculated using DETX and DETY for each event in the final _common_clean file
| Quadrant A | 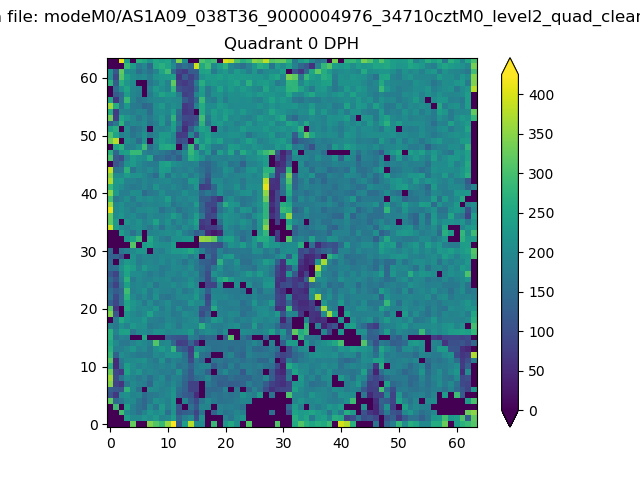 |
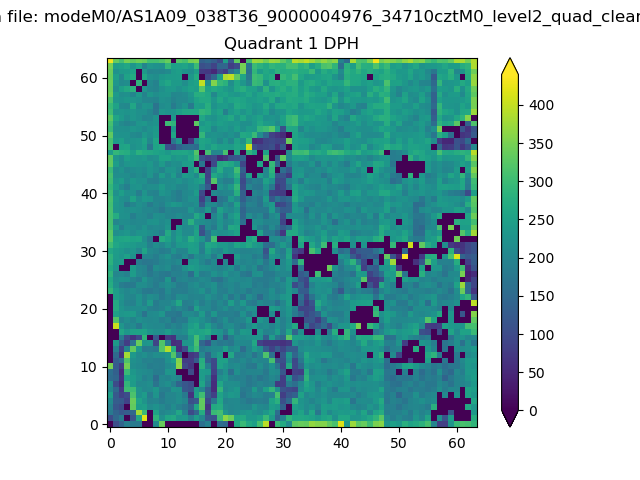 |
Quadrant B |
|---|---|---|---|
| Quadrant D | 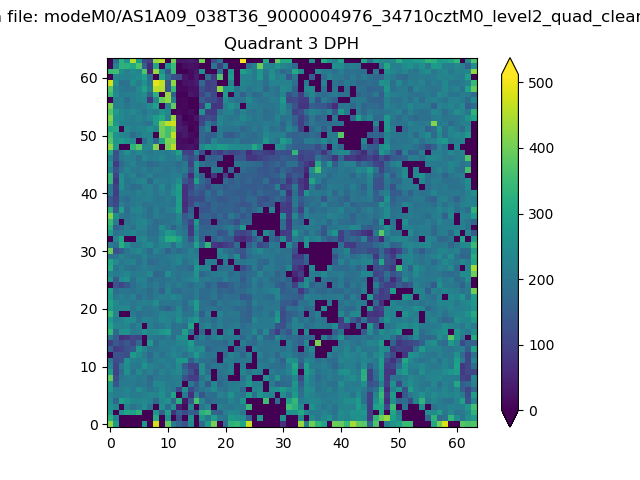 |
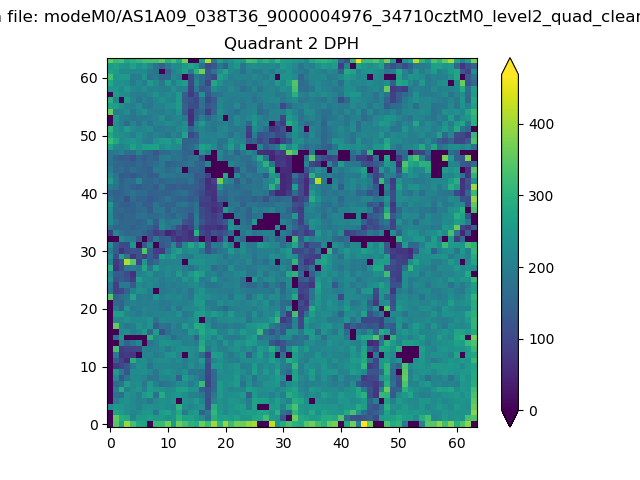 |
Quadrant C |
| Plot type | Count rate plots | Images |
|---|---|---|
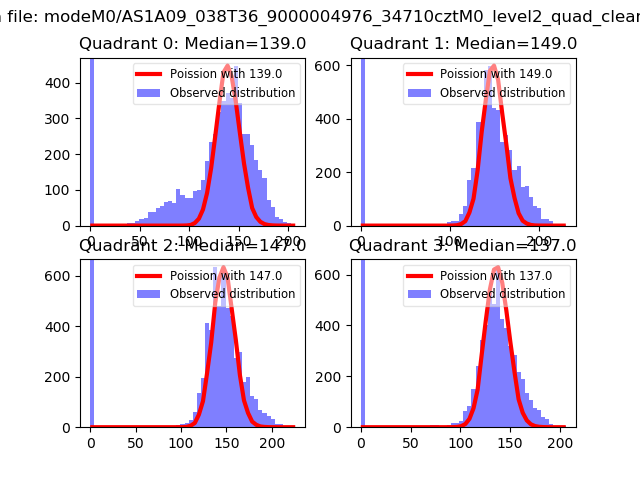
| Comparison with Poisson distribution Blue bars denote a histogram of data divided into 1 sec bins. Red curve is a Poisson curve with rate = median count rate of data. |
 |
 |
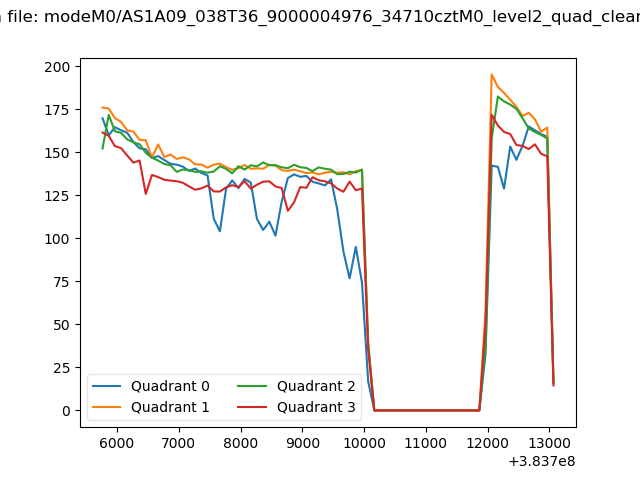
| Quadrant-wise count rates Data is divided into 100 sec bins |
 |
|
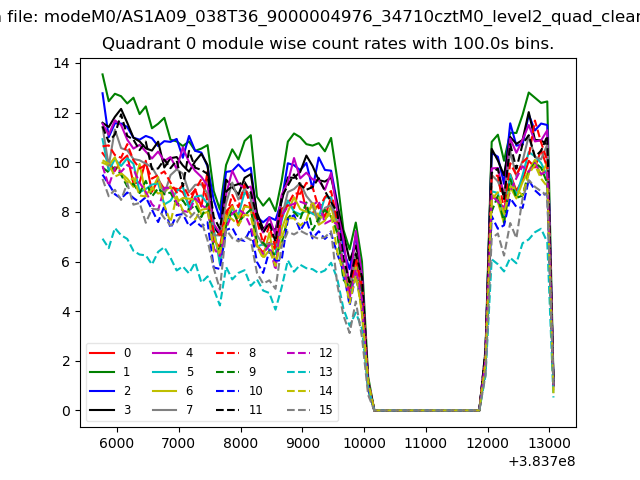
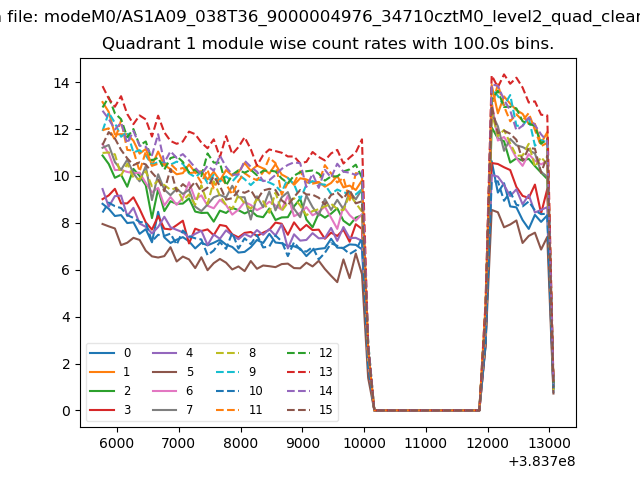
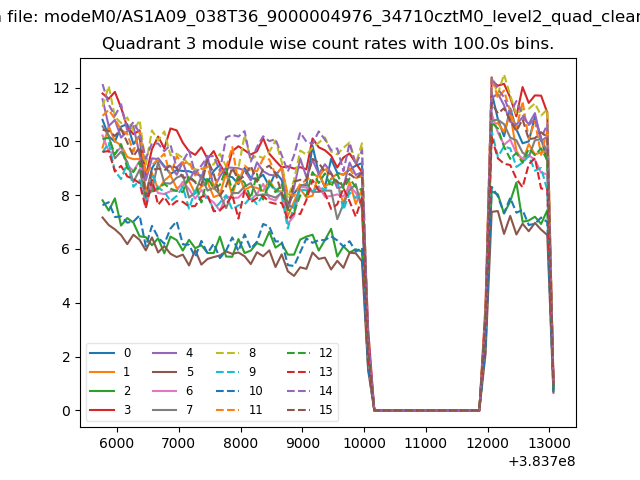
| Module-wise count rates for Quadrant A Data is divided into 100 sec bins |
 |
 |
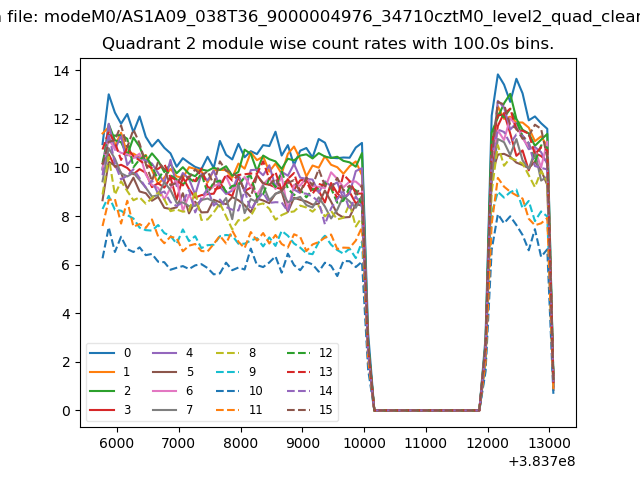
| Module-wise count rates for Quadrant B Data is divided into 100 sec bins |
 |
 |
| Module-wise count rates for Quadrant C Data is divided into 100 sec bins |
 |
 |
| Module-wise count rates for Quadrant D Data is divided into 100 sec bins |
 |
 |
| Parameter | Plot |
|---|---|
| CZT HV Monitor | 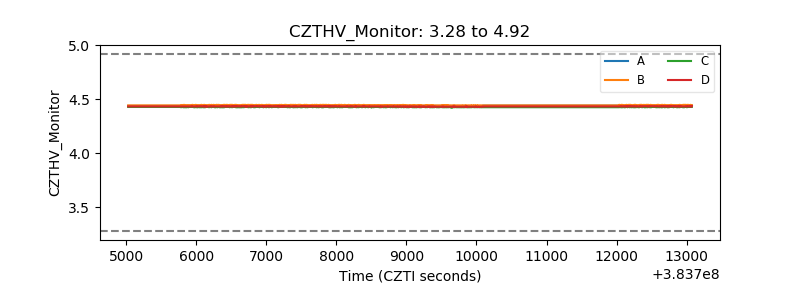 |
| D_VDD | 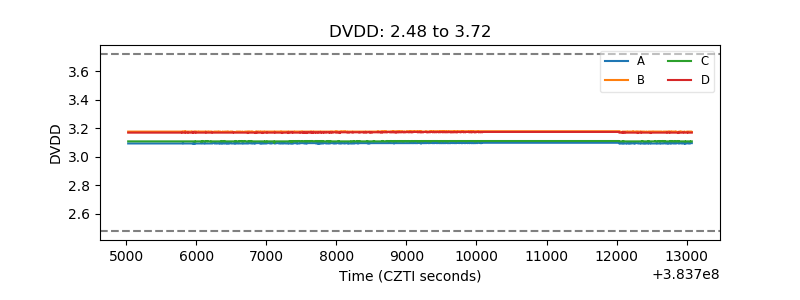 |
| Temperature 1 | 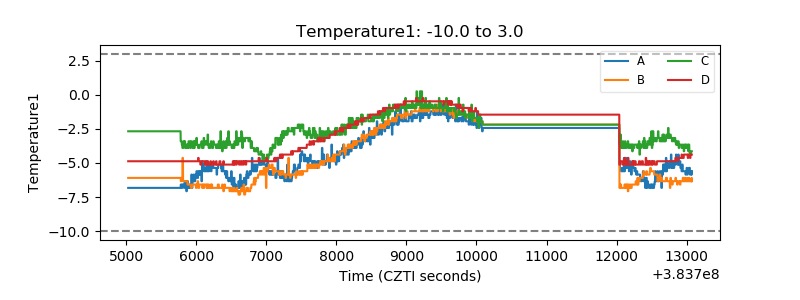 |
| Veto HV Monitor | 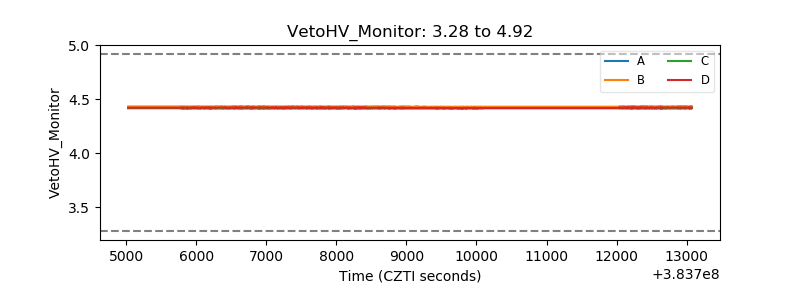 |
| Veto LLD | 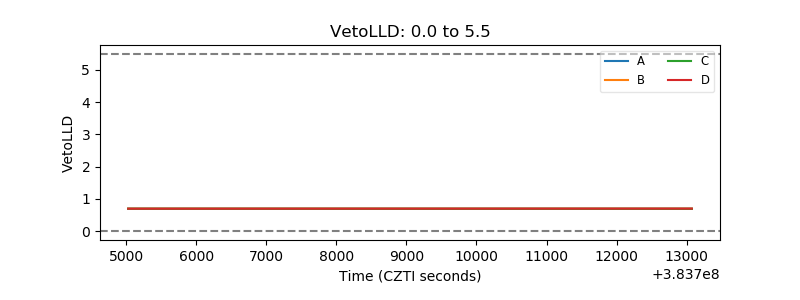 |
| Alpha Counter | 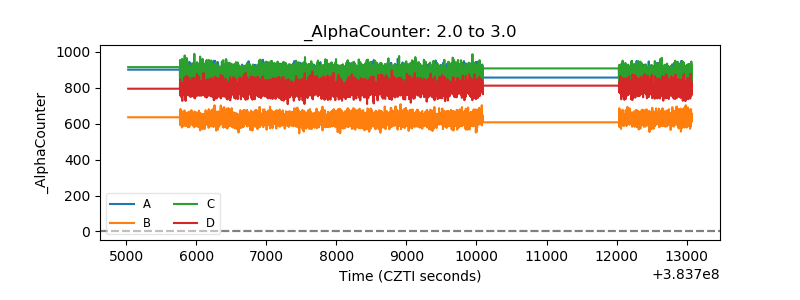 |
| _CPM_Rate | 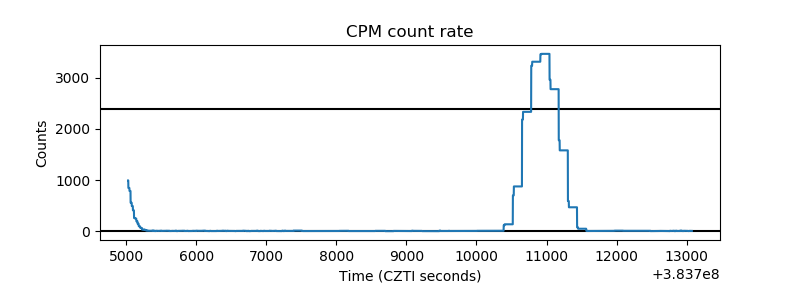 |
| CZT Counter | 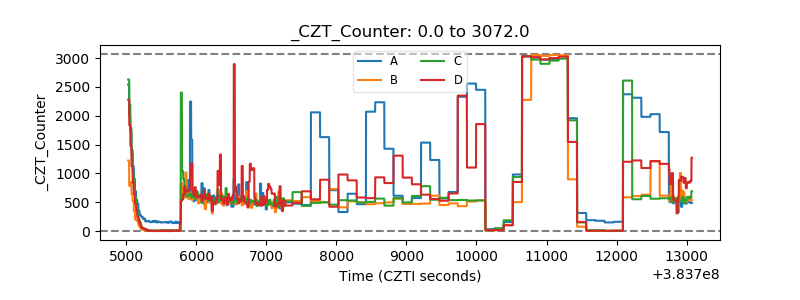 |
| +2.5 Volts monitor |  |
| +5 Volts monitor | 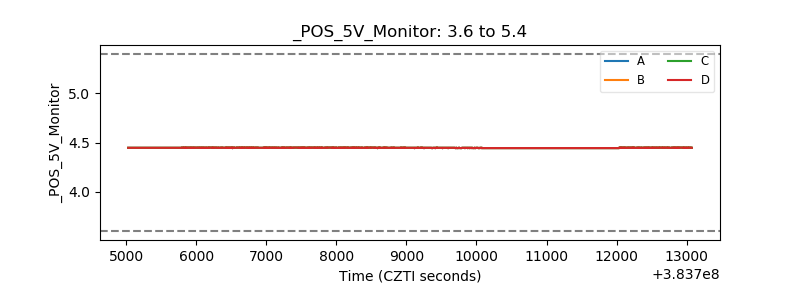 |
| _ROLL_ROT | 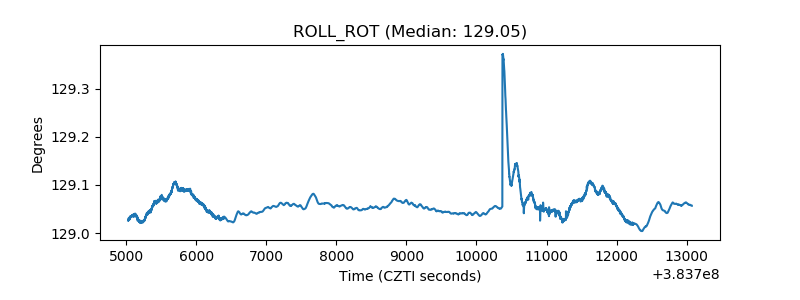 |
| _Roll_DEC | 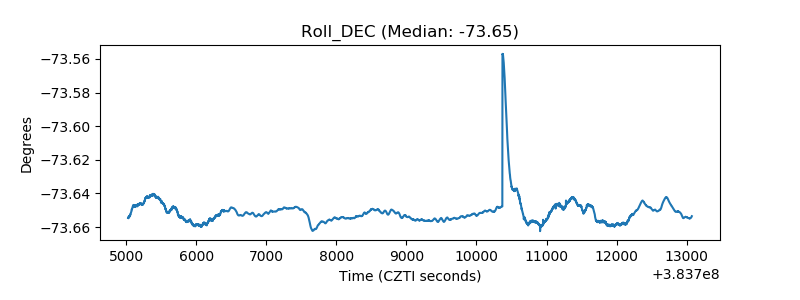 |
| _Roll_RA | 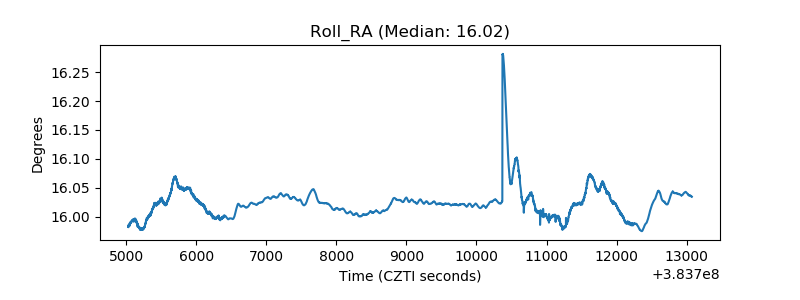 |
| Veto Counter | 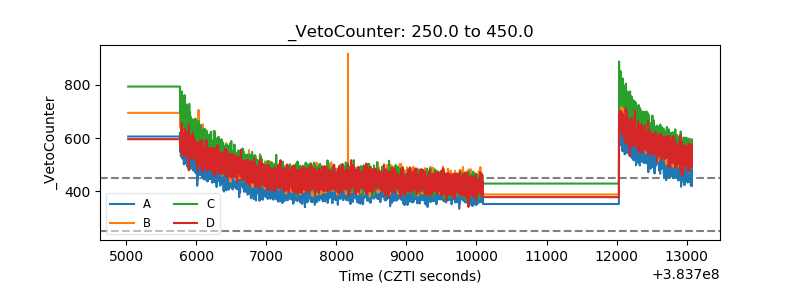 |