| Param | Original file | Final file |
|---|---|---|
| Filename | modeM0/AS1A11_069T01_9000004972cztM0_level2.fits | modeM0/AS1A11_069T01_9000004972cztM0_level2_quad_clean.evt |
| Size (bytes) | 147,260,160 | 158,624,640 |
| Size | 140.4 MB | 151.3 MB |
| Events in quadrant A | 857,114 | 933,555 |
| Events in quadrant B | 849,860 | 974,201 |
| Events in quadrant C | 875,906 | 934,367 |
| Events in quadrant D | 751,066 | 836,494 |
| Mode M9 | |||
|---|---|---|---|
| Quadrant | BADHDUFLAG | Total packets | Discarded packets |
| A | 0 | 52 | 0 |
| B | 0 | 52 | 0 |
| C | 0 | 52 | 0 |
| D | 0 | 53 | 0 |
| Mode SS | |||
|---|---|---|---|
| Quadrant | BADHDUFLAG | Total packets | Discarded packets |
| A | 0 | 334 | 0 |
| B | 0 | 334 | 0 |
| C | 0 | 334 | 0 |
| D | 0 | 334 | 0 |
| Mode M0 | |||
|---|---|---|---|
| Quadrant | BADHDUFLAG | Total packets | Discarded packets |
| A | 0 | 53370 | 0 |
| B | 0 | 38402 | 0 |
| C | 0 | 34248 | 0 |
| D | 0 | 53047 | 0 |
| Quadrant | Total seconds | Saturated seconds | Saturation percentage |
|---|---|---|---|
| A | 16304 | 1699 | 10.420756% |
| B | 16304 | 557 | 3.416340% |
| C | 16304 | 123 | 0.754416% |
| D | 16304 | 419 | 2.569921% |
Noise dominated data is calculated using 1-second bins in cleaned event files. If a bin has >2000 counts, and if more than 50% of those come from <1% of pixels, then it is considered to be noise-dominated and hence unusable.
| Quadrant | # 1 sec bins | Bins with >0 counts | Bins with >2000 counts | High rate bins dominated by noise | Noise dominated (total time) | Noise dominated (detector-on time) | Marked lightcurve |
|---|---|---|---|---|---|---|---|
| A | 25772 | 16303 | 0 | 0 | 0.00% | 0.00% |  |
| B | 25772 | 16303 | 0 | 0 | 0.00% | 0.00% |  |
| C | 25772 | 16302 | 0 | 0 | 0.00% | 0.00% | 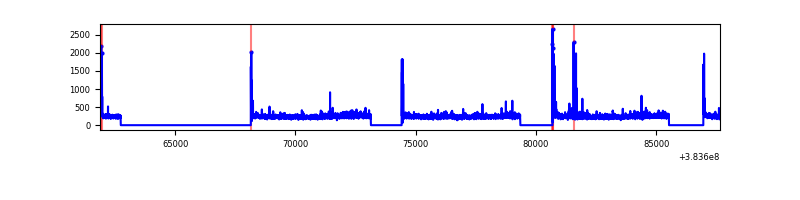 |
| D | 25772 | 16298 | 0 | 0 | 0.00% | 0.00% | 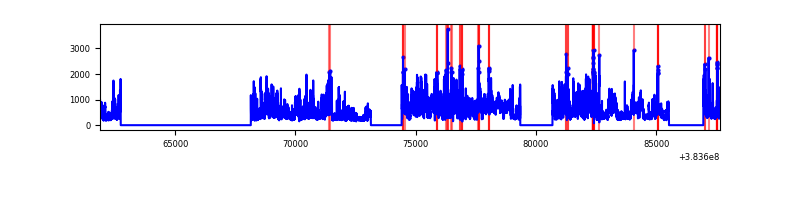 |
Top three noisy pixels from each quadrant. If the there are fewer than three noisy pixels in the level2.evt file, extra rows are filled as -1
| Pixel properties | Quadrant properties | ||||||
|---|---|---|---|---|---|---|---|
| Quadrant | DetID | PixID | Counts | Sigma | Mean | Median | Sigma |
| A | 9 | 19 | 732 | 9.16 | 223 | 209 | 57.1 |
| A | 0 | 29 | 732 | 9.16 | 223 | 209 | 57.1 |
| A | 7 | 110 | 708 | 8.74 | 223 | 209 | 57.1 |
| B | 2 | 9 | 700 | 10.29 | 225 | 214 | 47.2 |
| B | 3 | 80 | 628 | 8.77 | 225 | 214 | 47.2 |
| B | 3 | 17 | 619 | 8.58 | 225 | 214 | 47.2 |
| C | 1 | 80 | 745 | 8.77 | 231 | 216 | 60.3 |
| C | 1 | 81 | 724 | 8.42 | 231 | 216 | 60.3 |
| C | 9 | 188 | 599 | 6.35 | 231 | 216 | 60.3 |
| D | 10 | 189 | 622 | 7.22 | 214 | 196 | 59.0 |
| D | 7 | 3 | 561 | 6.18 | 214 | 196 | 59.0 |
| D | 6 | 231 | 544 | 5.89 | 214 | 196 | 59.0 |
Histogram calculated using DETX and DETY for each event in the final _common_clean file
| Quadrant A |  |
 |
Quadrant B |
|---|---|---|---|
| Quadrant D | 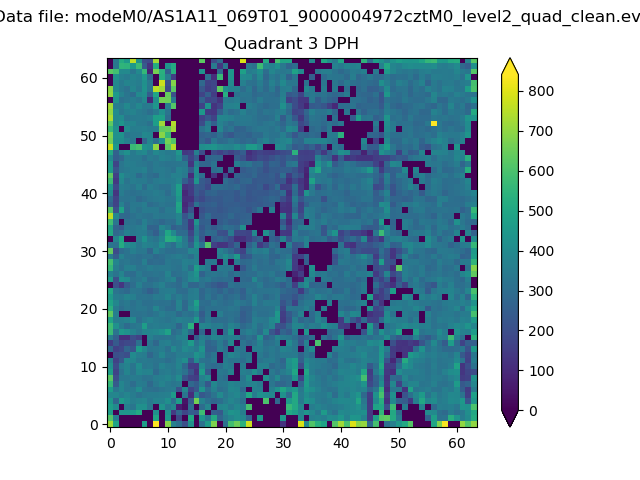 |
 |
Quadrant C |
| Plot type | Count rate plots | Images |
|---|---|---|
| Comparison with Poisson distribution Blue bars denote a histogram of data divided into 1 sec bins. Red curve is a Poisson curve with rate = median count rate of data. |
 |
 |
| Quadrant-wise count rates Data is divided into 100 sec bins |
 |
|
| Module-wise count rates for Quadrant A Data is divided into 100 sec bins |
 |
 |
| Module-wise count rates for Quadrant B Data is divided into 100 sec bins |
 |
 |
| Module-wise count rates for Quadrant C Data is divided into 100 sec bins |
 |
 |
| Module-wise count rates for Quadrant D Data is divided into 100 sec bins |
 |
 |
| Parameter | Plot |
|---|---|
| CZT HV Monitor |  |
| D_VDD | 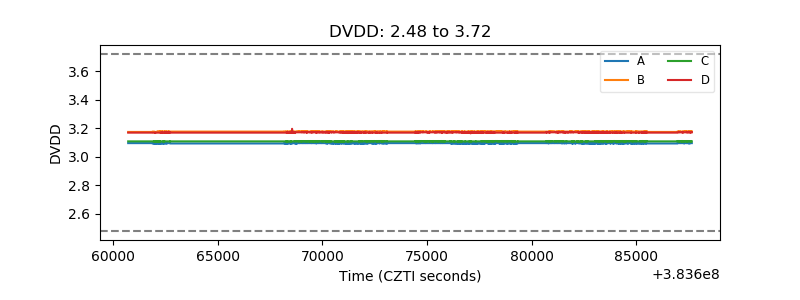 |
| Temperature 1 |  |
| Veto HV Monitor |  |
| Veto LLD |  |
| Alpha Counter |  |
| _CPM_Rate |  |
| CZT Counter |  |
| +2.5 Volts monitor |  |
| +5 Volts monitor | 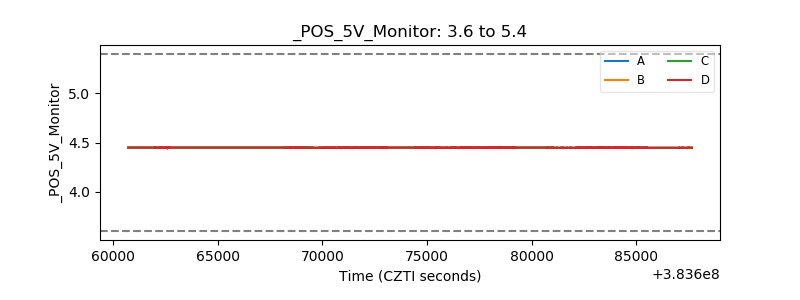 |
| _ROLL_ROT |  |
| _Roll_DEC |  |
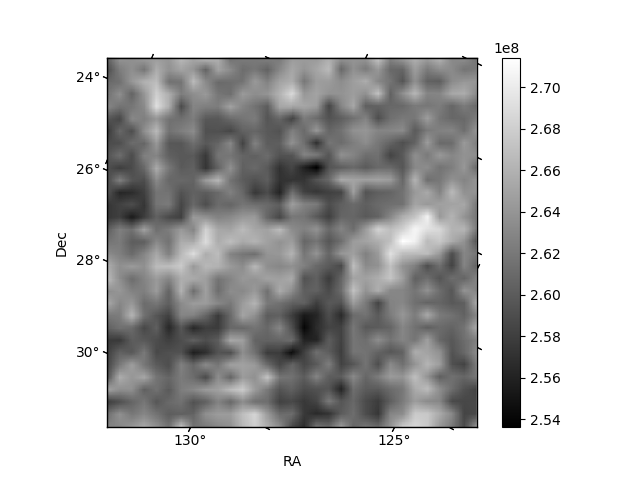
| _Roll_RA |  |
| Veto Counter |  |