| Param | Original file | Final file |
|---|---|---|
| Filename | modeM0/AS1C07_001T01_9000004982cztM0_level2.fits | modeM0/AS1C07_001T01_9000004982cztM0_level2_quad_clean.evt |
| Size (bytes) | 758,292,480 | 966,067,200 |
| Size | 723.2 MB | 921.3 MB |
| Events in quadrant A | 4,602,584 | 6,198,306 |
| Events in quadrant B | 4,454,600 | 6,231,435 |
| Events in quadrant C | 4,560,268 | 6,102,224 |
| Events in quadrant D | 3,752,570 | 5,136,263 |
| Mode M0 | |||
|---|---|---|---|
| Quadrant | BADHDUFLAG | Total packets | Discarded packets |
| A | 0 | 200486 | 0 |
| B | 0 | 179850 | 0 |
| C | 0 | 171655 | 0 |
| D | 0 | 298108 | 0 |
| Mode SS | |||
|---|---|---|---|
| Quadrant | BADHDUFLAG | Total packets | Discarded packets |
| A | 0 | 1660 | 0 |
| B | 0 | 1660 | 0 |
| C | 0 | 1660 | 0 |
| D | 0 | 1660 | 0 |
| Mode M9 | |||
|---|---|---|---|
| Quadrant | BADHDUFLAG | Total packets | Discarded packets |
| A | 0 | 301 | 0 |
| B | 0 | 301 | 0 |
| C | 0 | 301 | 0 |
| D | 0 | 301 | 0 |
| Quadrant | Total seconds | Saturated seconds | Saturation percentage |
|---|---|---|---|
| A | 81581 | 2033 | 2.492002% |
| B | 81581 | 1162 | 1.424351% |
| C | 81581 | 511 | 0.626371% |
| D | 81581 | 7016 | 8.600042% |
Noise dominated data is calculated using 1-second bins in cleaned event files. If a bin has >2000 counts, and if more than 50% of those come from <1% of pixels, then it is considered to be noise-dominated and hence unusable.
| Quadrant | # 1 sec bins | Bins with >0 counts | Bins with >2000 counts | High rate bins dominated by noise | Noise dominated (total time) | Noise dominated (detector-on time) | Marked lightcurve |
|---|---|---|---|---|---|---|---|
| A | 111306 | 81579 | 0 | 0 | 0.00% | 0.00% |  |
| B | 111306 | 81578 | 0 | 0 | 0.00% | 0.00% |  |
| C | 111306 | 81577 | 0 | 0 | 0.00% | 0.00% |  |
| D | 111306 | 81547 | 0 | 0 | 0.00% | 0.00% |  |
Top three noisy pixels from each quadrant. If the there are fewer than three noisy pixels in the level2.evt file, extra rows are filled as -1
| Pixel properties | Quadrant properties | ||||||
|---|---|---|---|---|---|---|---|
| Quadrant | DetID | PixID | Counts | Sigma | Mean | Median | Sigma |
| A | 9 | 19 | 3853 | 9.28 | 1203 | 1136 | 292.8 |
| A | 0 | 29 | 3720 | 8.83 | 1203 | 1136 | 292.8 |
| A | 7 | 110 | 3719 | 8.82 | 1203 | 1136 | 292.8 |
| B | 2 | 9 | 3813 | 11.6 | 1181 | 1130 | 231.2 |
| B | 3 | 80 | 3450 | 10.03 | 1181 | 1130 | 231.2 |
| B | 2 | 8 | 3180 | 8.87 | 1181 | 1130 | 231.2 |
| C | 3 | 158 | 3079 | 6.39 | 1206 | 1137 | 303.8 |
| C | 3 | 187 | 3046 | 6.28 | 1206 | 1137 | 303.8 |
| C | 9 | 188 | 2986 | 6.09 | 1206 | 1137 | 303.8 |
| D | 7 | 3 | 2823 | 6.42 | 1075 | 982 | 286.5 |
| D | 10 | 113 | 2739 | 6.13 | 1075 | 982 | 286.5 |
| D | 6 | 67 | 2728 | 6.09 | 1075 | 982 | 286.5 |
Histogram calculated using DETX and DETY for each event in the final _common_clean file
| Quadrant A | 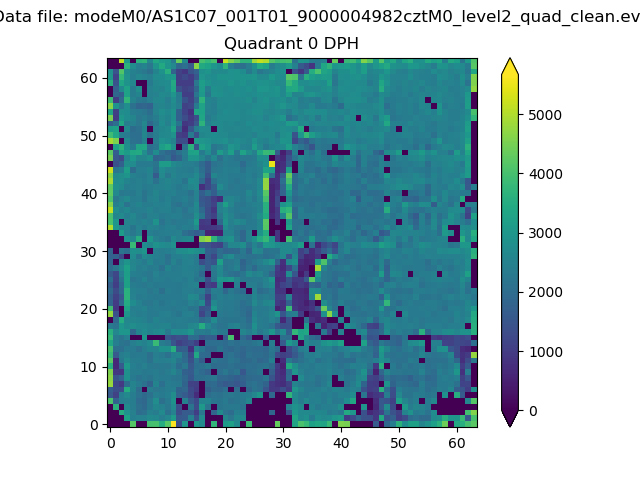 |
 |
Quadrant B |
|---|---|---|---|
| Quadrant D |  |
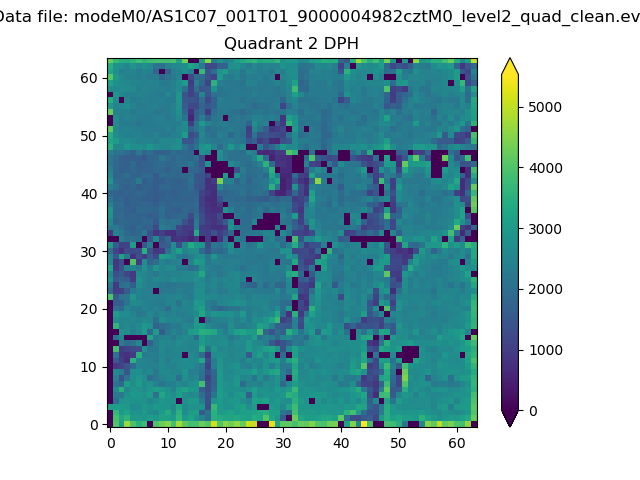 |
Quadrant C |
| Plot type | Count rate plots | Images |
|---|---|---|
| Comparison with Poisson distribution Blue bars denote a histogram of data divided into 1 sec bins. Red curve is a Poisson curve with rate = median count rate of data. |
 |
 |
| Quadrant-wise count rates Data is divided into 100 sec bins |
 |
|
| Module-wise count rates for Quadrant A Data is divided into 100 sec bins |
 |
 |
| Module-wise count rates for Quadrant B Data is divided into 100 sec bins |
 |
 |
| Module-wise count rates for Quadrant C Data is divided into 100 sec bins |
 |
 |
| Module-wise count rates for Quadrant D Data is divided into 100 sec bins |
 |
 |
| Parameter | Plot |
|---|---|
| CZT HV Monitor |  |
| D_VDD |  |
| Temperature 1 |  |
| Veto HV Monitor |  |
| Veto LLD |  |
| Alpha Counter |  |
| _CPM_Rate |  |
| CZT Counter |  |
| +2.5 Volts monitor |  |
| +5 Volts monitor |  |
| _ROLL_ROT |  |
| _Roll_DEC |  |
| _Roll_RA |  |
| Veto Counter |  |