| Param | Original file | Final file |
|---|---|---|
| Filename | modeM0/AS1C07_001T01_9000004982_34721cztM0_level2.evt | modeM0/AS1C07_001T01_9000004982_34721cztM0_level2_quad_clean.evt |
| Size (bytes) | 459,800,640 | 102,101,760 |
| Size | 438.5 MB | 97.4 MB |
| Events in quadrant A | 2,734,433 | 684,060 |
| Events in quadrant B | 2,833,550 | 690,568 |
| Events in quadrant C | 2,790,766 | 694,819 |
| Events in quadrant D | 5,194,749 | 639,584 |
| Mode M0 | |||
|---|---|---|---|
| Quadrant | BADHDUFLAG | Total packets | Discarded packets |
| A | 0 | 11684 | 3 |
| B | 0 | 12081 | 2 |
| C | 0 | 11663 | 2 |
| D | 0 | 19387 | 2 |
| Mode SS | |||
|---|---|---|---|
| Quadrant | BADHDUFLAG | Total packets | Discarded packets |
| A | 0 | 112 | 0 |
| B | 0 | 112 | 0 |
| C | 0 | 112 | 0 |
| D | 0 | 112 | 0 |
| Mode M9 | |||
|---|---|---|---|
| Quadrant | BADHDUFLAG | Total packets | Discarded packets |
| A | 0 | 26 | 0 |
| B | 0 | 26 | 0 |
| C | 0 | 26 | 0 |
| D | 0 | 27 | 0 |
| Quadrant | Total seconds | Saturated seconds | Saturation percentage |
|---|---|---|---|
| A | 5472 | 13 | 0.237573% |
| B | 5472 | 88 | 1.608187% |
| C | 5472 | 54 | 0.986842% |
| D | 5472 | 389 | 7.108918% |
Noise dominated data is calculated using 1-second bins in cleaned event files. If a bin has >2000 counts, and if more than 50% of those come from <1% of pixels, then it is considered to be noise-dominated and hence unusable.
| Quadrant | # 1 sec bins | Bins with >0 counts | Bins with >2000 counts | High rate bins dominated by noise | Noise dominated (total time) | Noise dominated (detector-on time) | Marked lightcurve |
|---|---|---|---|---|---|---|---|
| A | 7116 | 5473 | 5 | 5 | 0.07% | 0.09% | 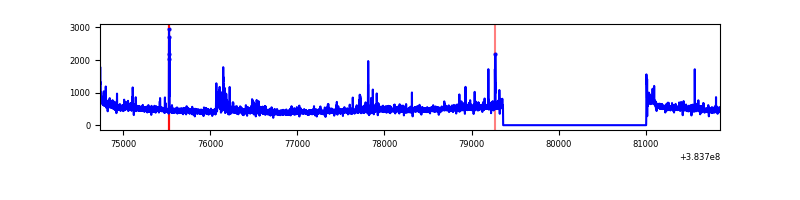 |
| B | 7116 | 5473 | 59 | 59 | 0.83% | 1.08% | 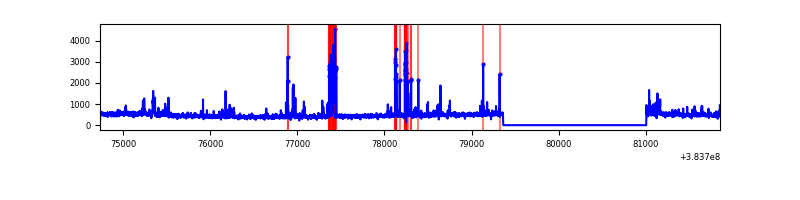 |
| C | 7116 | 5473 | 33 | 33 | 0.46% | 0.60% | 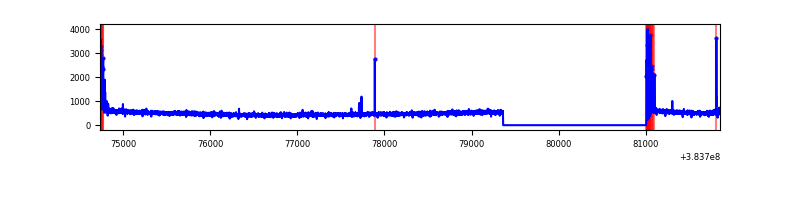 |
| D | 7116 | 5473 | 374 | 374 | 5.26% | 6.83% | 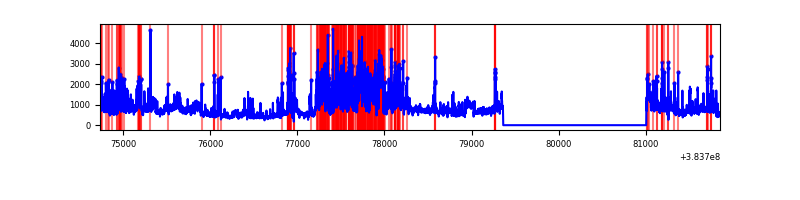 |
Top three noisy pixels from each quadrant. If the there are fewer than three noisy pixels in the level2.evt file, extra rows are filled as -1
| Pixel properties | Quadrant properties | ||||||
|---|---|---|---|---|---|---|---|
| Quadrant | DetID | PixID | Counts | Sigma | Mean | Median | Sigma |
| A | 15 | 169 | 211451 | 1693.9 | 619 | 607 | 124.5 |
| A | 10 | 83 | 49292 | 391.13 | 619 | 607 | 124.5 |
| A | 9 | 143 | 31086 | 244.86 | 619 | 607 | 124.5 |
| B | 5 | 172 | 281523 | 2351.84 | 617 | 600 | 119.4 |
| B | 4 | 232 | 51472 | 425.89 | 617 | 600 | 119.4 |
| B | 4 | 171 | 21894 | 178.27 | 617 | 600 | 119.4 |
| C | 15 | 214 | 234053 | 1645.05 | 609 | 612 | 141.9 |
| C | 0 | 10 | 134830 | 945.83 | 609 | 612 | 141.9 |
| C | 14 | 67 | 27894 | 192.26 | 609 | 612 | 141.9 |
| D | 2 | 250 | 1183071 | 7390.52 | 590 | 578 | 160.0 |
| D | 8 | 195 | 1071504 | 6693.24 | 590 | 578 | 160.0 |
| D | 1 | 20 | 193412 | 1205.2 | 590 | 578 | 160.0 |
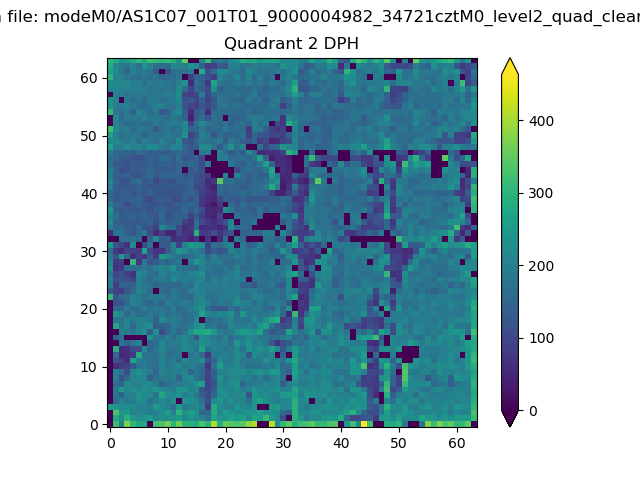
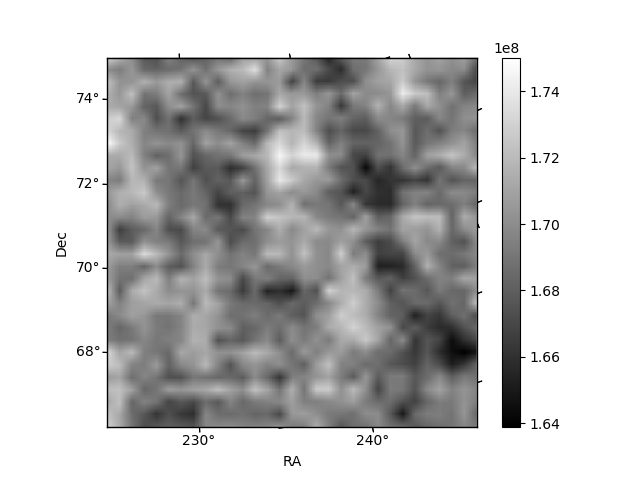
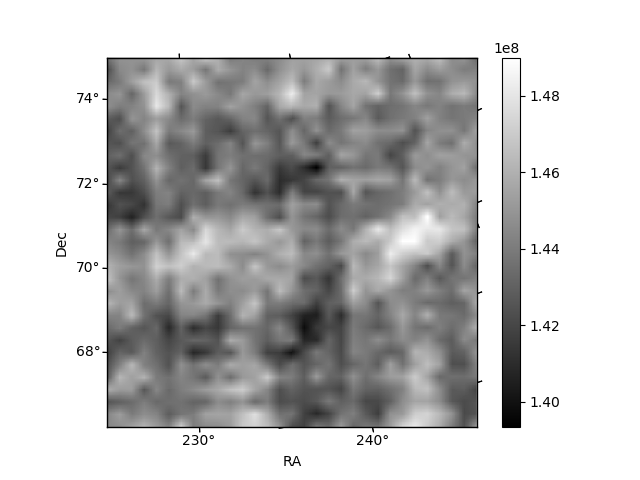
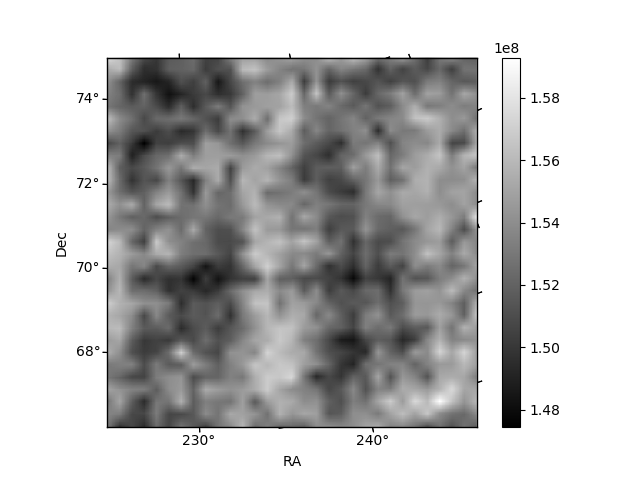
Histogram calculated using DETX and DETY for each event in the final _common_clean file
| Quadrant A |  |
 |
Quadrant B |
|---|---|---|---|
| Quadrant D | 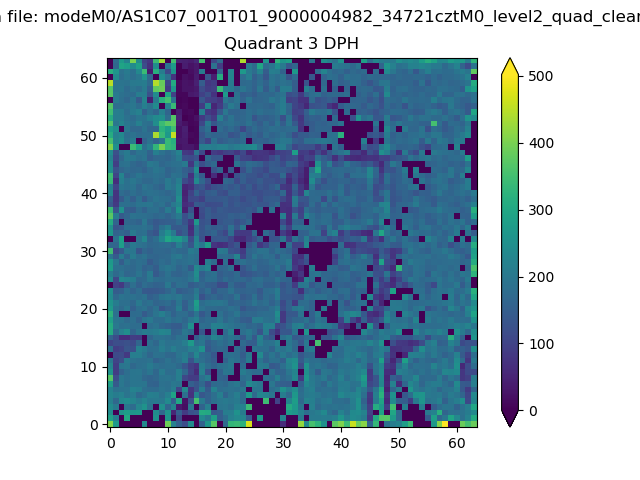 |
 |
Quadrant C |
| Plot type | Count rate plots | Images |
|---|---|---|
| Comparison with Poisson distribution Blue bars denote a histogram of data divided into 1 sec bins. Red curve is a Poisson curve with rate = median count rate of data. |
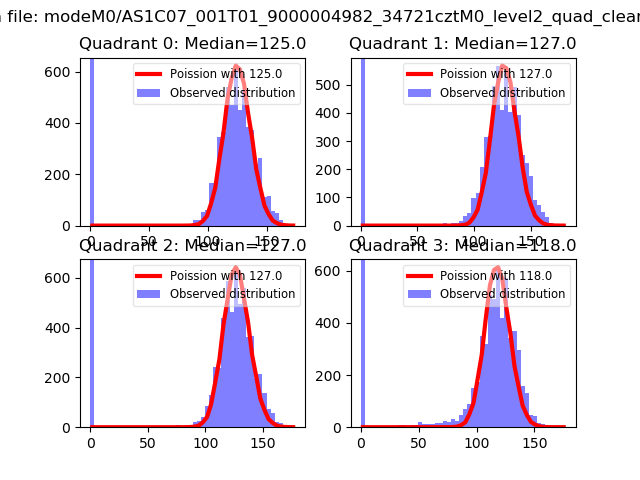 |
 |
| Quadrant-wise count rates Data is divided into 100 sec bins |
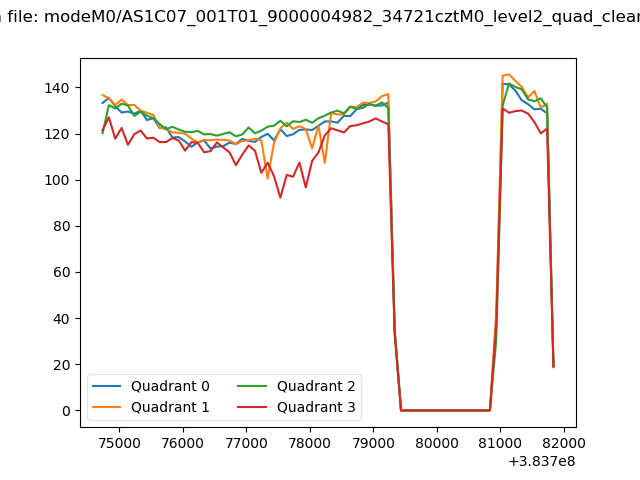 |
|
| Module-wise count rates for Quadrant A Data is divided into 100 sec bins |
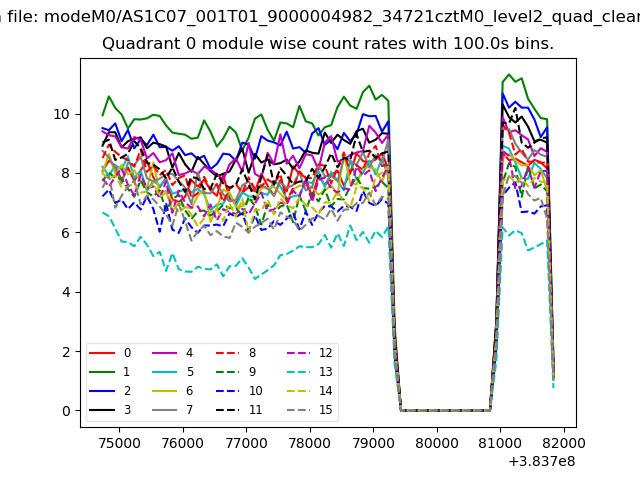 |
 |
| Module-wise count rates for Quadrant B Data is divided into 100 sec bins |
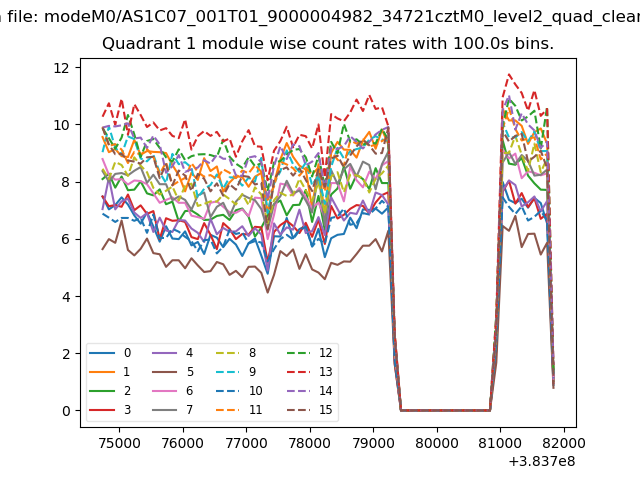 |
 |
| Module-wise count rates for Quadrant C Data is divided into 100 sec bins |
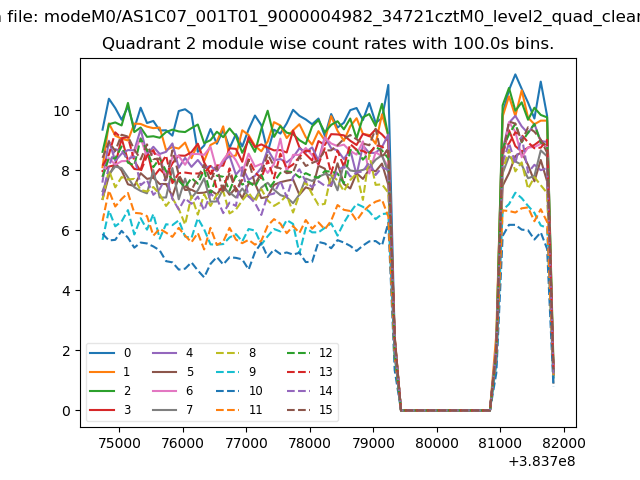 |
 |
| Module-wise count rates for Quadrant D Data is divided into 100 sec bins |
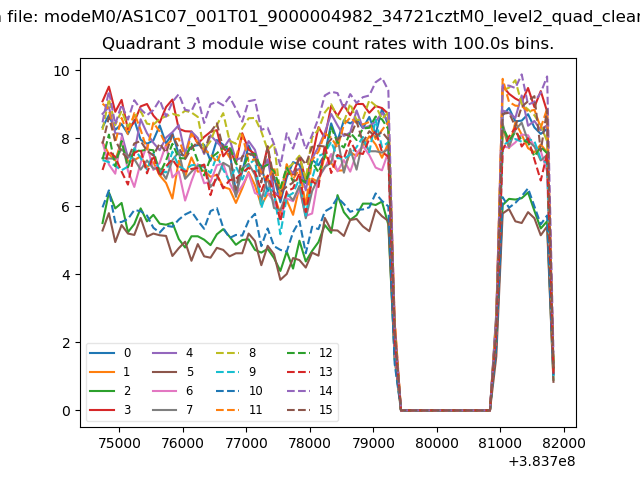 |
 |
| Parameter | Plot |
|---|---|
| CZT HV Monitor | 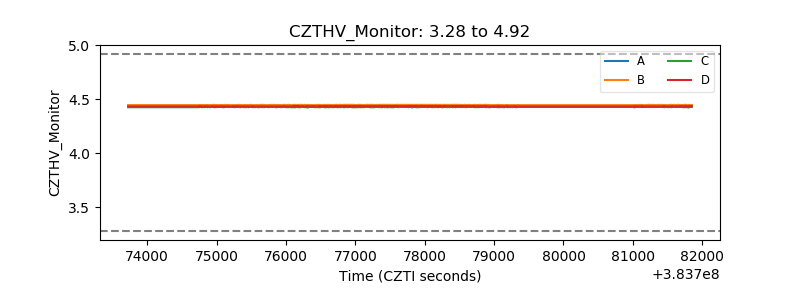 |
| D_VDD | 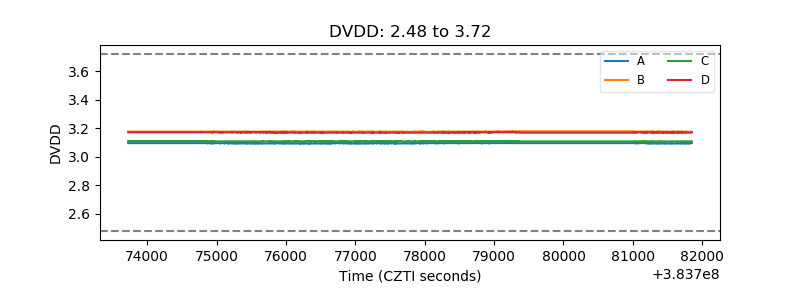 |
| Temperature 1 | 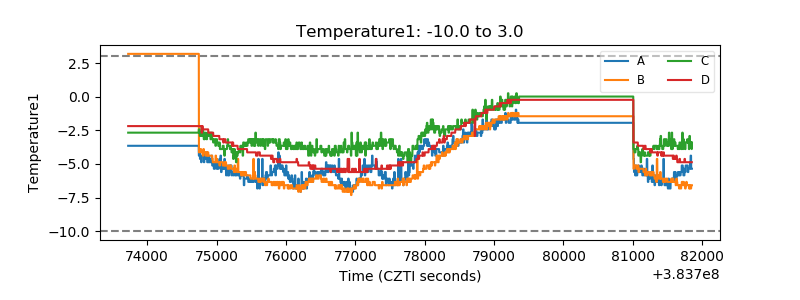 |
| Veto HV Monitor |  |
| Veto LLD | 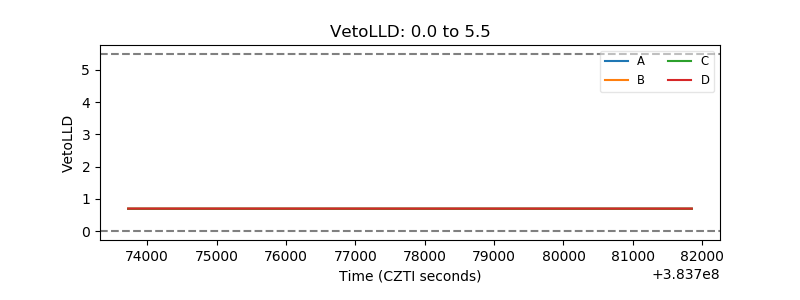 |
| Alpha Counter | 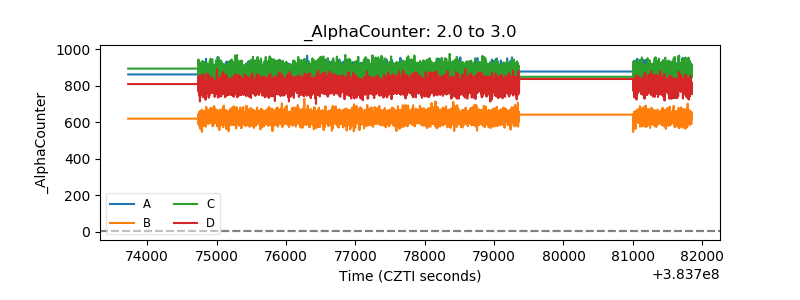 |
| _CPM_Rate |  |
| CZT Counter | 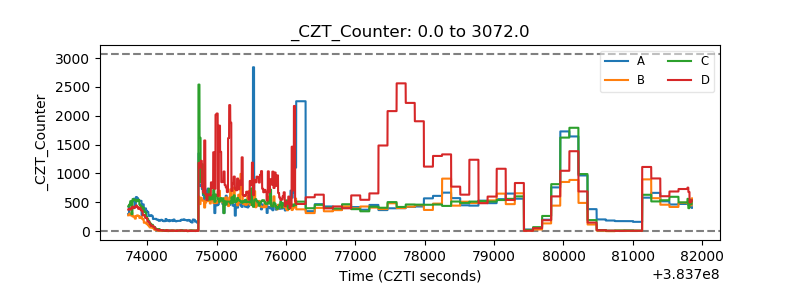 |
| +2.5 Volts monitor | 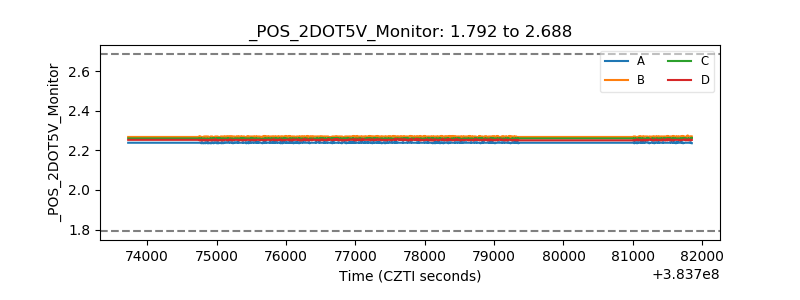 |
| +5 Volts monitor | 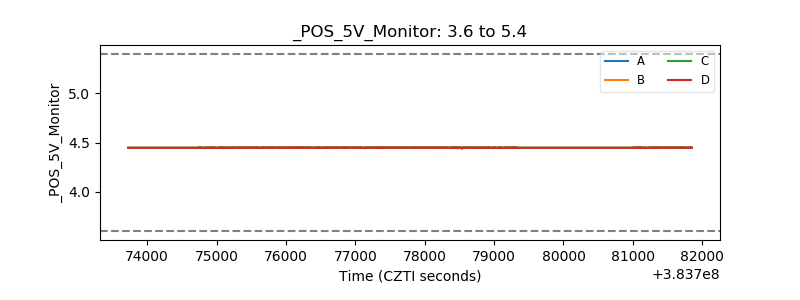 |
| _ROLL_ROT | 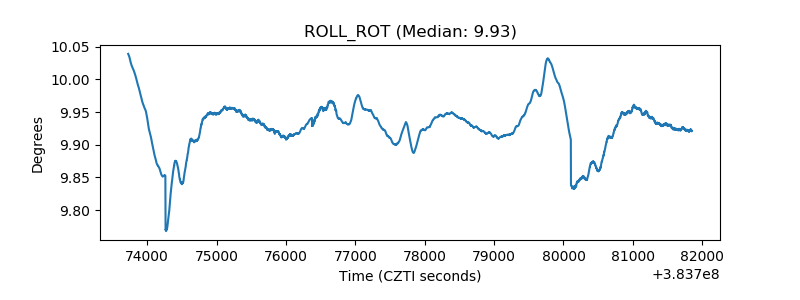 |
| _Roll_DEC | 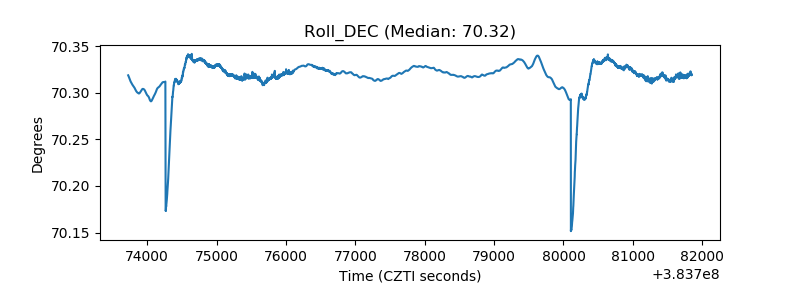 |
| _Roll_RA | 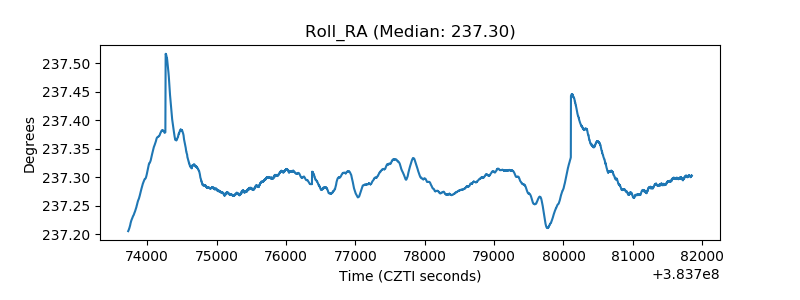 |
| Veto Counter | 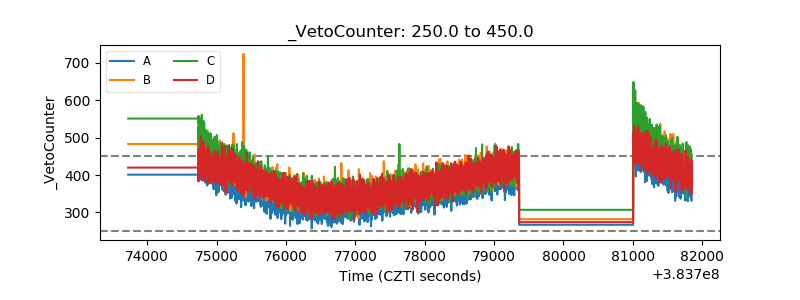 |