| Param | Original file | Final file |
|---|---|---|
| Filename | modeM0/AS1C07_006T02_9000004980_34714cztM0_level2.evt | modeM0/AS1C07_006T02_9000004980_34714cztM0_level2_quad_clean.evt |
| Size (bytes) | 83,234,880 | 4,757,760 |
| Size | 79.4 MB | 4.5 MB |
| Events in quadrant A | 545,585 | 17,301 |
| Events in quadrant B | 664,493 | 17,554 |
| Events in quadrant C | 569,480 | 16,018 |
| Events in quadrant D | 671,418 | 16,566 |
| Mode M0 | |||
|---|---|---|---|
| Quadrant | BADHDUFLAG | Total packets | Discarded packets |
| A | 0 | 2189 | 2 |
| B | 0 | 2569 | 1 |
| C | 0 | 2234 | 1 |
| D | 0 | 2638 | 1 |
| Mode M9 | |||
|---|---|---|---|
| Quadrant | BADHDUFLAG | Total packets | Discarded packets |
| A | 0 | 13 | 0 |
| B | 0 | 13 | 0 |
| C | 0 | 13 | 0 |
| D | 0 | 13 | 0 |
| Mode SS | |||
|---|---|---|---|
| Quadrant | BADHDUFLAG | Total packets | Discarded packets |
| A | 0 | 20 | 0 |
| B | 0 | 20 | 0 |
| C | 0 | 20 | 0 |
| D | 0 | 20 | 0 |
| Quadrant | Total seconds | Saturated seconds | Saturation percentage |
|---|---|---|---|
| A | 980 | 1 | 0.102041% |
| B | 980 | 46 | 4.693878% |
| C | 980 | 24 | 2.448980% |
| D | 980 | 4 | 0.408163% |
Noise dominated data is calculated using 1-second bins in cleaned event files. If a bin has >2000 counts, and if more than 50% of those come from <1% of pixels, then it is considered to be noise-dominated and hence unusable.
| Quadrant | # 1 sec bins | Bins with >0 counts | Bins with >2000 counts | High rate bins dominated by noise | Noise dominated (total time) | Noise dominated (detector-on time) | Marked lightcurve |
|---|---|---|---|---|---|---|---|
| A | 980 | 980 | 0 | 0 | 0.00% | 0.00% | 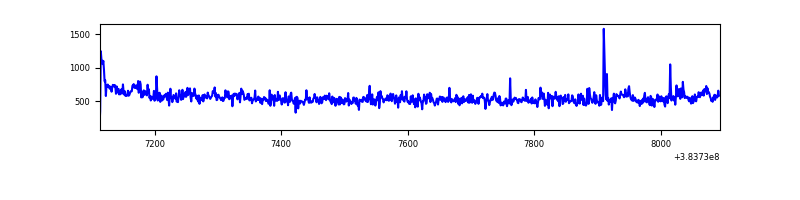 |
| B | 980 | 980 | 29 | 29 | 2.96% | 2.96% | 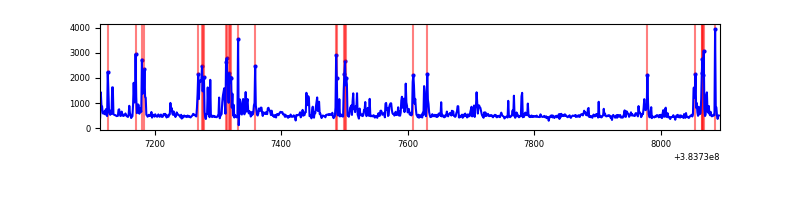 |
| C | 980 | 980 | 16 | 16 | 1.63% | 1.63% | 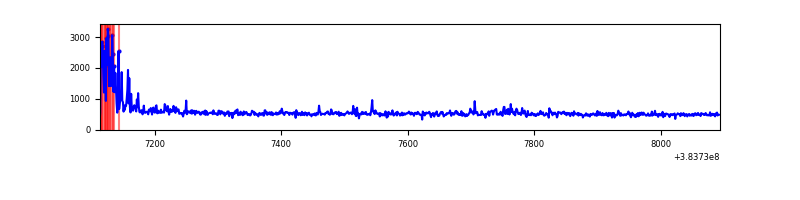 |
| D | 980 | 980 | 6 | 6 | 0.61% | 0.61% | 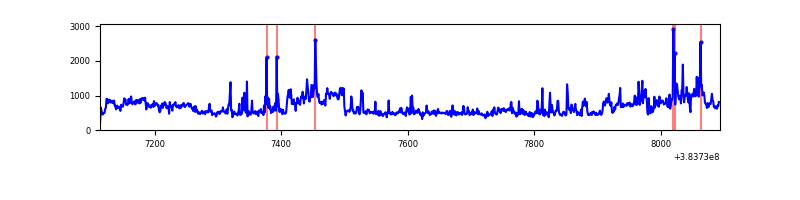 |
Top three noisy pixels from each quadrant. If the there are fewer than three noisy pixels in the level2.evt file, extra rows are filled as -1
| Pixel properties | Quadrant properties | ||||||
|---|---|---|---|---|---|---|---|
| Quadrant | DetID | PixID | Counts | Sigma | Mean | Median | Sigma |
| A | 15 | 169 | 47857 | 1832.04 | 120 | 117 | 26.1 |
| A | 10 | 83 | 20469 | 781.01 | 120 | 117 | 26.1 |
| A | 9 | 143 | 7533 | 284.59 | 120 | 117 | 26.1 |
| B | 5 | 172 | 77813 | 3160.34 | 115 | 112 | 24.6 |
| B | 5 | 255 | 72981 | 2963.8 | 115 | 112 | 24.6 |
| B | 4 | 81 | 39370 | 1596.74 | 115 | 112 | 24.6 |
| C | 0 | 10 | 65050 | 2360.07 | 112 | 112 | 27.5 |
| C | 15 | 214 | 44903 | 1627.86 | 112 | 112 | 27.5 |
| C | 15 | 159 | 18440 | 666.1 | 112 | 112 | 27.5 |
| D | 8 | 195 | 136664 | 4510.64 | 114 | 111 | 30.3 |
| D | 2 | 250 | 28093 | 924.31 | 114 | 111 | 30.3 |
| D | 12 | 6 | 19004 | 624.08 | 114 | 111 | 30.3 |
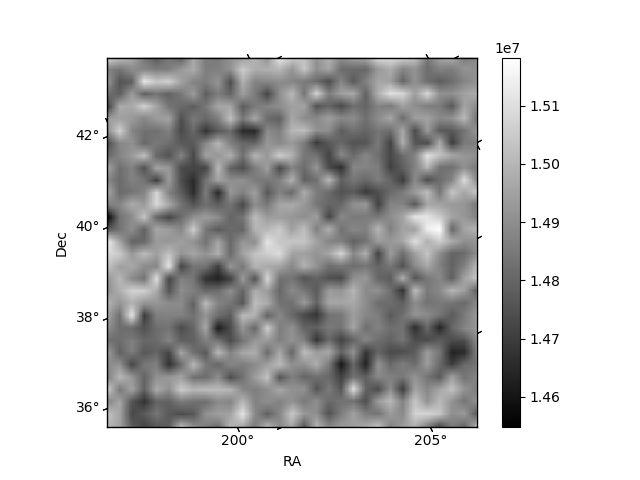
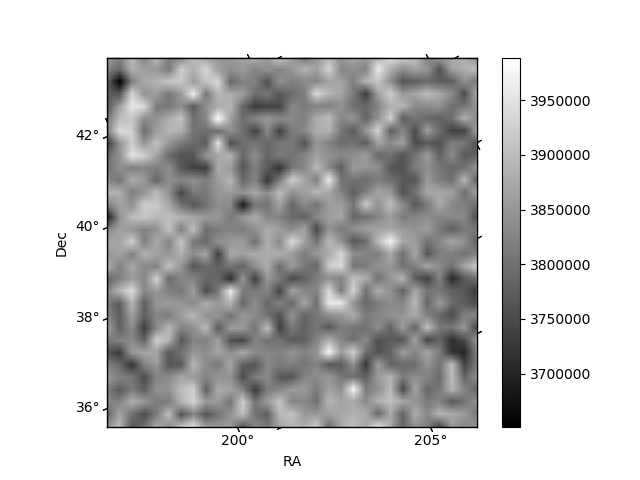
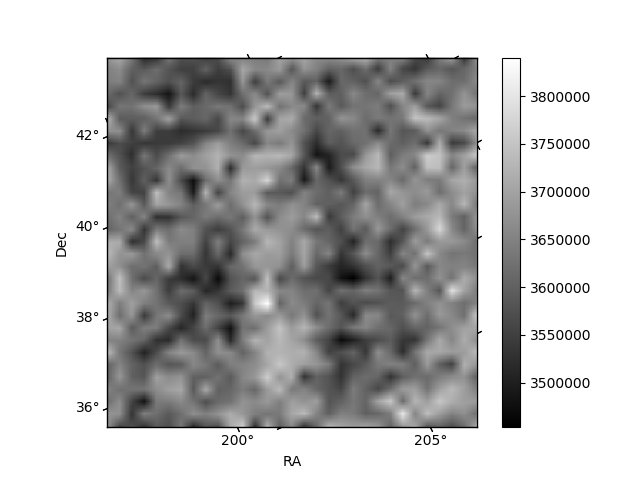
Histogram calculated using DETX and DETY for each event in the final _common_clean file
| Quadrant A | 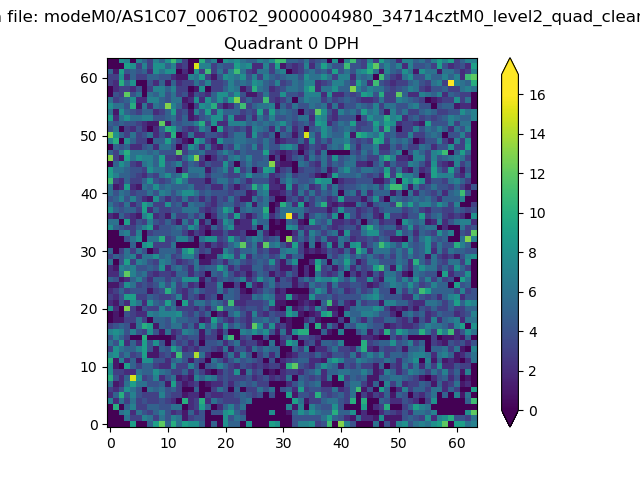 |
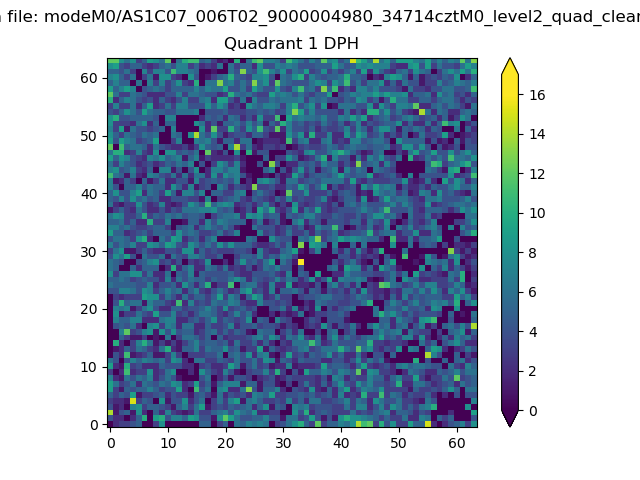 |
Quadrant B |
|---|---|---|---|
| Quadrant D | 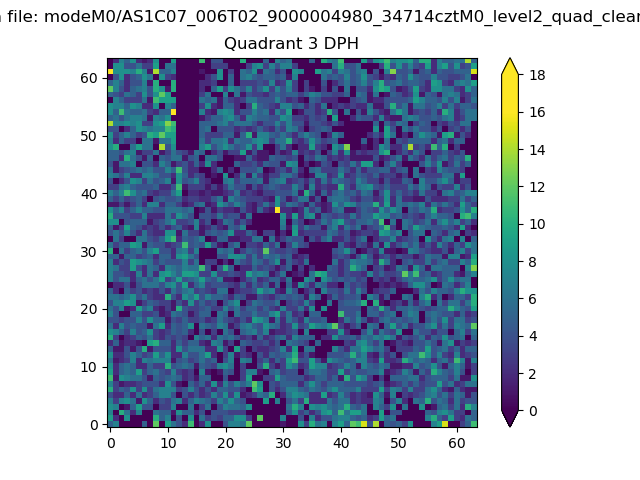 |
 |
Quadrant C |
| Plot type | Count rate plots | Images |
|---|---|---|
| Comparison with Poisson distribution Blue bars denote a histogram of data divided into 1 sec bins. Red curve is a Poisson curve with rate = median count rate of data. |
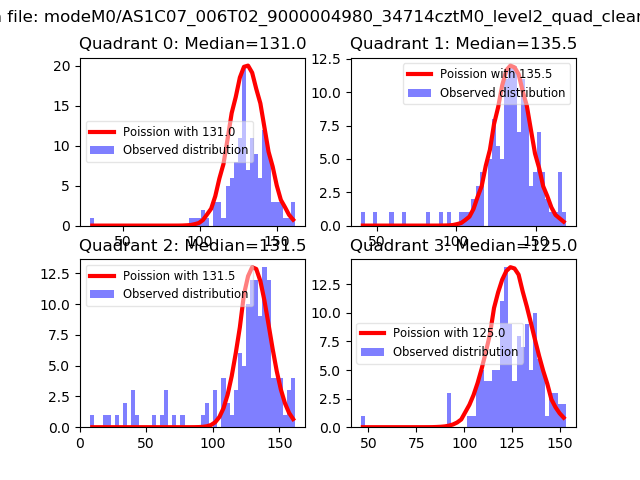 |
 |
| Quadrant-wise count rates Data is divided into 100 sec bins |
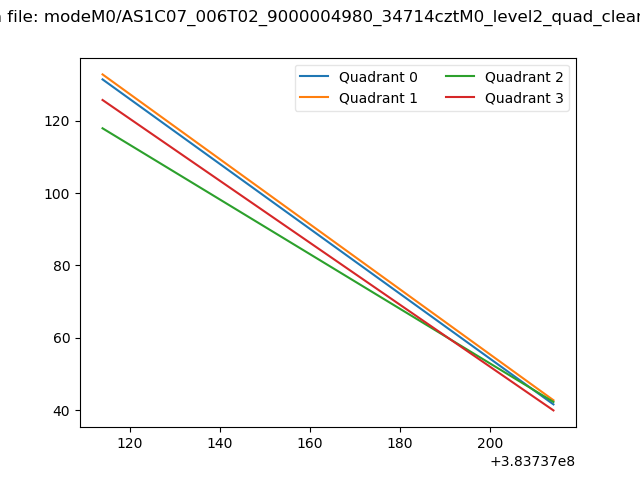 |
|
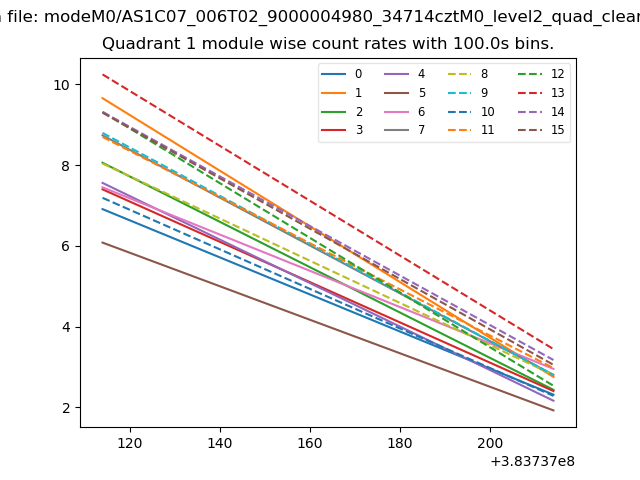
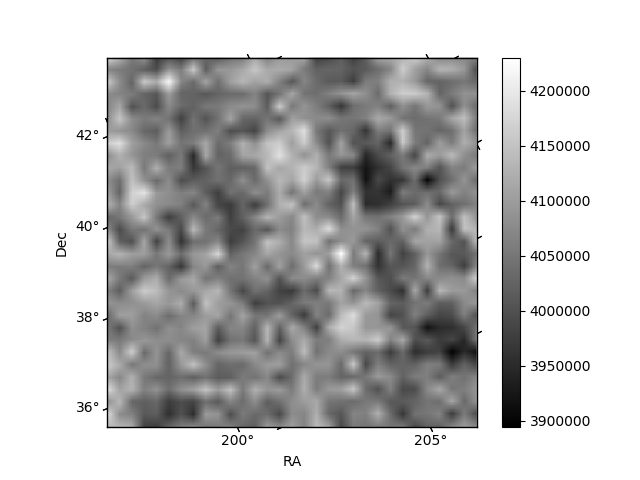
| Module-wise count rates for Quadrant A Data is divided into 100 sec bins |
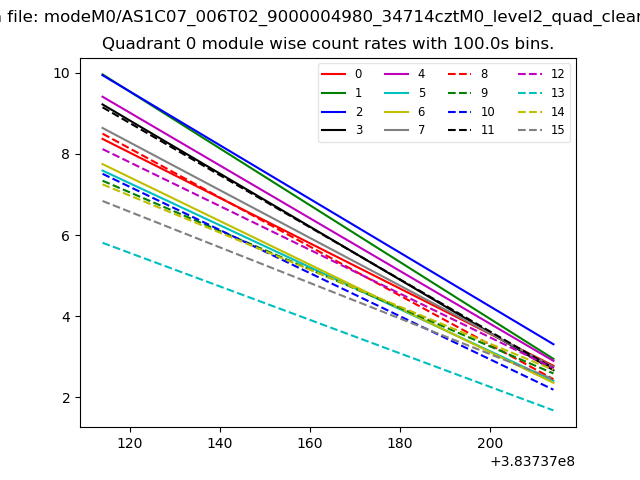 |
 |
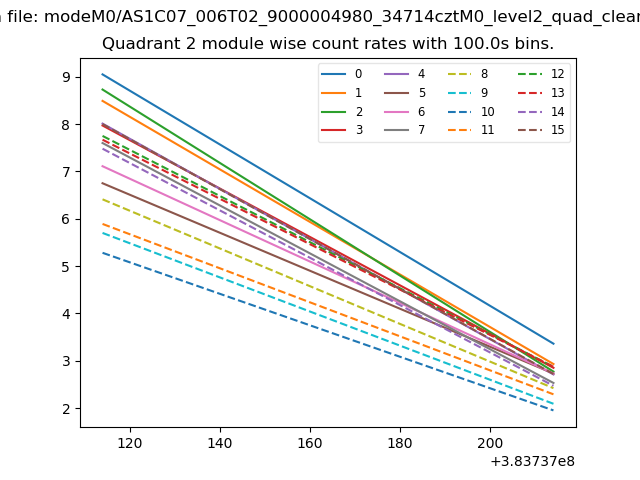
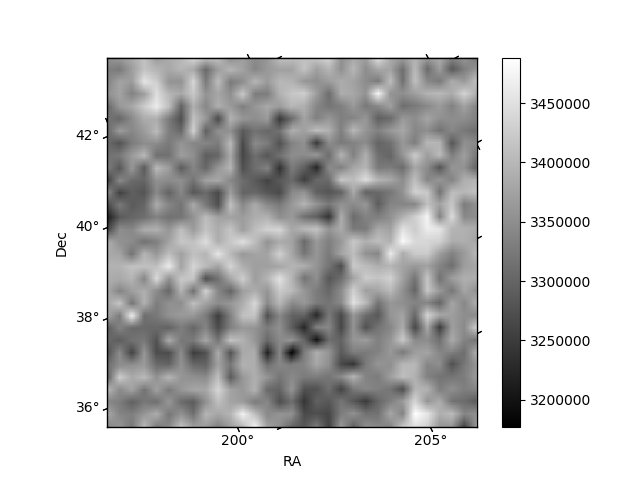
| Module-wise count rates for Quadrant B Data is divided into 100 sec bins |
 |
 |
| Module-wise count rates for Quadrant C Data is divided into 100 sec bins |
 |
 |
| Module-wise count rates for Quadrant D Data is divided into 100 sec bins |
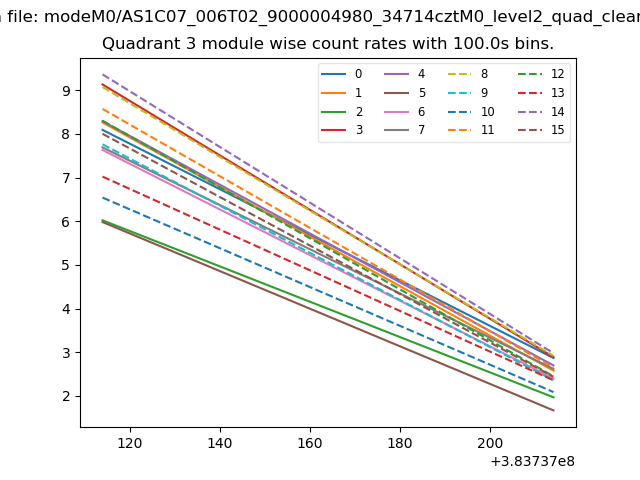 |
 |
| Parameter | Plot |
|---|---|
| CZT HV Monitor | 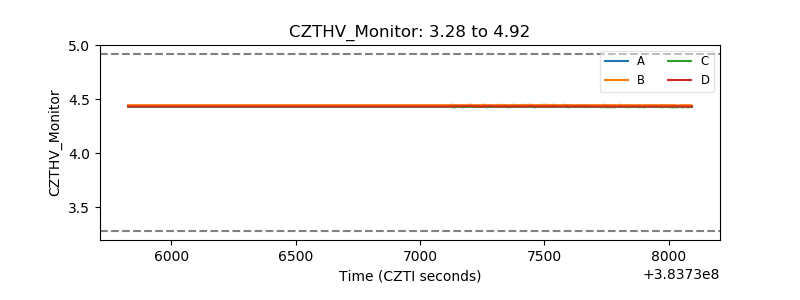 |
| D_VDD | 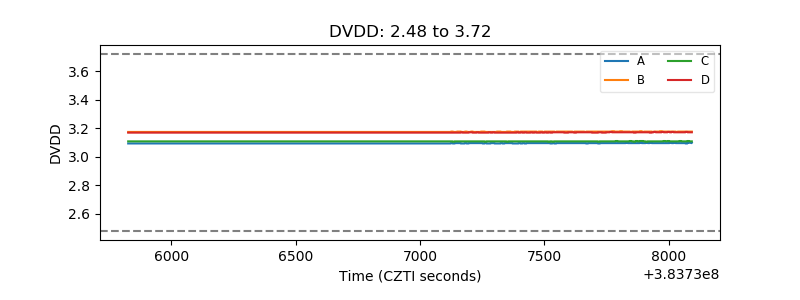 |
| Temperature 1 | 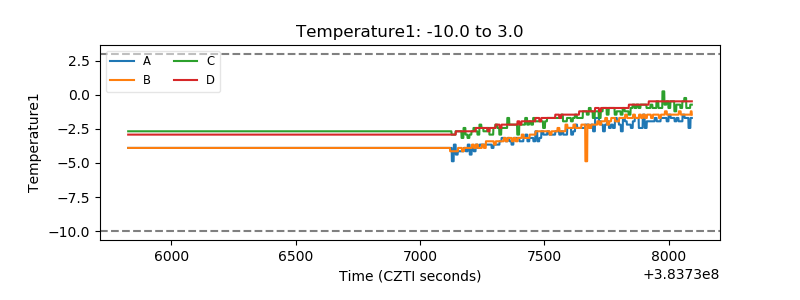 |
| Veto HV Monitor | 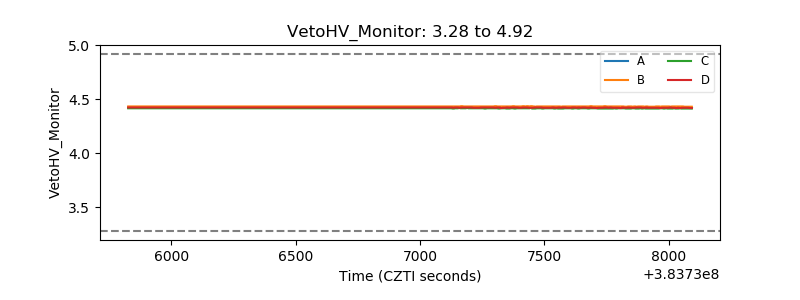 |
| Veto LLD | 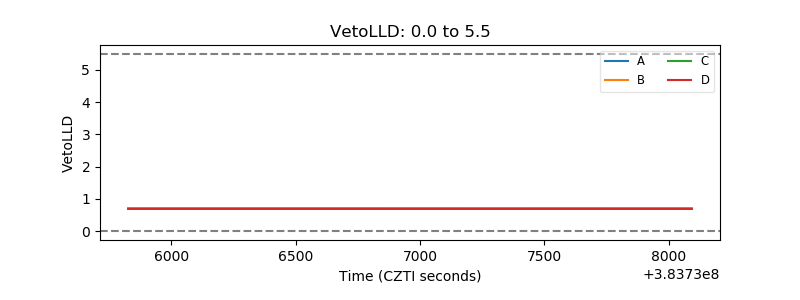 |
| Alpha Counter | 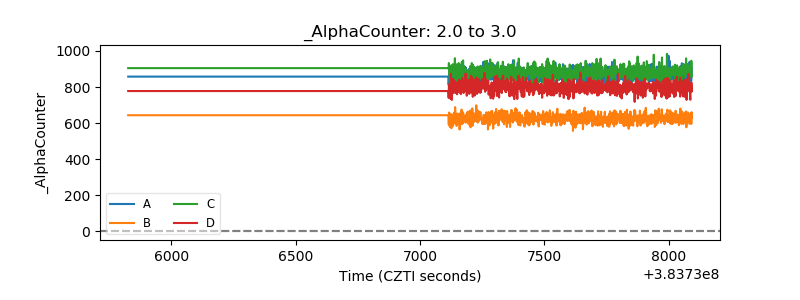 |
| _CPM_Rate | 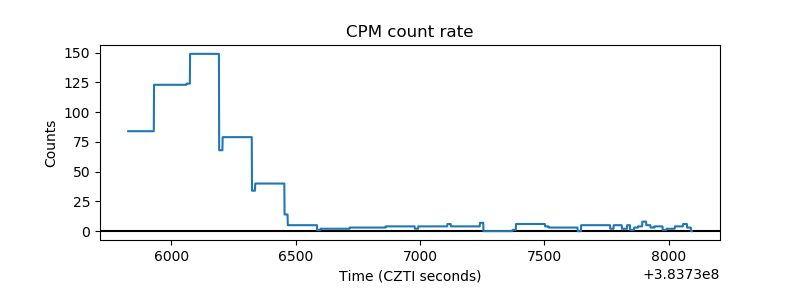 |
| CZT Counter | 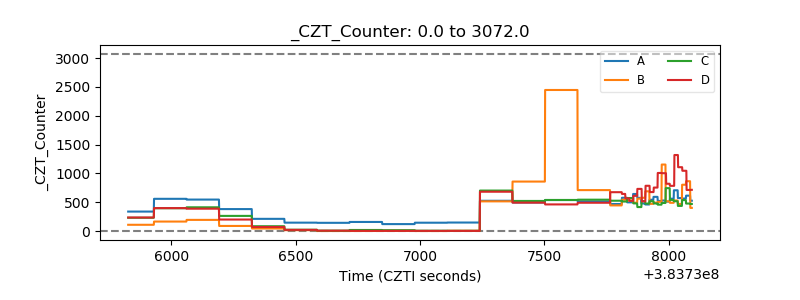 |
| +2.5 Volts monitor |  |
| +5 Volts monitor |  |
| _ROLL_ROT | 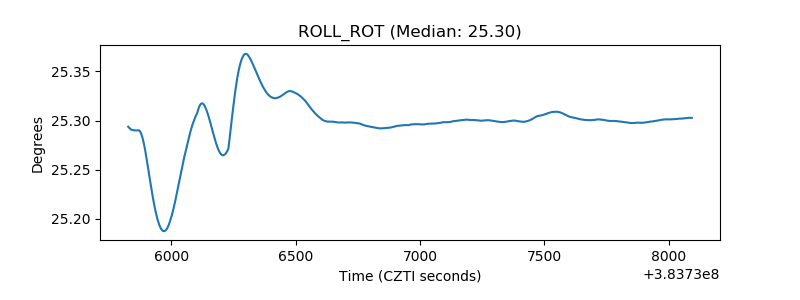 |
| _Roll_DEC | 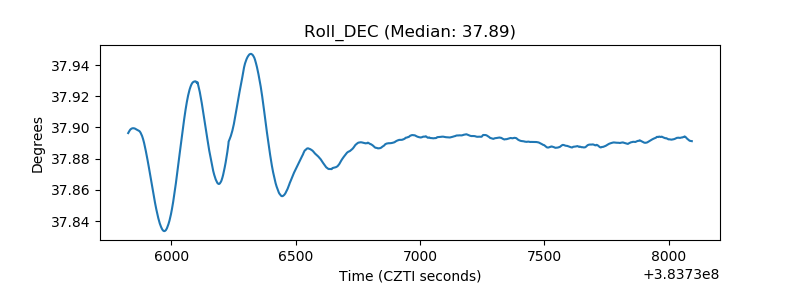 |
| _Roll_RA | 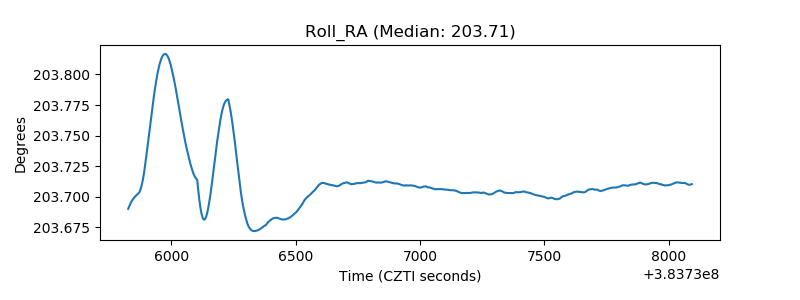 |
| Veto Counter | 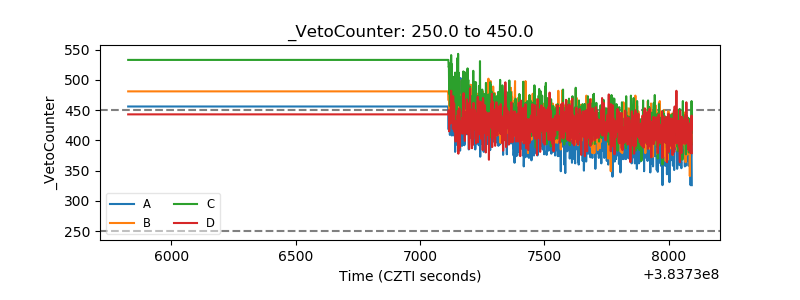 |