| Param | Original file | Final file |
|---|---|---|
| Filename | modeM0/AS1A10_048T04_9000004984_34736cztM0_level2.evt | modeM0/AS1A10_048T04_9000004984_34736cztM0_level2_quad_clean.evt |
| Size (bytes) | 893,459,520 | 149,221,440 |
| Size | 852.1 MB | 142.3 MB |
| Events in quadrant A | 5,873,672 | 944,489 |
| Events in quadrant B | 5,680,208 | 965,942 |
| Events in quadrant C | 6,181,796 | 941,137 |
| Events in quadrant D | 8,560,780 | 887,262 |
| Mode SS | |||
|---|---|---|---|
| Quadrant | BADHDUFLAG | Total packets | Discarded packets |
| A | 0 | 232 | 0 |
| B | 0 | 232 | 0 |
| C | 0 | 232 | 0 |
| D | 0 | 232 | 0 |
| Mode M0 | |||
|---|---|---|---|
| Quadrant | BADHDUFLAG | Total packets | Discarded packets |
| A | 0 | 24898 | 4 |
| B | 0 | 24030 | 3 |
| C | 0 | 25154 | 3 |
| D | 0 | 33398 | 3 |
| Mode M9 | |||
|---|---|---|---|
| Quadrant | BADHDUFLAG | Total packets | Discarded packets |
| A | 0 | 46 | 0 |
| B | 0 | 46 | 0 |
| C | 0 | 46 | 0 |
| D | 0 | 46 | 0 |
| Quadrant | Total seconds | Saturated seconds | Saturation percentage |
|---|---|---|---|
| A | 11277 | 61 | 0.540924% |
| B | 11277 | 68 | 0.602997% |
| C | 11277 | 112 | 0.993172% |
| D | 11277 | 335 | 2.970648% |
Noise dominated data is calculated using 1-second bins in cleaned event files. If a bin has >2000 counts, and if more than 50% of those come from <1% of pixels, then it is considered to be noise-dominated and hence unusable.
| Quadrant | # 1 sec bins | Bins with >0 counts | Bins with >2000 counts | High rate bins dominated by noise | Noise dominated (total time) | Noise dominated (detector-on time) | Marked lightcurve |
|---|---|---|---|---|---|---|---|
| A | 15937 | 11280 | 29 | 29 | 0.18% | 0.26% | 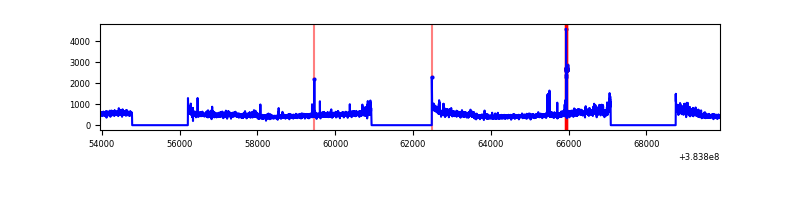 |
| B | 15937 | 11280 | 35 | 35 | 0.22% | 0.31% | 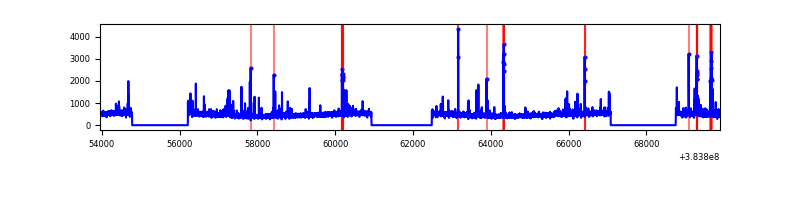 |
| C | 15937 | 11280 | 96 | 96 | 0.60% | 0.85% | 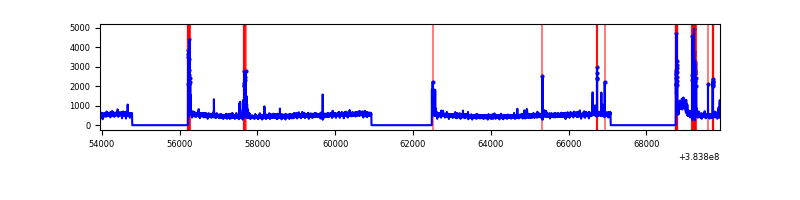 |
| D | 15937 | 11280 | 290 | 290 | 1.82% | 2.57% | 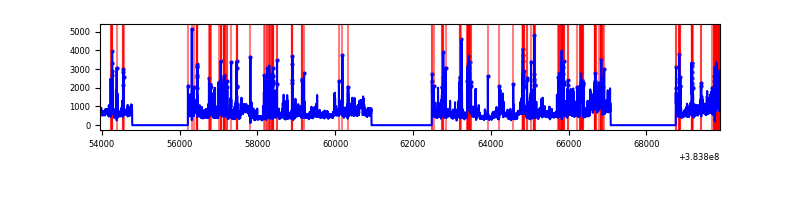 |
Top three noisy pixels from each quadrant. If the there are fewer than three noisy pixels in the level2.evt file, extra rows are filled as -1
| Pixel properties | Quadrant properties | ||||||
|---|---|---|---|---|---|---|---|
| Quadrant | DetID | PixID | Counts | Sigma | Mean | Median | Sigma |
| A | 15 | 169 | 508114 | 1912.34 | 1325 | 1302 | 265.0 |
| A | 15 | 174 | 105820 | 394.37 | 1325 | 1302 | 265.0 |
| A | 10 | 83 | 78613 | 291.71 | 1325 | 1302 | 265.0 |
| B | 5 | 172 | 248376 | 964.24 | 1325 | 1290 | 256.2 |
| B | 4 | 232 | 87091 | 334.83 | 1325 | 1290 | 256.2 |
| B | 5 | 255 | 54817 | 208.89 | 1325 | 1290 | 256.2 |
| C | 15 | 214 | 474284 | 1568.08 | 1297 | 1307 | 301.6 |
| C | 0 | 207 | 368429 | 1217.14 | 1297 | 1307 | 301.6 |
| C | 0 | 10 | 128484 | 421.64 | 1297 | 1307 | 301.6 |
| D | 8 | 195 | 1537868 | 4933.5 | 1281 | 1248 | 311.5 |
| D | 1 | 52 | 495759 | 1587.69 | 1281 | 1248 | 311.5 |
| D | 2 | 249 | 484120 | 1550.32 | 1281 | 1248 | 311.5 |
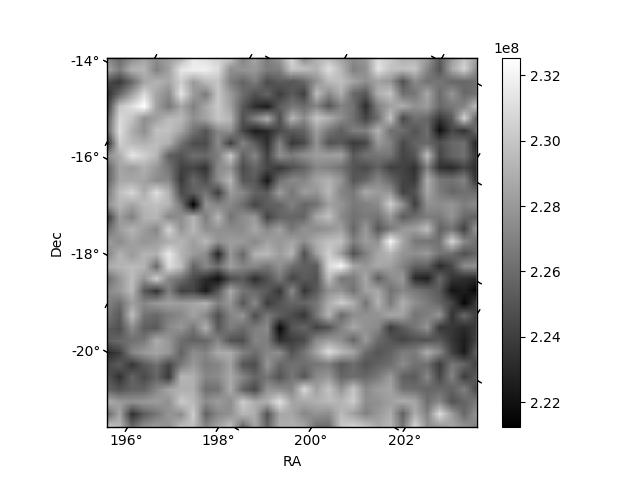
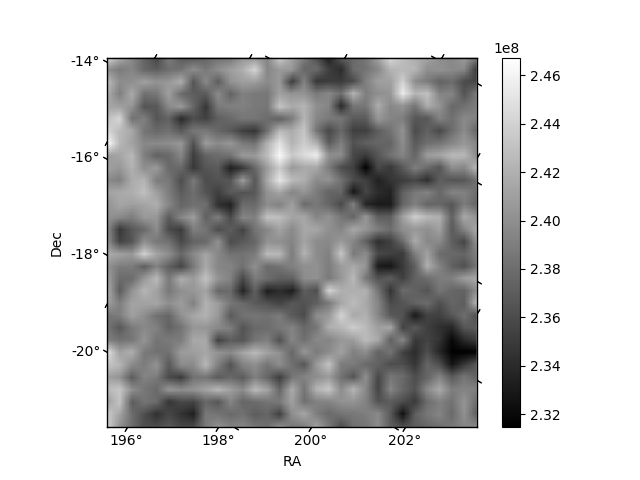
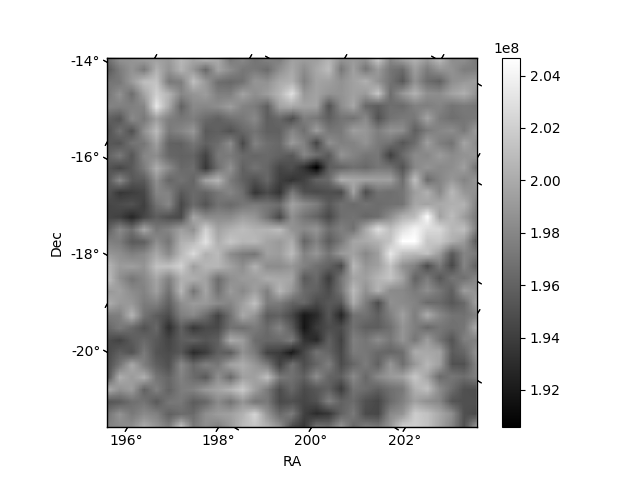
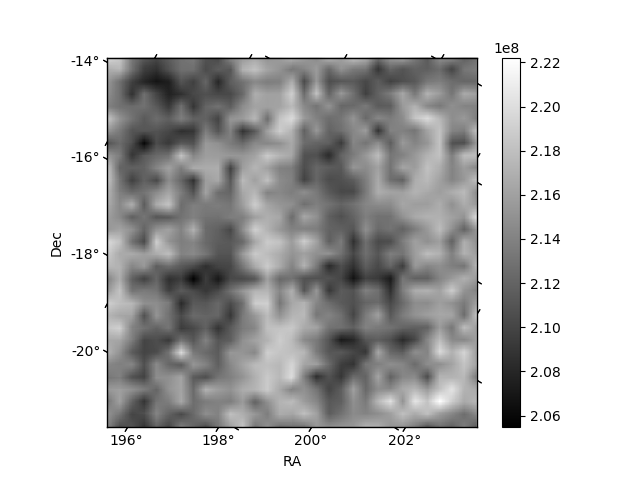
Histogram calculated using DETX and DETY for each event in the final _common_clean file
| Quadrant A | 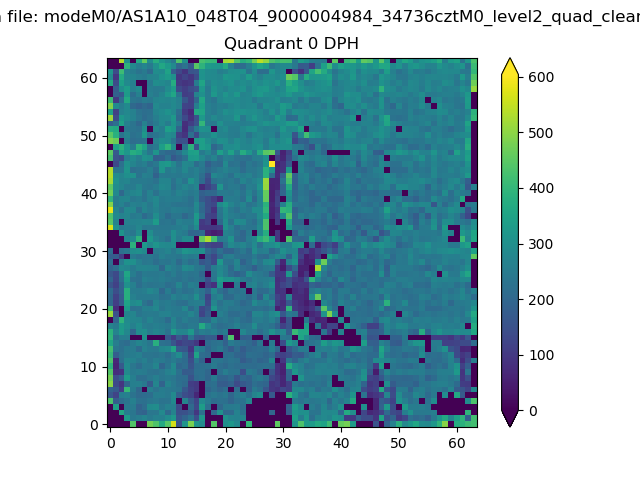 |
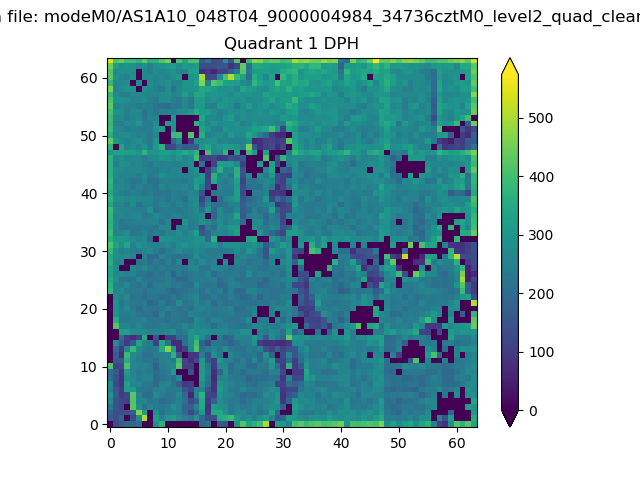 |
Quadrant B |
|---|---|---|---|
| Quadrant D | 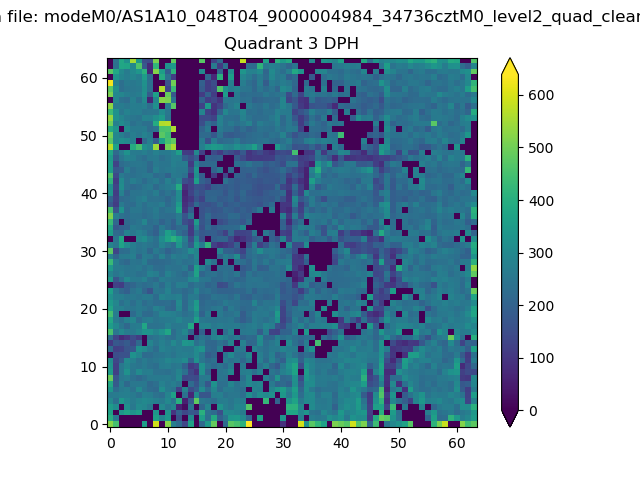 |
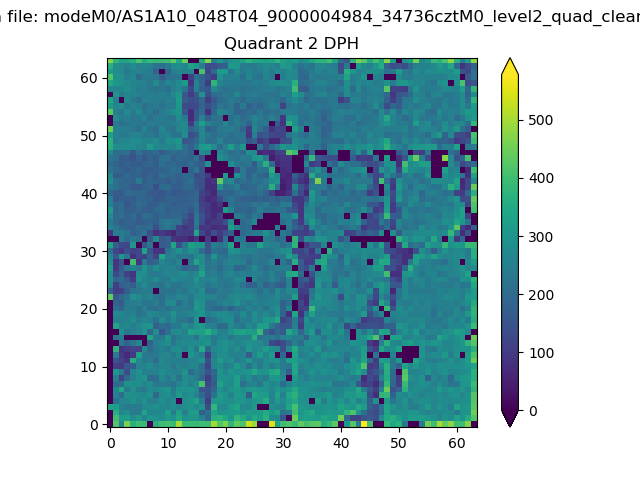 |
Quadrant C |
| Plot type | Count rate plots | Images |
|---|---|---|
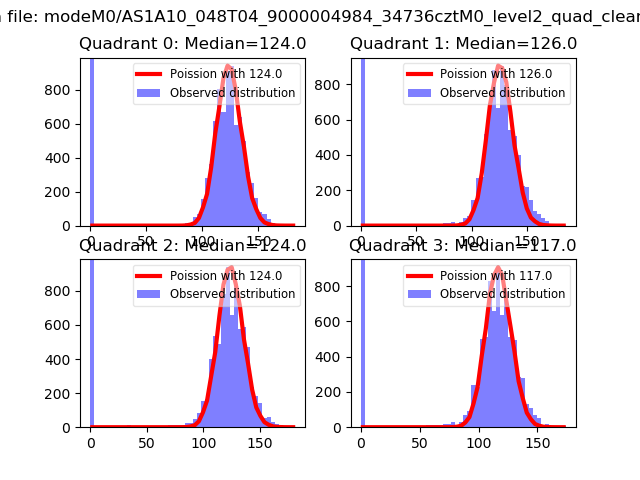
| Comparison with Poisson distribution Blue bars denote a histogram of data divided into 1 sec bins. Red curve is a Poisson curve with rate = median count rate of data. |
 |
 |
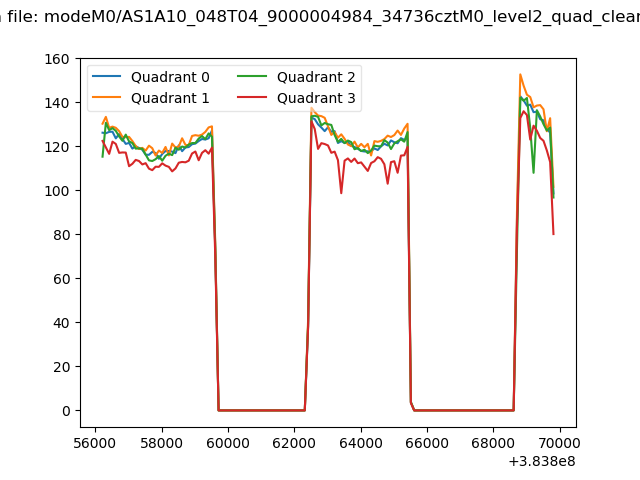
| Quadrant-wise count rates Data is divided into 100 sec bins |
 |
|
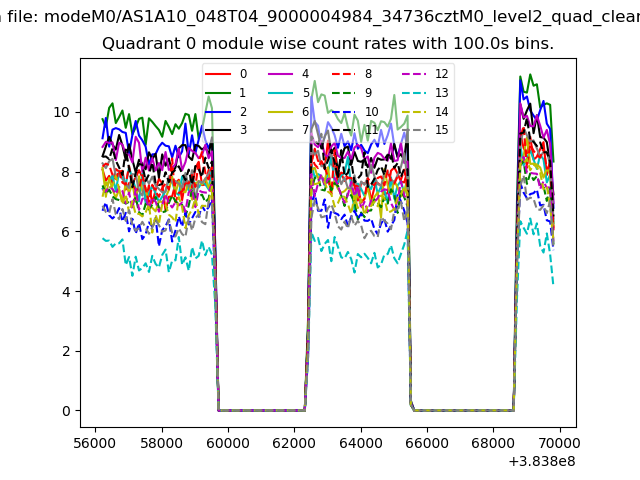
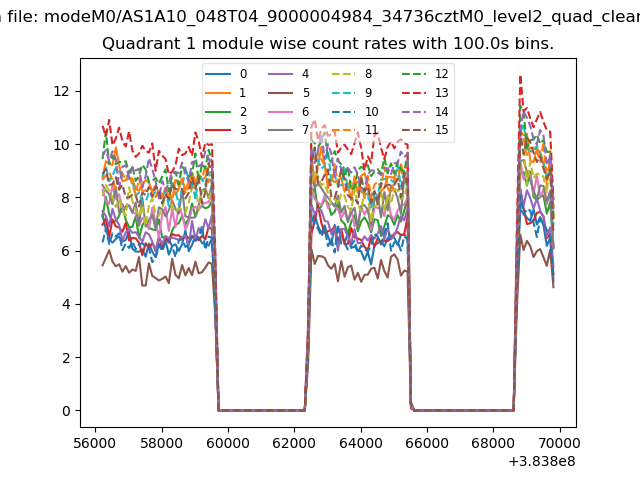
| Module-wise count rates for Quadrant A Data is divided into 100 sec bins |
 |
 |
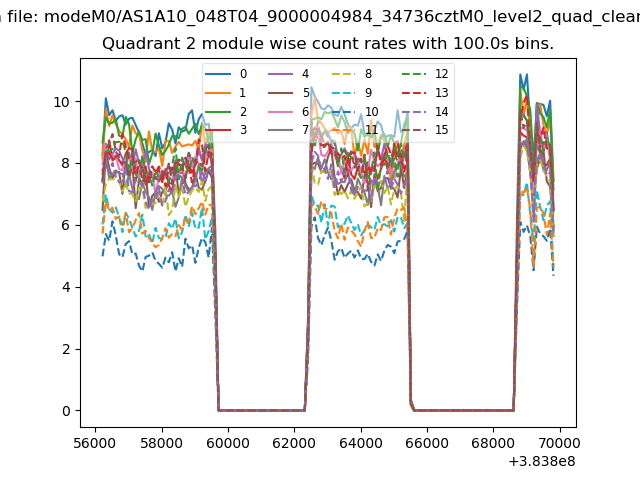
| Module-wise count rates for Quadrant B Data is divided into 100 sec bins |
 |
 |
| Module-wise count rates for Quadrant C Data is divided into 100 sec bins |
 |
 |
| Module-wise count rates for Quadrant D Data is divided into 100 sec bins |
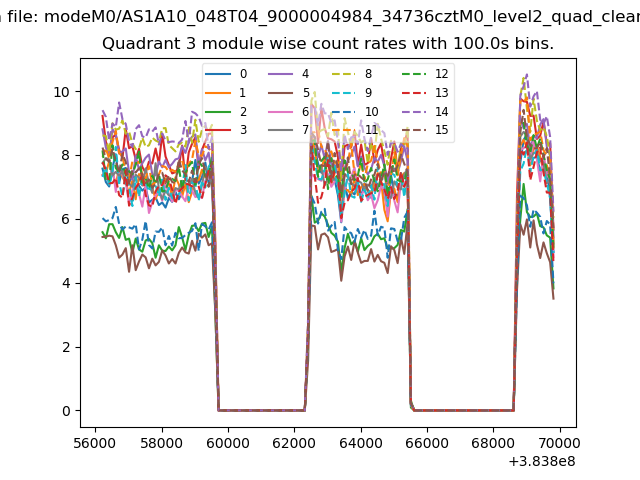 |
 |
| Parameter | Plot |
|---|---|
| CZT HV Monitor | 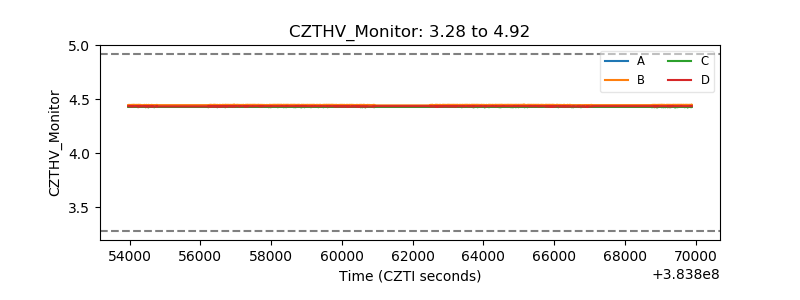 |
| D_VDD | 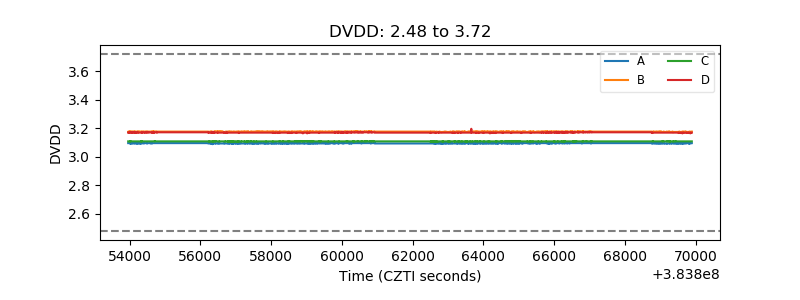 |
| Temperature 1 | 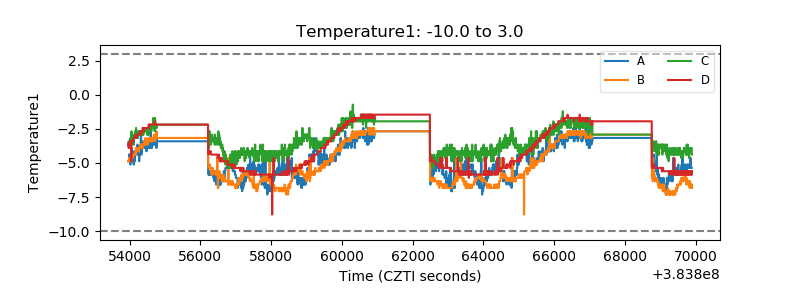 |
| Veto HV Monitor |  |
| Veto LLD | 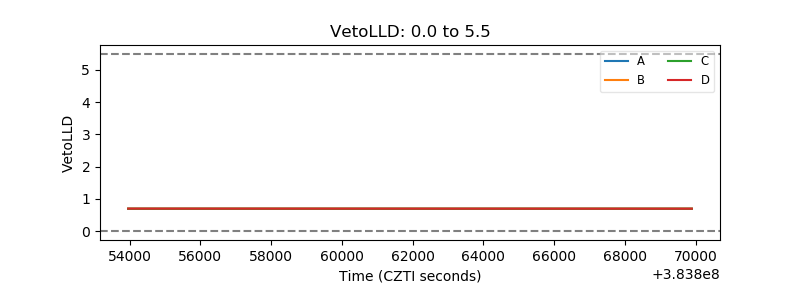 |
| Alpha Counter | 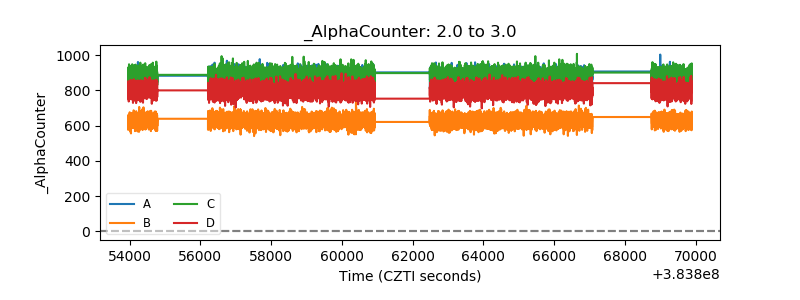 |
| _CPM_Rate | 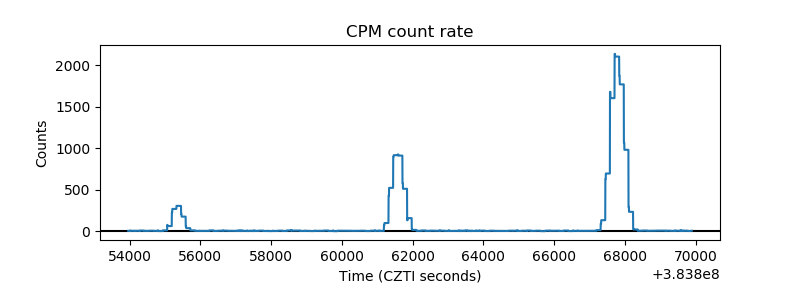 |
| CZT Counter | 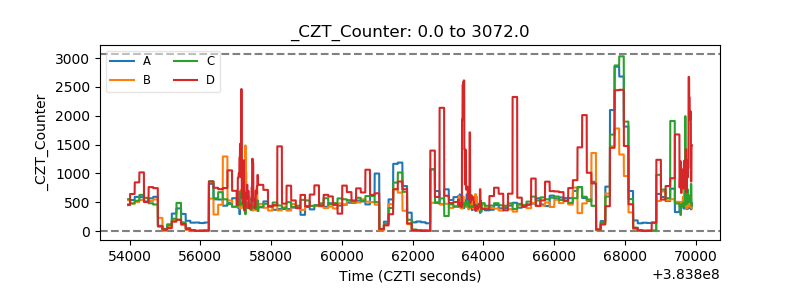 |
| +2.5 Volts monitor |  |
| +5 Volts monitor |  |
| _ROLL_ROT | 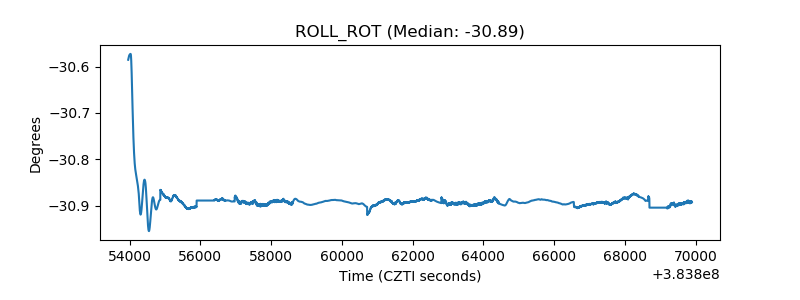 |
| _Roll_DEC | 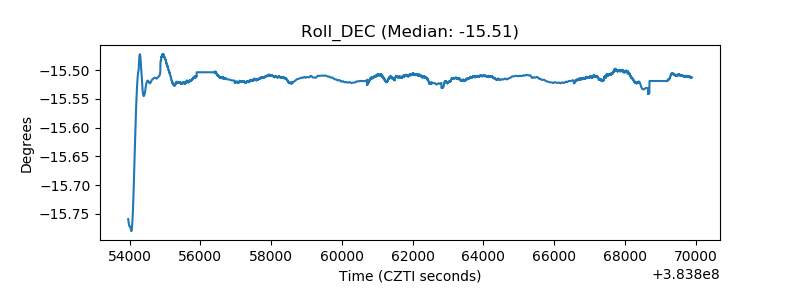 |
| _Roll_RA | 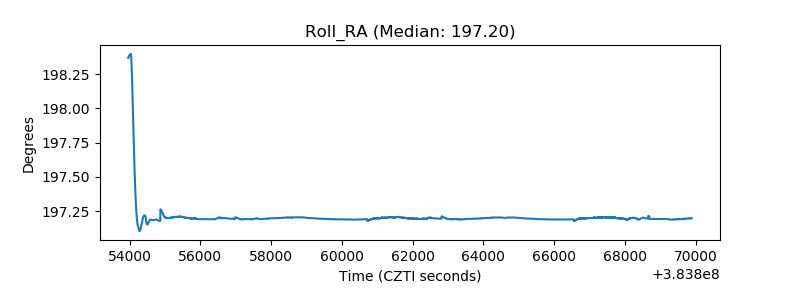 |
| Veto Counter | 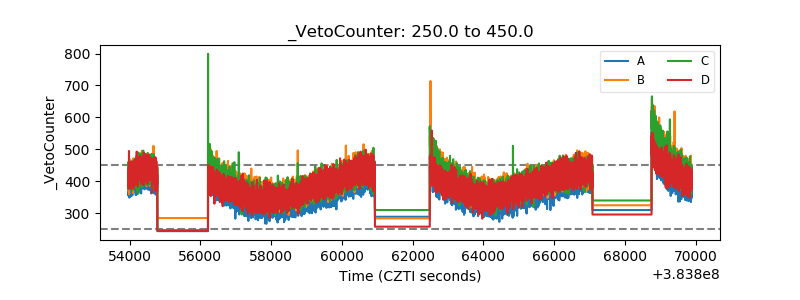 |