| Param | Original file | Final file |
|---|---|---|
| Filename | modeM0/AS1A10_048T04_9000004984_34739cztM0_level2.evt | modeM0/AS1A10_048T04_9000004984_34739cztM0_level2_quad_clean.evt |
| Size (bytes) | 504,642,240 | 72,455,040 |
| Size | 481.3 MB | 69.1 MB |
| Events in quadrant A | 2,869,366 | 481,549 |
| Events in quadrant B | 3,371,121 | 493,010 |
| Events in quadrant C | 2,998,497 | 487,500 |
| Events in quadrant D | 5,676,473 | 351,958 |
| Mode SS | |||
|---|---|---|---|
| Quadrant | BADHDUFLAG | Total packets | Discarded packets |
| A | 0 | 110 | 0 |
| B | 0 | 110 | 0 |
| C | 0 | 110 | 0 |
| D | 0 | 110 | 0 |
| Mode M0 | |||
|---|---|---|---|
| Quadrant | BADHDUFLAG | Total packets | Discarded packets |
| A | 0 | 11755 | 2 |
| B | 0 | 13430 | 1 |
| C | 0 | 11910 | 1 |
| D | 0 | 20690 | 1 |
| Mode M9 | |||
|---|---|---|---|
| Quadrant | BADHDUFLAG | Total packets | Discarded packets |
| A | 0 | 29 | 0 |
| B | 0 | 29 | 0 |
| C | 0 | 29 | 0 |
| D | 0 | 30 | 0 |
| Quadrant | Total seconds | Saturated seconds | Saturation percentage |
|---|---|---|---|
| A | 5425 | 14 | 0.258065% |
| B | 5425 | 69 | 1.271889% |
| C | 5425 | 26 | 0.479263% |
| D | 5425 | 980 | 18.064516% |
Noise dominated data is calculated using 1-second bins in cleaned event files. If a bin has >2000 counts, and if more than 50% of those come from <1% of pixels, then it is considered to be noise-dominated and hence unusable.
| Quadrant | # 1 sec bins | Bins with >0 counts | Bins with >2000 counts | High rate bins dominated by noise | Noise dominated (total time) | Noise dominated (detector-on time) | Marked lightcurve |
|---|---|---|---|---|---|---|---|
| A | 7366 | 5426 | 8 | 8 | 0.11% | 0.15% |  |
| B | 7366 | 5426 | 49 | 49 | 0.67% | 0.90% | 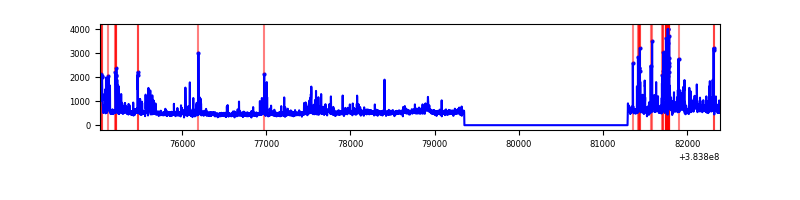 |
| C | 7366 | 5426 | 18 | 18 | 0.24% | 0.33% | 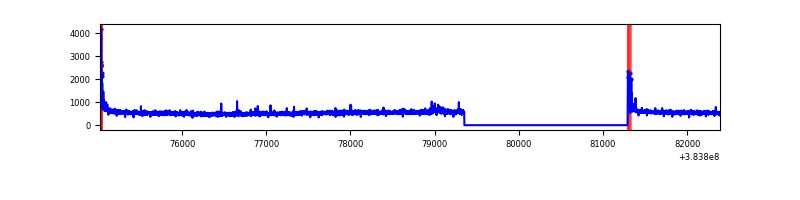 |
| D | 7365 | 5425 | 669 | 669 | 9.08% | 12.33% | 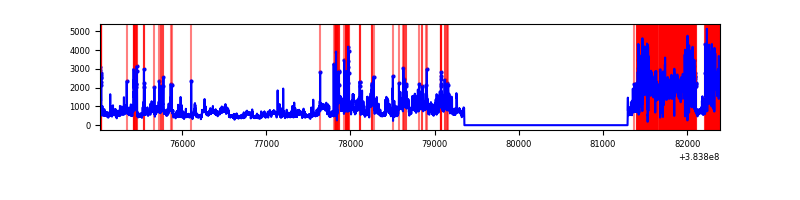 |
Top three noisy pixels from each quadrant. If the there are fewer than three noisy pixels in the level2.evt file, extra rows are filled as -1
| Pixel properties | Quadrant properties | ||||||
|---|---|---|---|---|---|---|---|
| Quadrant | DetID | PixID | Counts | Sigma | Mean | Median | Sigma |
| A | 15 | 223 | 93007 | 684.08 | 681 | 669 | 135.0 |
| A | 10 | 83 | 48555 | 354.76 | 681 | 669 | 135.0 |
| A | 15 | 169 | 42653 | 311.04 | 681 | 669 | 135.0 |
| B | 4 | 171 | 357232 | 2818.19 | 676 | 660 | 126.5 |
| B | 0 | 190 | 152342 | 1198.83 | 676 | 660 | 126.5 |
| B | 5 | 172 | 146059 | 1149.17 | 676 | 660 | 126.5 |
| C | 15 | 214 | 230265 | 1486.03 | 671 | 681 | 154.5 |
| C | 0 | 10 | 93077 | 598.05 | 671 | 681 | 154.5 |
| C | 14 | 67 | 28136 | 177.71 | 671 | 681 | 154.5 |
| D | 10 | 118 | 1941057 | 13845.26 | 579 | 566 | 140.2 |
| D | 8 | 195 | 636613 | 4538.15 | 579 | 566 | 140.2 |
| D | 1 | 52 | 594238 | 4235.81 | 579 | 566 | 140.2 |
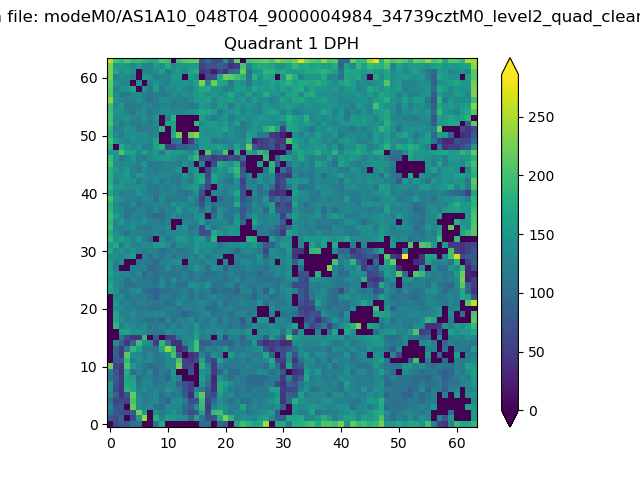
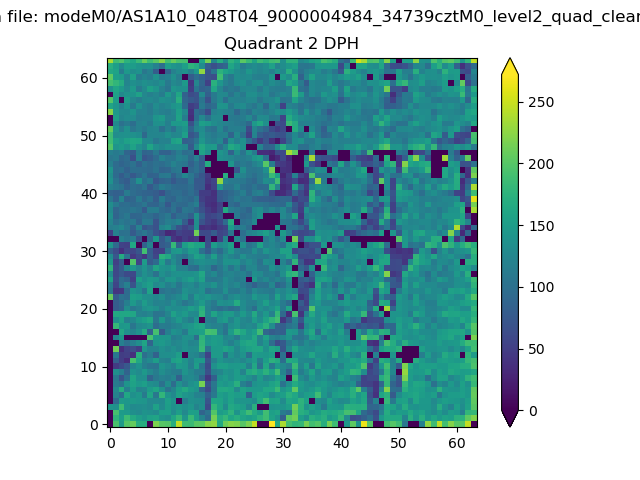
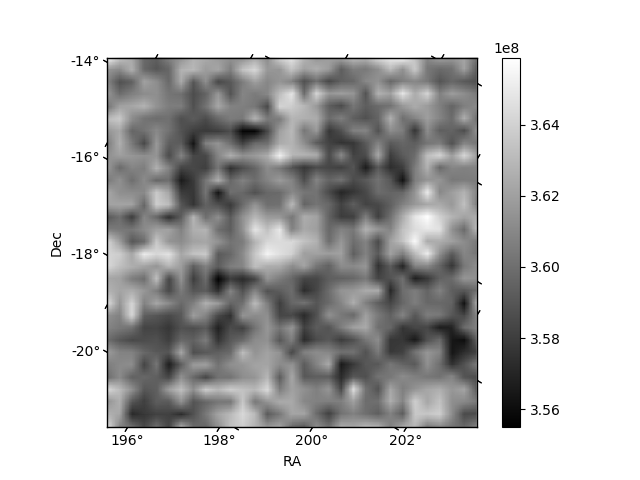
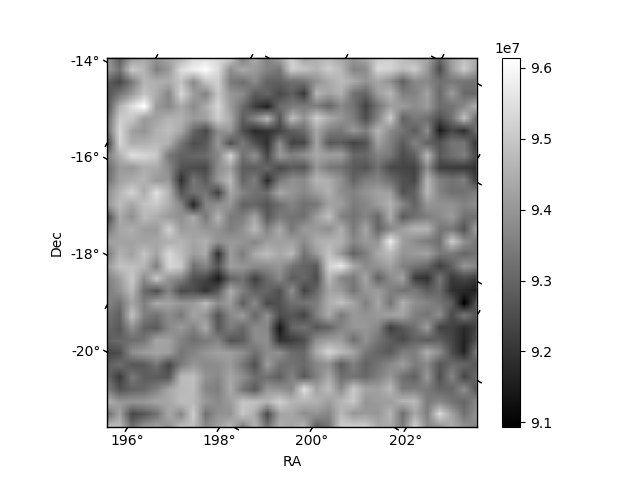
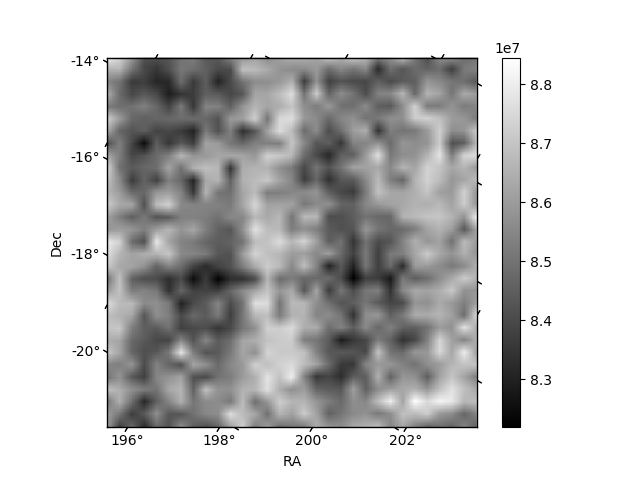
Histogram calculated using DETX and DETY for each event in the final _common_clean file
| Quadrant A | 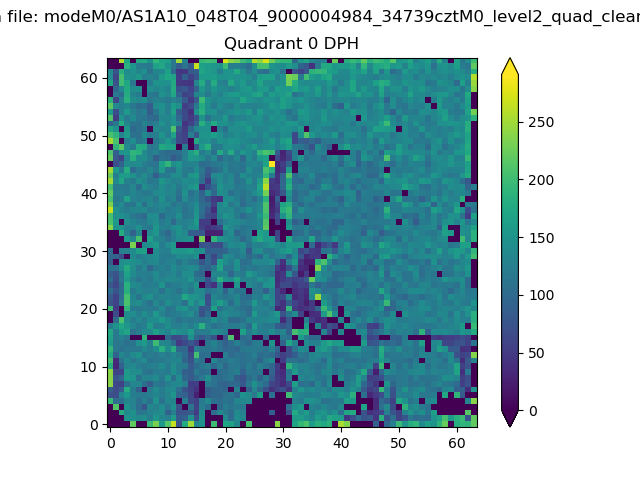 |
 |
Quadrant B |
|---|---|---|---|
| Quadrant D | 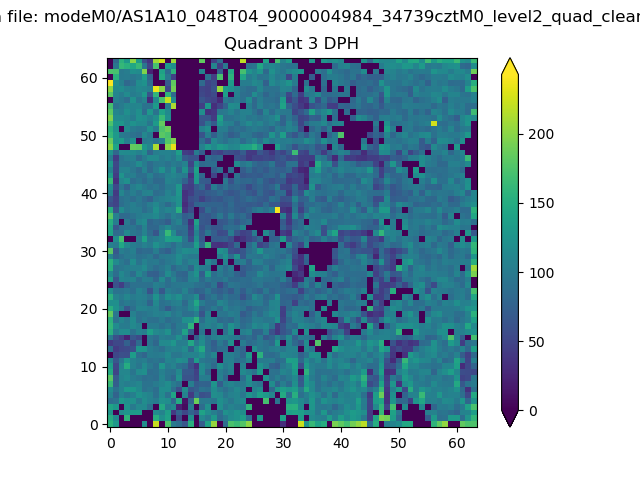 |
 |
Quadrant C |
| Plot type | Count rate plots | Images |
|---|---|---|
| Comparison with Poisson distribution Blue bars denote a histogram of data divided into 1 sec bins. Red curve is a Poisson curve with rate = median count rate of data. |
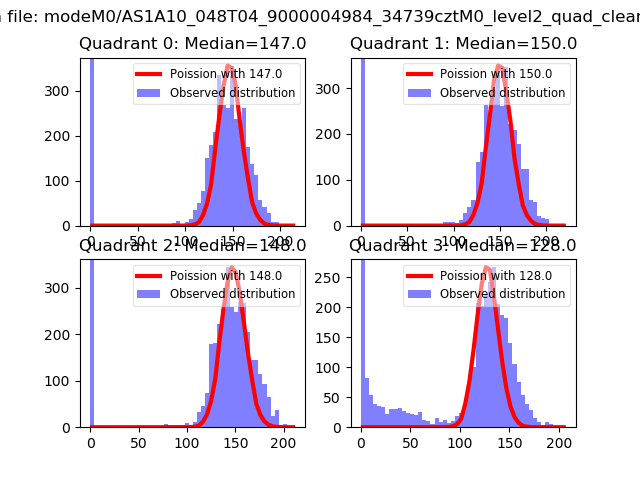 |
 |
| Quadrant-wise count rates Data is divided into 100 sec bins |
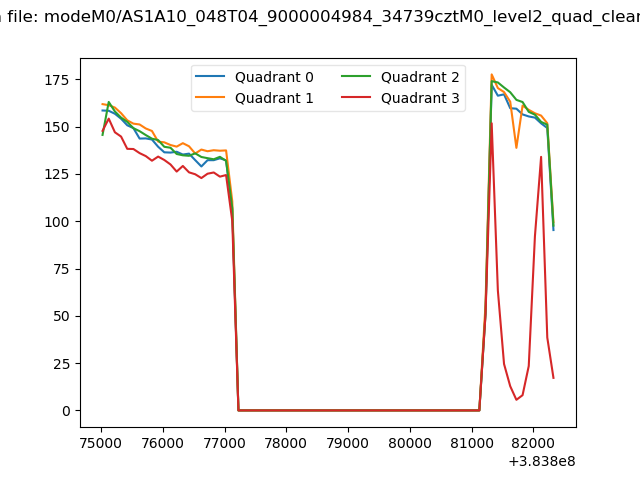 |
|
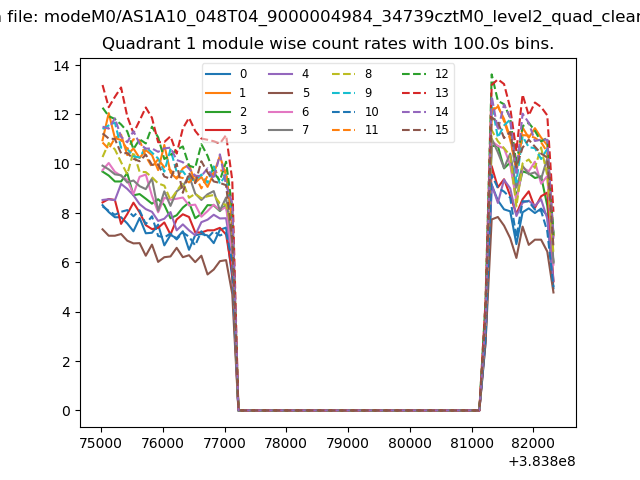
| Module-wise count rates for Quadrant A Data is divided into 100 sec bins |
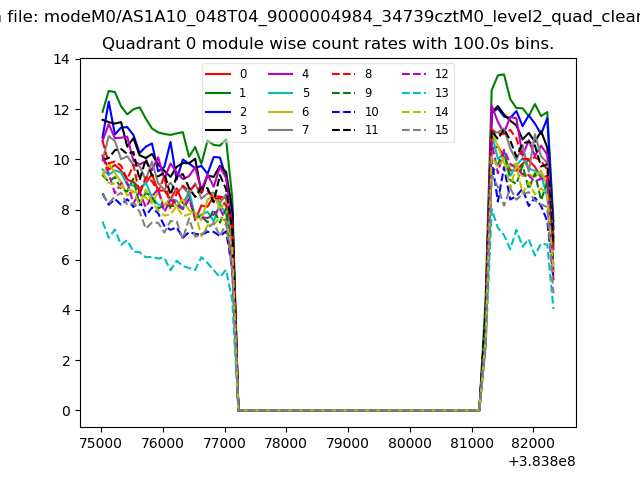 |
 |
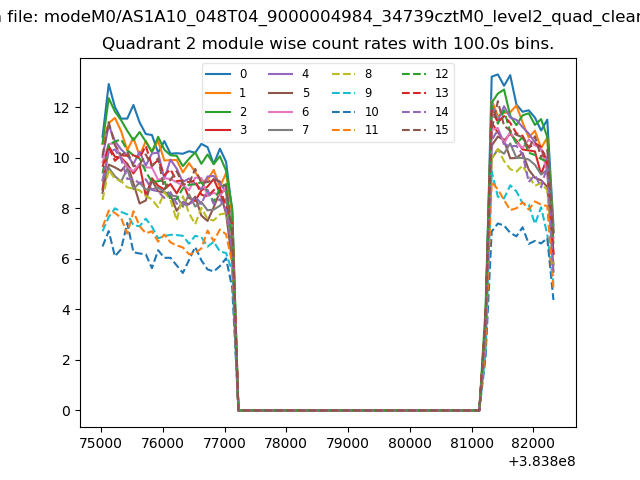
| Module-wise count rates for Quadrant B Data is divided into 100 sec bins |
 |
 |
| Module-wise count rates for Quadrant C Data is divided into 100 sec bins |
 |
 |
| Module-wise count rates for Quadrant D Data is divided into 100 sec bins |
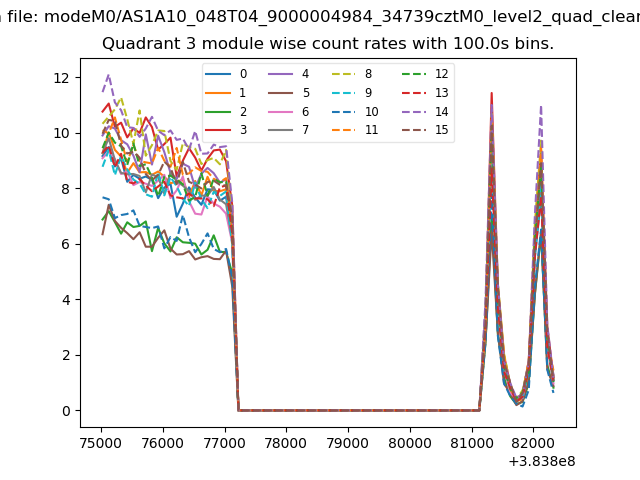 |
 |
| Parameter | Plot |
|---|---|
| CZT HV Monitor | 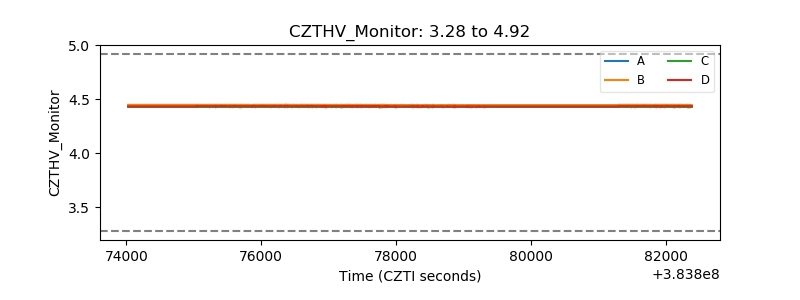 |
| D_VDD | 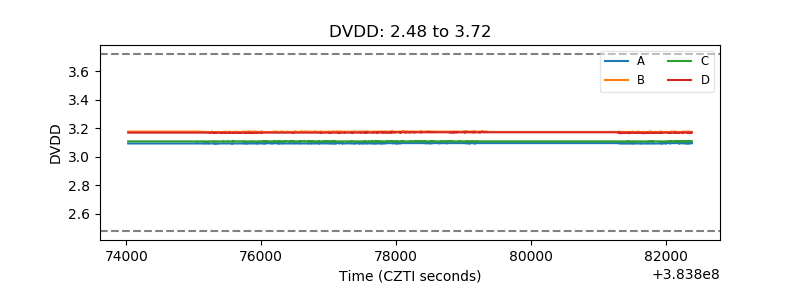 |
| Temperature 1 | 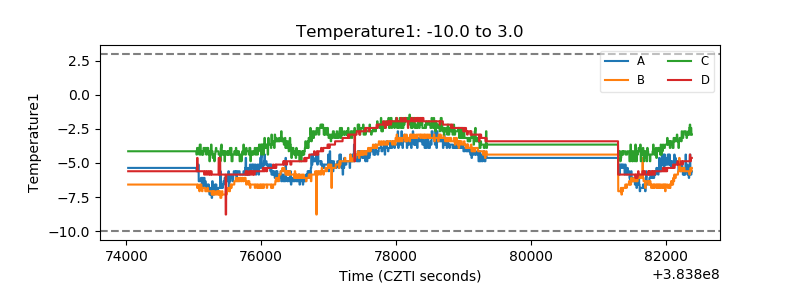 |
| Veto HV Monitor |  |
| Veto LLD | 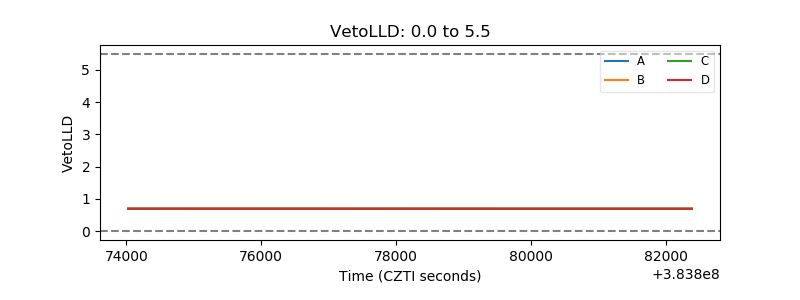 |
| Alpha Counter | 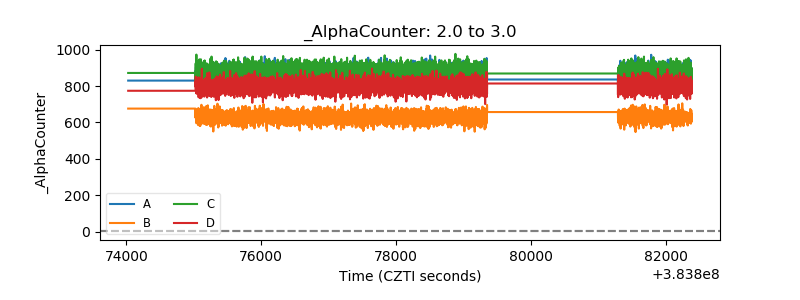 |
| _CPM_Rate | 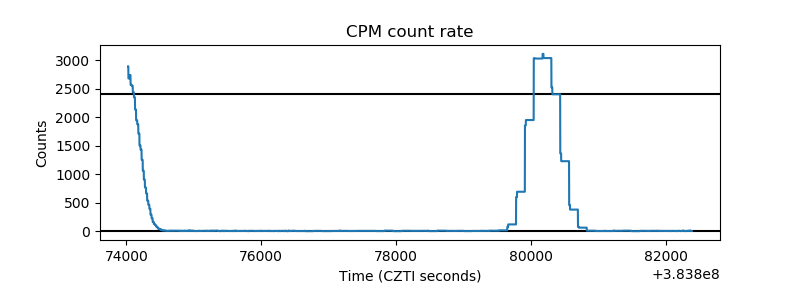 |
| CZT Counter | 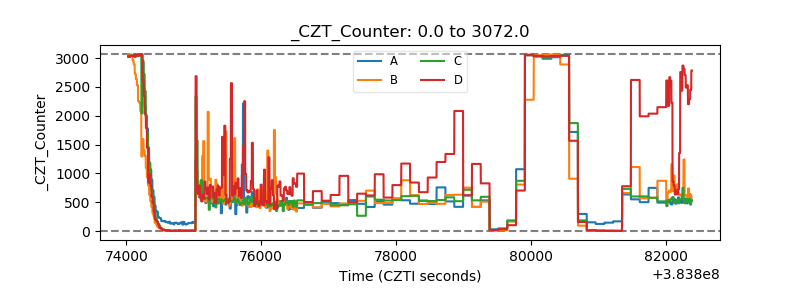 |
| +2.5 Volts monitor |  |
| +5 Volts monitor |  |
| _ROLL_ROT | 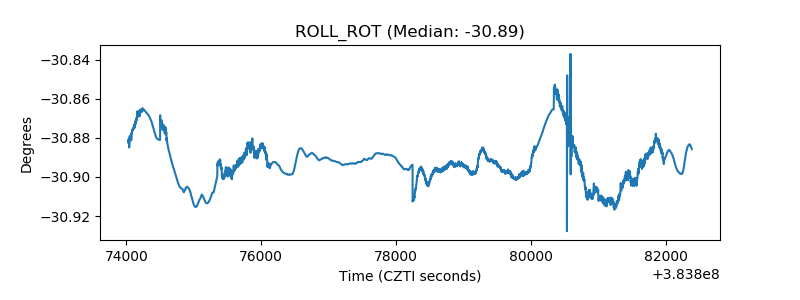 |
| _Roll_DEC | 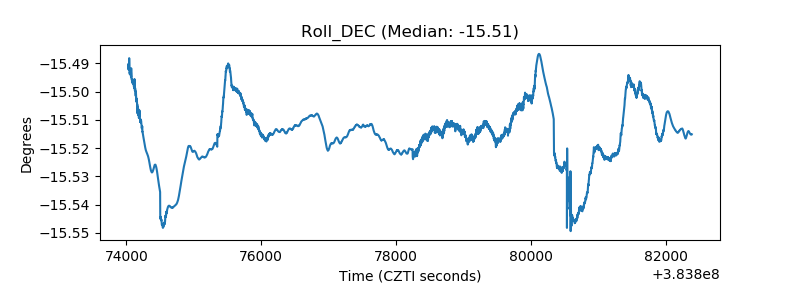 |
| _Roll_RA | 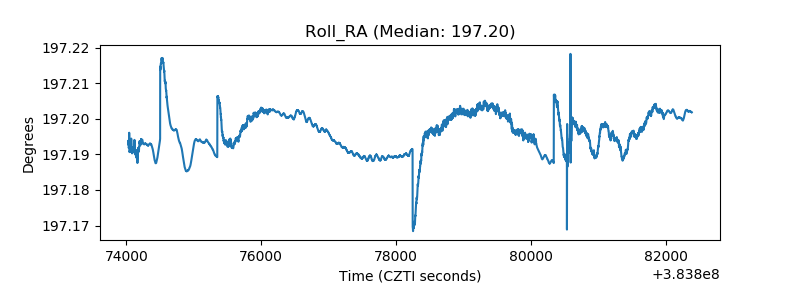 |
| Veto Counter | 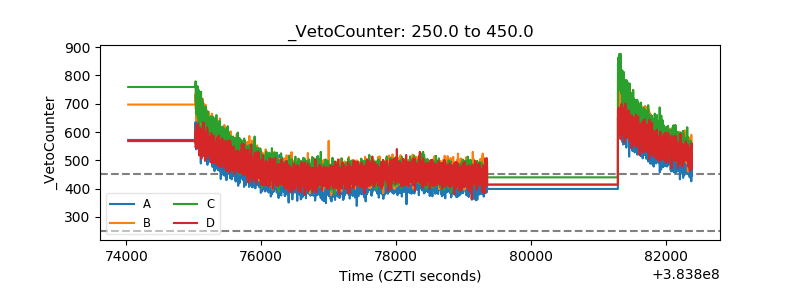 |