| Param | Original file | Final file |
|---|---|---|
| Filename | modeM0/AS1A10_094T38_9000004988cztM0_level2.fits | modeM0/AS1A10_094T38_9000004988cztM0_level2_quad_clean.evt |
| Size (bytes) | 33,117,120 | 22,939,200 |
| Size | 31.6 MB | 21.9 MB |
| Events in quadrant A | 200,580 | 117,117 |
| Events in quadrant B | 188,988 | 109,753 |
| Events in quadrant C | 196,232 | 108,682 |
| Events in quadrant D | 157,708 | 98,787 |
| Mode M9 | |||
|---|---|---|---|
| Quadrant | BADHDUFLAG | Total packets | Discarded packets |
| A | 0 | 13 | 0 |
| B | 0 | 13 | 0 |
| C | 0 | 13 | 0 |
| D | 0 | 13 | 0 |
| Mode M0 | |||
|---|---|---|---|
| Quadrant | BADHDUFLAG | Total packets | Discarded packets |
| A | 0 | 7546 | 0 |
| B | 0 | 8847 | 0 |
| C | 0 | 7857 | 0 |
| D | 0 | 13697 | 0 |
| Mode SS | |||
|---|---|---|---|
| Quadrant | BADHDUFLAG | Total packets | Discarded packets |
| A | 0 | 74 | 0 |
| B | 0 | 74 | 0 |
| C | 0 | 74 | 0 |
| D | 0 | 74 | 0 |
| Quadrant | Total seconds | Saturated seconds | Saturation percentage |
|---|---|---|---|
| A | 3669 | 6 | 0.163532% |
| B | 3669 | 150 | 4.088307% |
| C | 3669 | 28 | 0.763151% |
| D | 3669 | 451 | 12.292178% |
Noise dominated data is calculated using 1-second bins in cleaned event files. If a bin has >2000 counts, and if more than 50% of those come from <1% of pixels, then it is considered to be noise-dominated and hence unusable.
| Quadrant | # 1 sec bins | Bins with >0 counts | Bins with >2000 counts | High rate bins dominated by noise | Noise dominated (total time) | Noise dominated (detector-on time) | Marked lightcurve |
|---|---|---|---|---|---|---|---|
| A | 4981 | 3669 | 0 | 0 | 0.00% | 0.00% |  |
| B | 4981 | 3669 | 0 | 0 | 0.00% | 0.00% |  |
| C | 4981 | 3669 | 0 | 0 | 0.00% | 0.00% |  |
| D | 4981 | 3663 | 0 | 0 | 0.00% | 0.00% |  |
Top three noisy pixels from each quadrant. If the there are fewer than three noisy pixels in the level2.evt file, extra rows are filled as -1
| Pixel properties | Quadrant properties | ||||||
|---|---|---|---|---|---|---|---|
| Quadrant | DetID | PixID | Counts | Sigma | Mean | Median | Sigma |
| A | 0 | 29 | 172 | 8.23 | 52 | 49 | 15.0 |
| A | 0 | 30 | 172 | 8.23 | 52 | 49 | 15.0 |
| A | 9 | 19 | 166 | 7.82 | 52 | 49 | 15.0 |
| B | 2 | 9 | 150 | 8.62 | 50 | 48 | 11.8 |
| B | 5 | 128 | 142 | 7.95 | 50 | 48 | 11.8 |
| B | 5 | 232 | 135 | 7.35 | 50 | 48 | 11.8 |
| C | 1 | 81 | 171 | 8.27 | 51 | 48 | 14.9 |
| C | 1 | 80 | 156 | 7.26 | 51 | 48 | 14.9 |
| C | 3 | 187 | 154 | 7.13 | 51 | 48 | 14.9 |
| D | 6 | 83 | 123 | 6.02 | 44 | 40 | 13.8 |
| D | 6 | 192 | 118 | 5.66 | 44 | 40 | 13.8 |
| D | 6 | 67 | 118 | 5.66 | 44 | 40 | 13.8 |
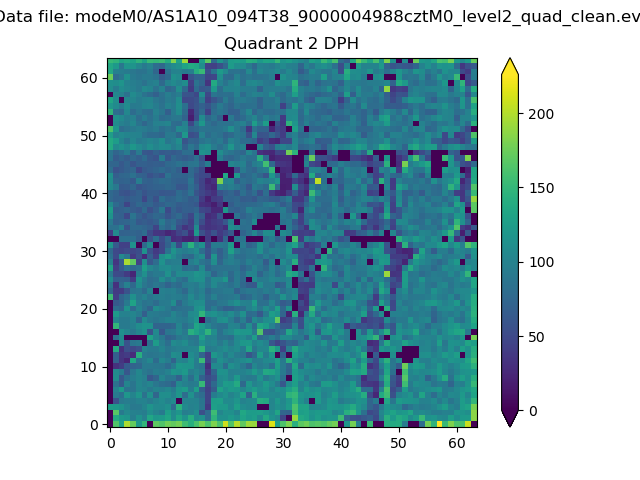
Histogram calculated using DETX and DETY for each event in the final _common_clean file
| Quadrant A | 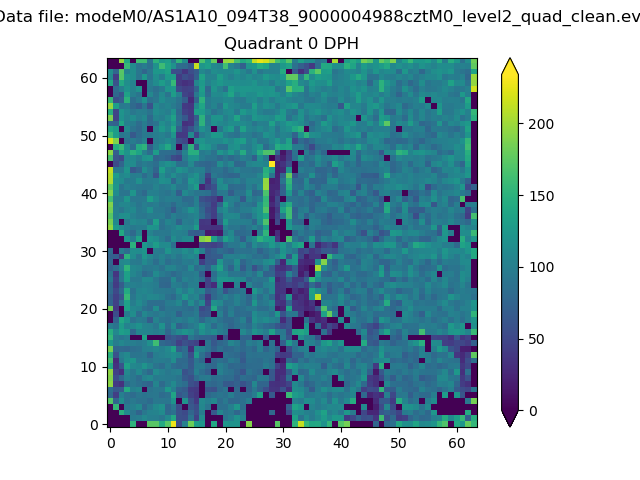 |
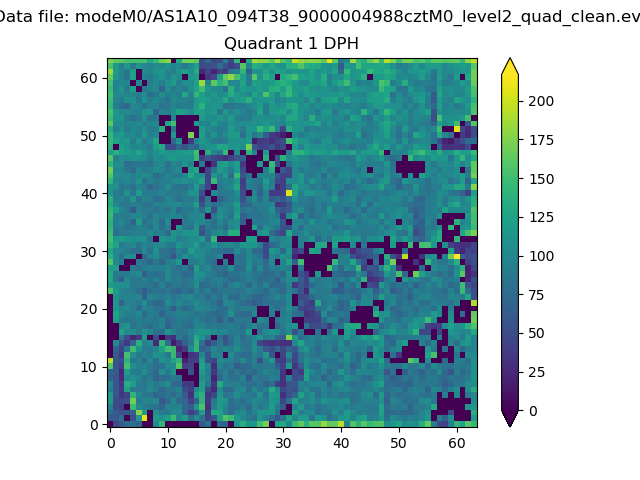 |
Quadrant B |
|---|---|---|---|
| Quadrant D | 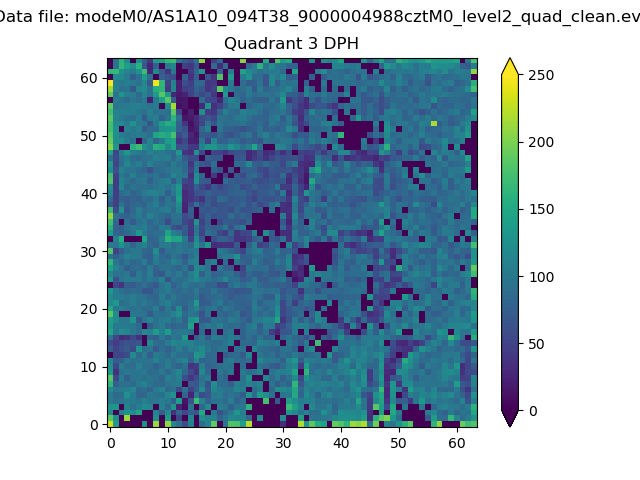 |
 |
Quadrant C |
| Plot type | Count rate plots | Images |
|---|---|---|
| Comparison with Poisson distribution Blue bars denote a histogram of data divided into 1 sec bins. Red curve is a Poisson curve with rate = median count rate of data. |
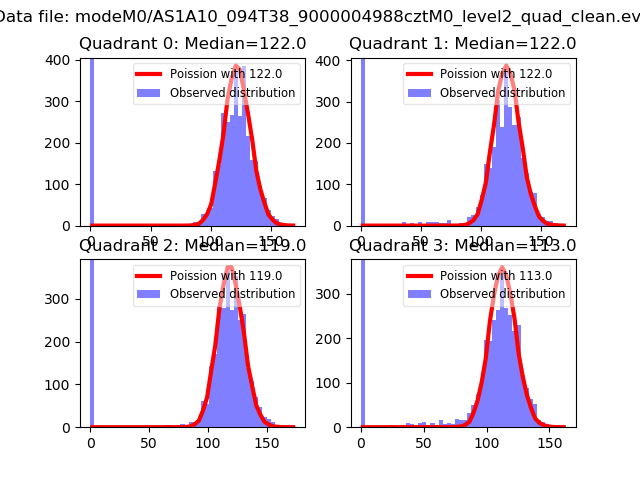 |
 |
| Quadrant-wise count rates Data is divided into 100 sec bins |
 |
|
| Module-wise count rates for Quadrant A Data is divided into 100 sec bins |
 |
 |
| Module-wise count rates for Quadrant B Data is divided into 100 sec bins |
 |
 |
| Module-wise count rates for Quadrant C Data is divided into 100 sec bins |
 |
 |
| Module-wise count rates for Quadrant D Data is divided into 100 sec bins |
 |
 |
| Parameter | Plot |
|---|---|
| CZT HV Monitor |  |
| D_VDD | 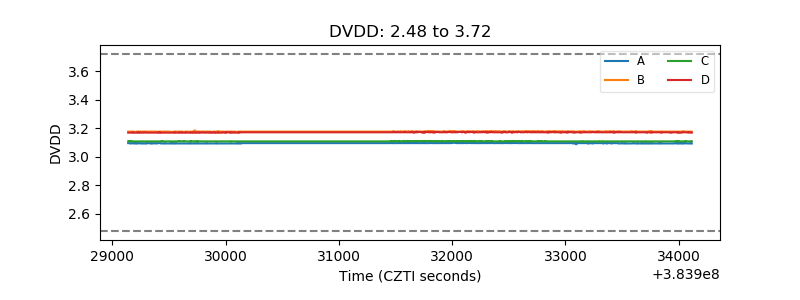 |
| Temperature 1 |  |
| Veto HV Monitor | 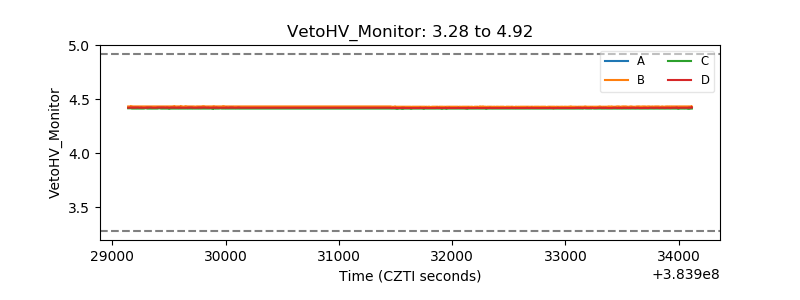 |
| Veto LLD |  |
| Alpha Counter |  |
| _CPM_Rate | 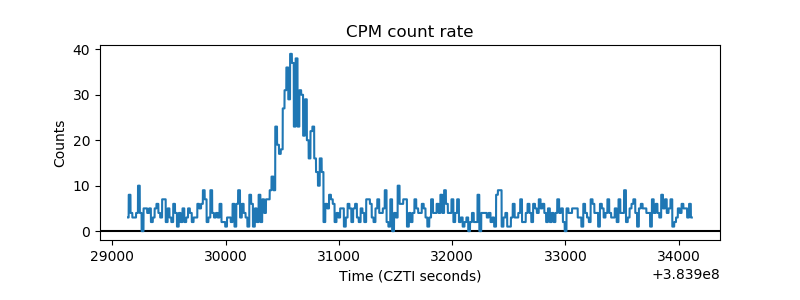 |
| CZT Counter |  |
| +2.5 Volts monitor | 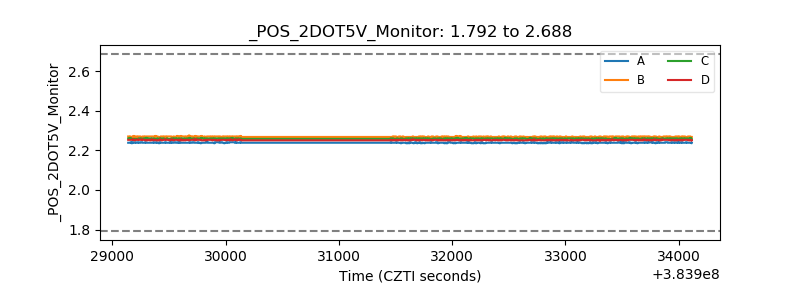 |
| +5 Volts monitor |  |
| _ROLL_ROT |  |
| _Roll_DEC | 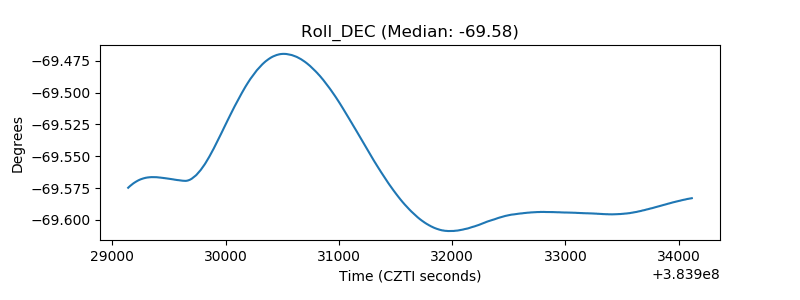 |
| _Roll_RA |  |
| Veto Counter | 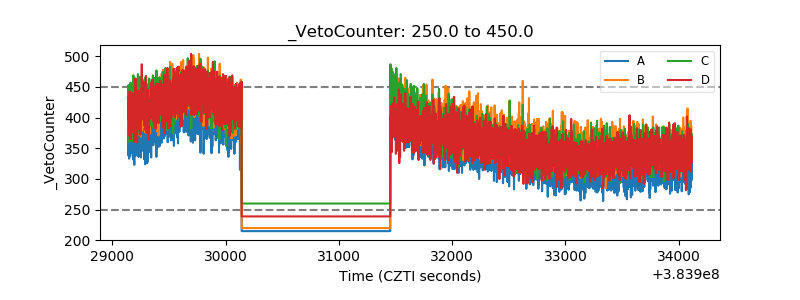 |