| Param | Original file | Final file |
|---|---|---|
| Filename | modeM0/AS1C07_004T01_9000004990_34749cztM0_level2.evt | modeM0/AS1C07_004T01_9000004990_34749cztM0_level2_quad_clean.evt |
| Size (bytes) | 847,022,400 | 70,577,280 |
| Size | 807.8 MB | 67.3 MB |
| Events in quadrant A | 3,660,625 | 438,947 |
| Events in quadrant B | 3,968,829 | 446,767 |
| Events in quadrant C | 3,823,145 | 441,506 |
| Events in quadrant D | 13,701,048 | 295,649 |
| Mode M9 | |||
|---|---|---|---|
| Quadrant | BADHDUFLAG | Total packets | Discarded packets |
| A | 0 | 30 | 0 |
| B | 0 | 30 | 0 |
| C | 0 | 30 | 0 |
| D | 0 | 30 | 0 |
| Mode M0 | |||
|---|---|---|---|
| Quadrant | BADHDUFLAG | Total packets | Discarded packets |
| A | 0 | 15567 | 2 |
| B | 0 | 16412 | 1 |
| C | 0 | 15863 | 1 |
| D | 0 | 45844 | 1 |
| Mode SS | |||
|---|---|---|---|
| Quadrant | BADHDUFLAG | Total packets | Discarded packets |
| A | 0 | 148 | 0 |
| B | 0 | 148 | 0 |
| C | 0 | 148 | 0 |
| D | 0 | 148 | 0 |
| Quadrant | Total seconds | Saturated seconds | Saturation percentage |
|---|---|---|---|
| A | 7384 | 30 | 0.406284% |
| B | 7384 | 74 | 1.002167% |
| C | 7384 | 26 | 0.352113% |
| D | 7384 | 4249 | 57.543337% |
Noise dominated data is calculated using 1-second bins in cleaned event files. If a bin has >2000 counts, and if more than 50% of those come from <1% of pixels, then it is considered to be noise-dominated and hence unusable.
| Quadrant | # 1 sec bins | Bins with >0 counts | Bins with >2000 counts | High rate bins dominated by noise | Noise dominated (total time) | Noise dominated (detector-on time) | Marked lightcurve |
|---|---|---|---|---|---|---|---|
| A | 10281 | 7386 | 7 | 7 | 0.07% | 0.09% | 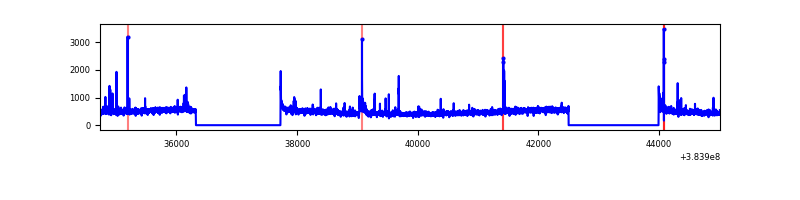 |
| B | 10281 | 7386 | 39 | 39 | 0.38% | 0.53% | 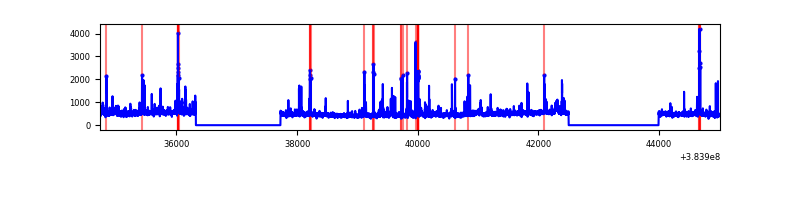 |
| C | 10281 | 7386 | 14 | 14 | 0.14% | 0.19% | 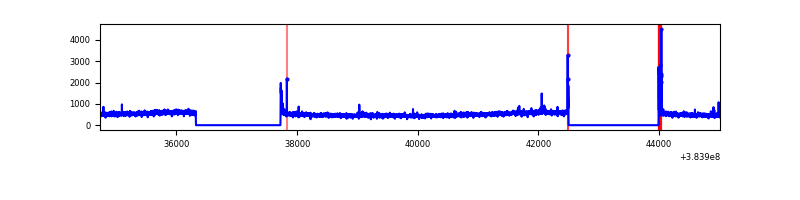 |
| D | 10281 | 7386 | 3917 | 3917 | 38.10% | 53.03% | 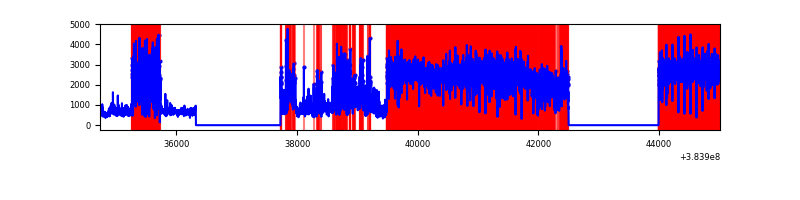 |
Top three noisy pixels from each quadrant. If the there are fewer than three noisy pixels in the level2.evt file, extra rows are filled as -1
| Pixel properties | Quadrant properties | ||||||
|---|---|---|---|---|---|---|---|
| Quadrant | DetID | PixID | Counts | Sigma | Mean | Median | Sigma |
| A | 15 | 223 | 103025 | 578.41 | 873 | 856 | 176.6 |
| A | 9 | 143 | 72006 | 402.8 | 873 | 856 | 176.6 |
| A | 10 | 83 | 55666 | 310.3 | 873 | 856 | 176.6 |
| B | 5 | 255 | 303134 | 1810.43 | 873 | 850 | 167.0 |
| B | 0 | 190 | 143468 | 854.16 | 873 | 850 | 167.0 |
| B | 5 | 172 | 42556 | 249.78 | 873 | 850 | 167.0 |
| C | 15 | 214 | 312302 | 1540.67 | 855 | 859 | 202.1 |
| C | 14 | 67 | 69371 | 338.92 | 855 | 859 | 202.1 |
| C | 0 | 10 | 69331 | 338.72 | 855 | 859 | 202.1 |
| D | 1 | 52 | 7594935 | 48997.55 | 627 | 609 | 155.0 |
| D | 2 | 250 | 2137897 | 13789.49 | 627 | 609 | 155.0 |
| D | 8 | 195 | 650639 | 4193.9 | 627 | 609 | 155.0 |
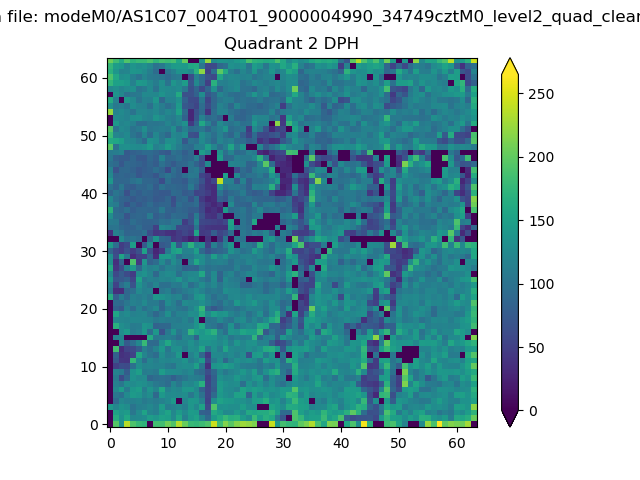
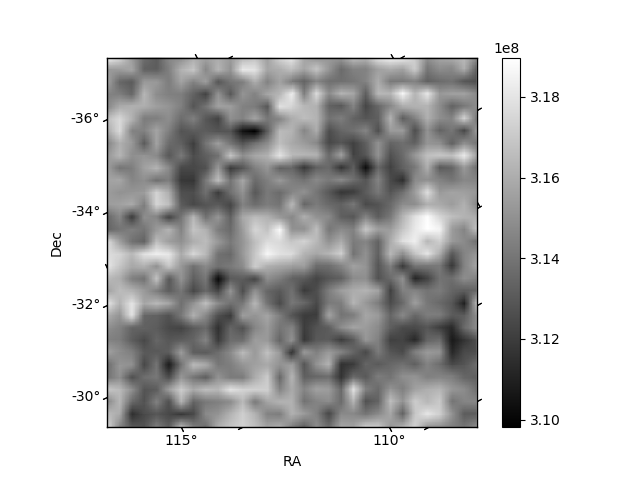
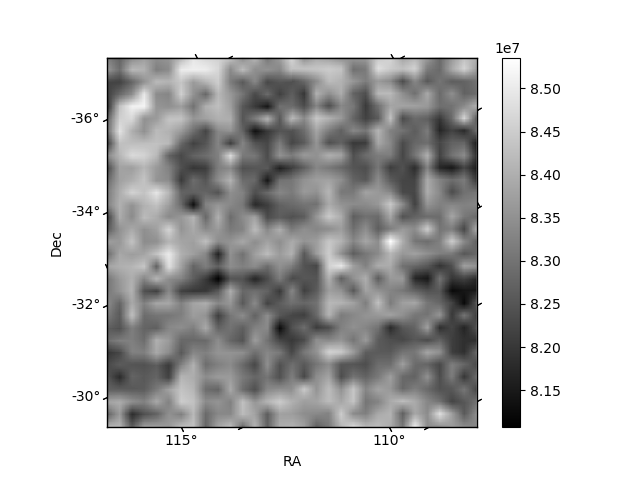
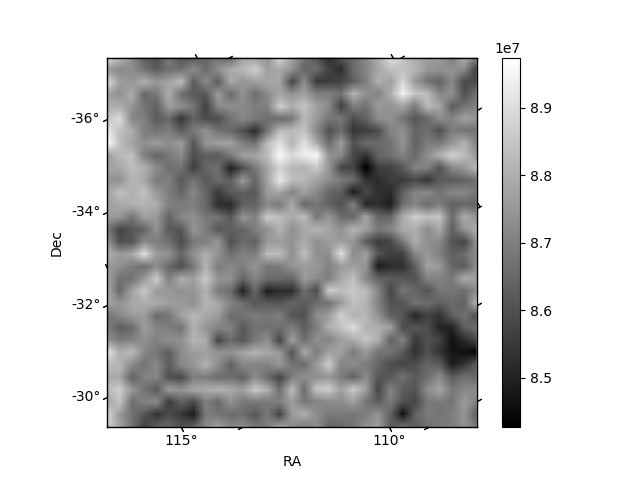
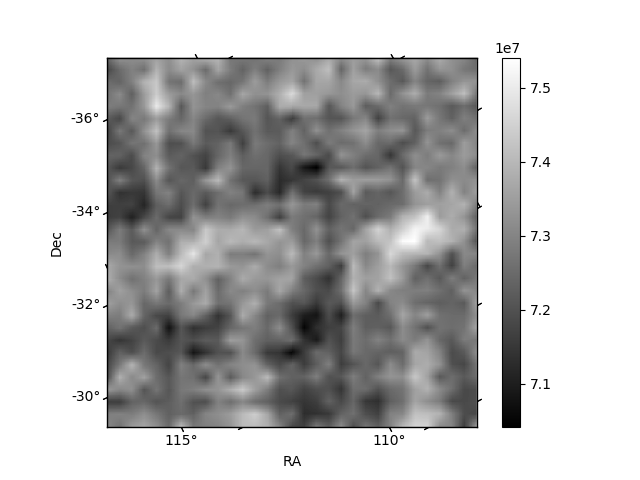
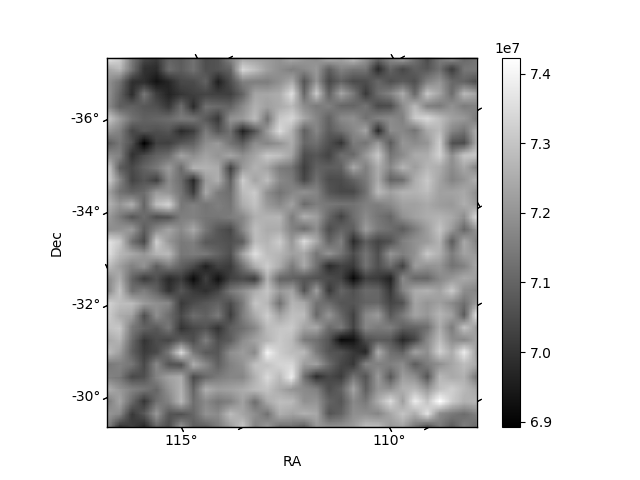
Histogram calculated using DETX and DETY for each event in the final _common_clean file
| Quadrant A | 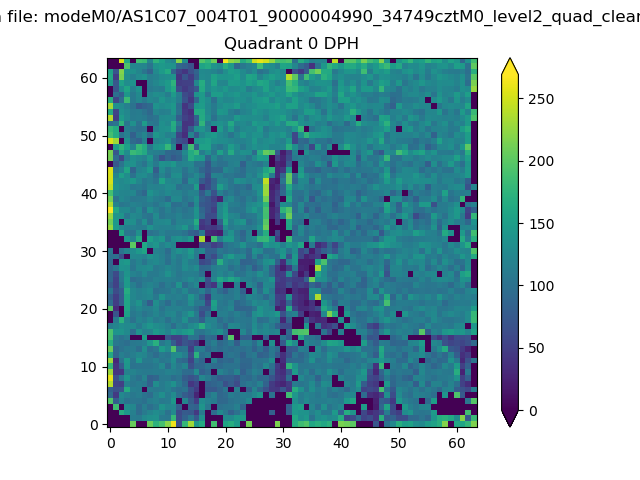 |
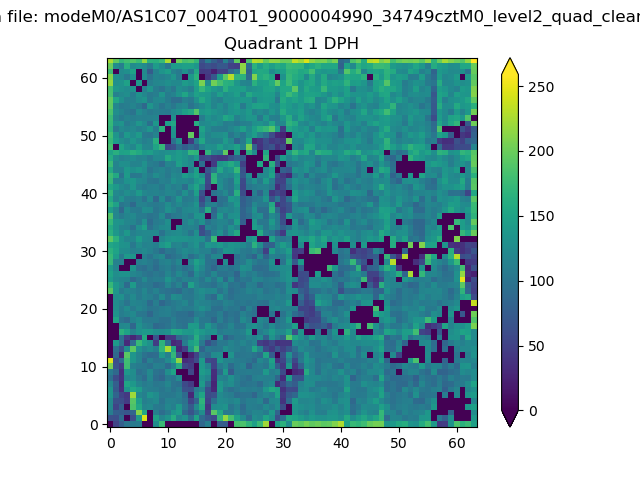 |
Quadrant B |
|---|---|---|---|
| Quadrant D | 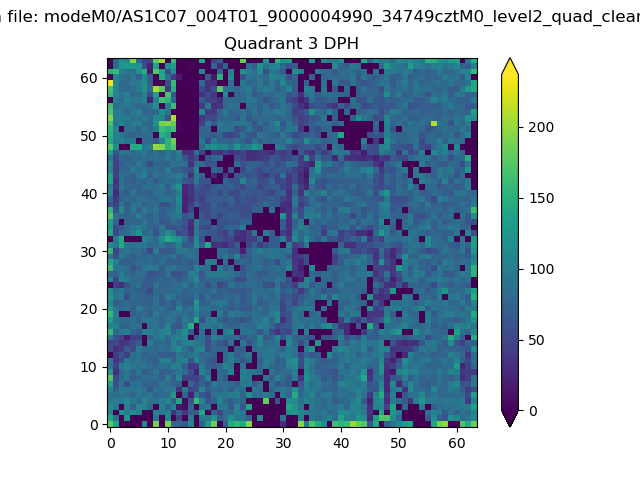 |
 |
Quadrant C |
| Plot type | Count rate plots | Images |
|---|---|---|
| Comparison with Poisson distribution Blue bars denote a histogram of data divided into 1 sec bins. Red curve is a Poisson curve with rate = median count rate of data. |
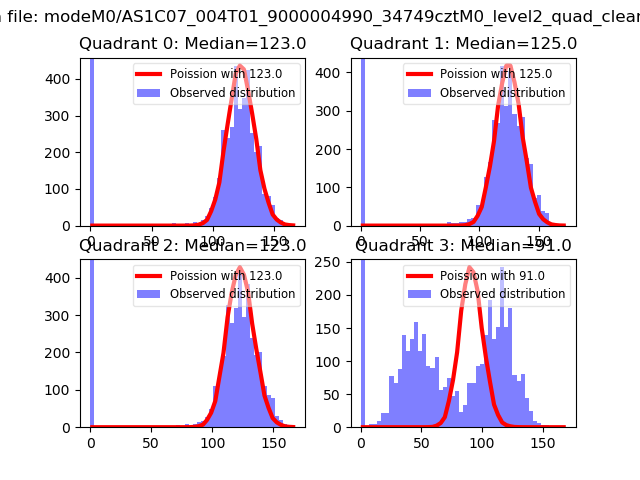 |
 |
| Quadrant-wise count rates Data is divided into 100 sec bins |
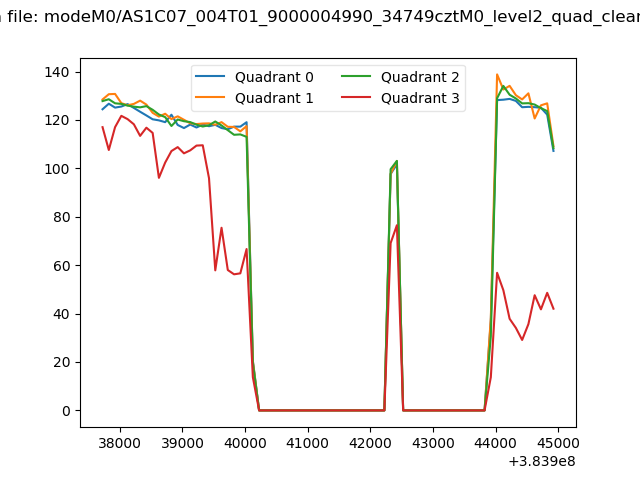 |
|
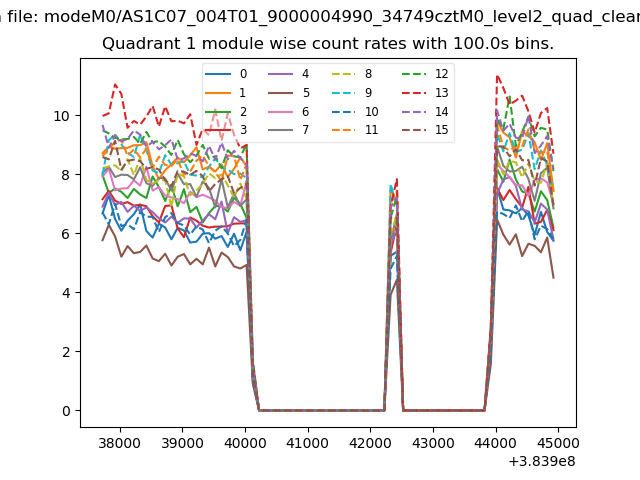
| Module-wise count rates for Quadrant A Data is divided into 100 sec bins |
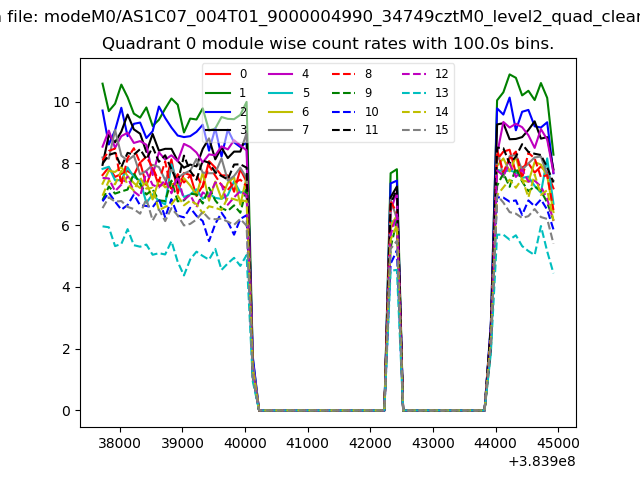 |
 |
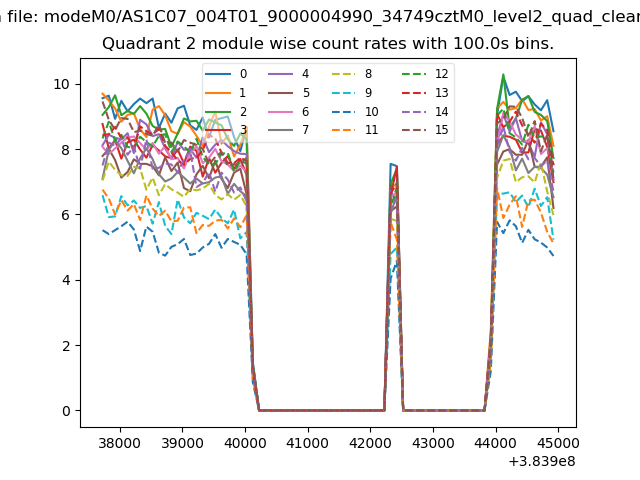
| Module-wise count rates for Quadrant B Data is divided into 100 sec bins |
 |
 |
| Module-wise count rates for Quadrant C Data is divided into 100 sec bins |
 |
 |
| Module-wise count rates for Quadrant D Data is divided into 100 sec bins |
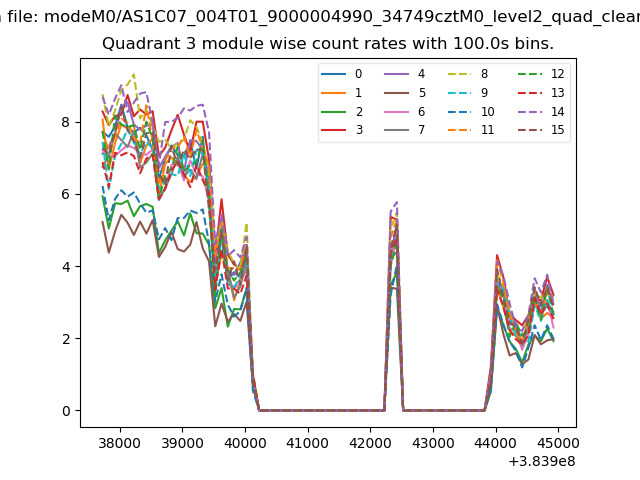 |
 |
| Parameter | Plot |
|---|---|
| CZT HV Monitor | 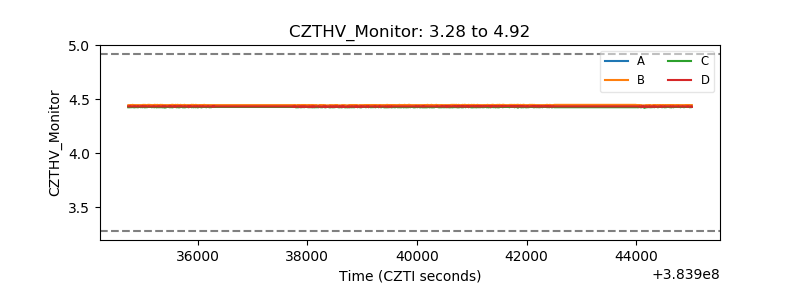 |
| D_VDD | 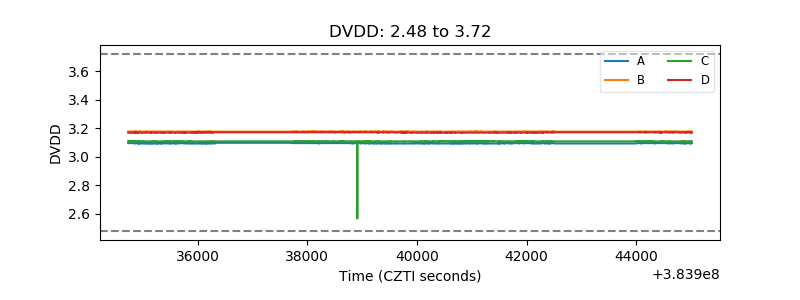 |
| Temperature 1 | 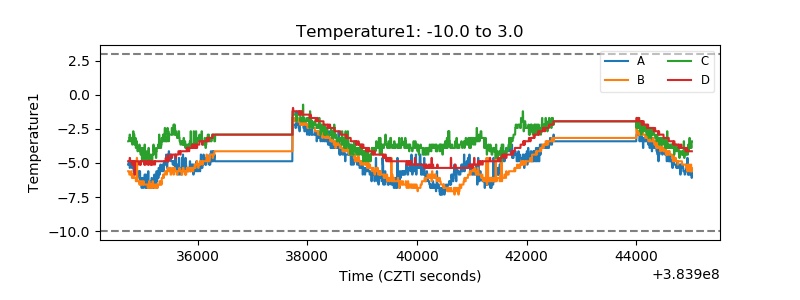 |
| Veto HV Monitor | 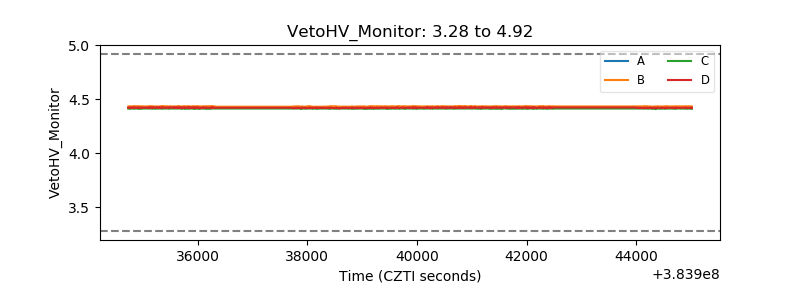 |
| Veto LLD | 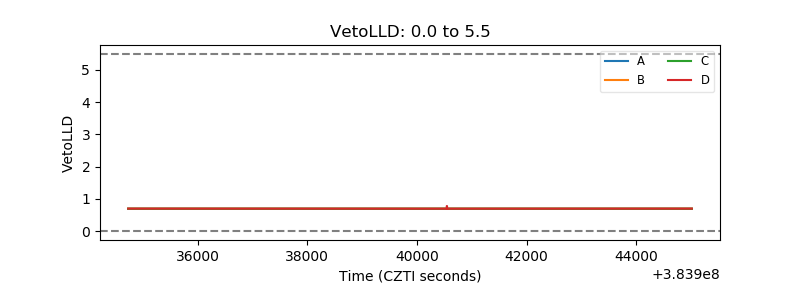 |
| Alpha Counter | 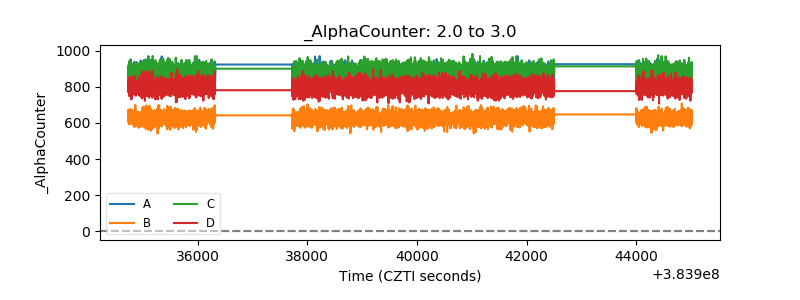 |
| _CPM_Rate | 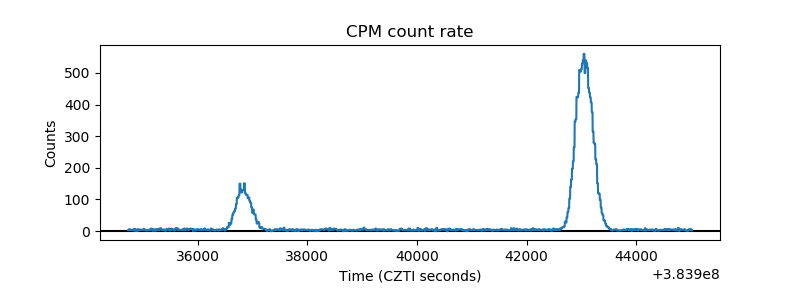 |
| CZT Counter | 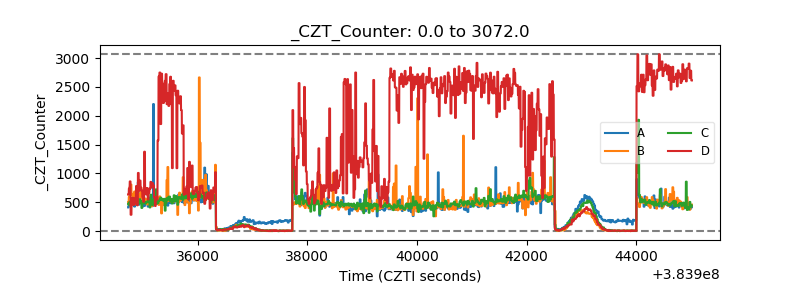 |
| +2.5 Volts monitor |  |
| +5 Volts monitor |  |
| _ROLL_ROT | 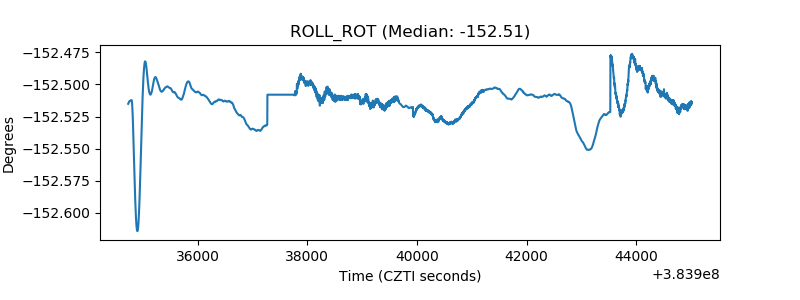 |
| _Roll_DEC | 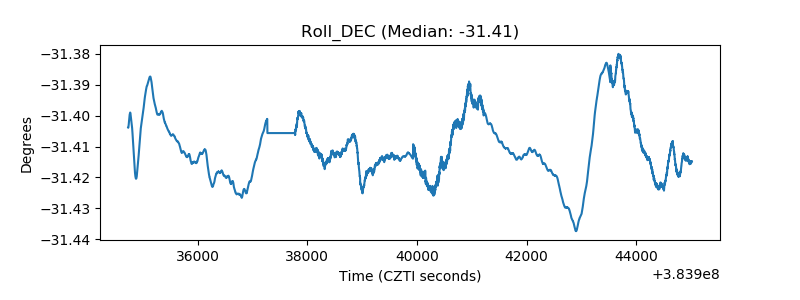 |
| _Roll_RA | 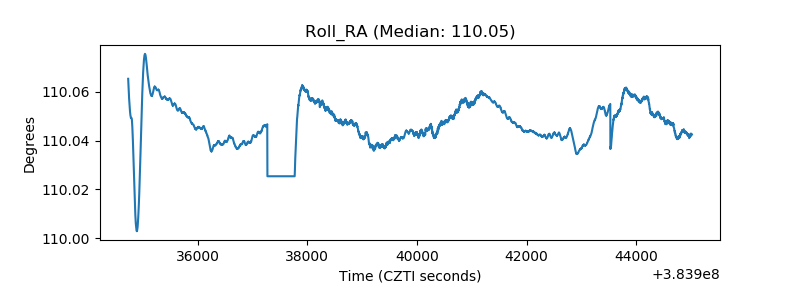 |
| Veto Counter | 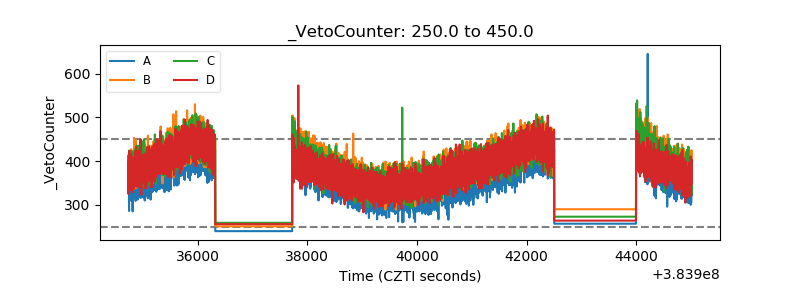 |