| Param | Original file | Final file |
|---|---|---|
| Filename | modeM0/AS1C07_004T01_9000004990_34787cztM0_level2.evt | modeM0/AS1C07_004T01_9000004990_34787cztM0_level2_quad_clean.evt |
| Size (bytes) | 420,652,800 | 63,613,440 |
| Size | 401.2 MB | 60.7 MB |
| Events in quadrant A | 2,481,246 | 393,648 |
| Events in quadrant B | 3,560,424 | 393,569 |
| Events in quadrant C | 2,719,590 | 405,058 |
| Events in quadrant D | 3,633,837 | 378,110 |
| Mode M9 | |||
|---|---|---|---|
| Quadrant | BADHDUFLAG | Total packets | Discarded packets |
| A | 0 | 34 | 0 |
| B | 0 | 34 | 0 |
| C | 0 | 34 | 0 |
| D | 0 | 35 | 0 |
| Mode M0 | |||
|---|---|---|---|
| Quadrant | BADHDUFLAG | Total packets | Discarded packets |
| A | 0 | 10370 | 3 |
| B | 0 | 13735 | 2 |
| C | 0 | 10820 | 2 |
| D | 0 | 14161 | 2 |
| Mode SS | |||
|---|---|---|---|
| Quadrant | BADHDUFLAG | Total packets | Discarded packets |
| A | 0 | 104 | 0 |
| B | 0 | 104 | 0 |
| C | 0 | 104 | 0 |
| D | 0 | 104 | 0 |
| Quadrant | Total seconds | Saturated seconds | Saturation percentage |
|---|---|---|---|
| A | 5070 | 12 | 0.236686% |
| B | 5070 | 288 | 5.680473% |
| C | 5070 | 38 | 0.749507% |
| D | 5070 | 57 | 1.124260% |
Noise dominated data is calculated using 1-second bins in cleaned event files. If a bin has >2000 counts, and if more than 50% of those come from <1% of pixels, then it is considered to be noise-dominated and hence unusable.
| Quadrant | # 1 sec bins | Bins with >0 counts | Bins with >2000 counts | High rate bins dominated by noise | Noise dominated (total time) | Noise dominated (detector-on time) | Marked lightcurve |
|---|---|---|---|---|---|---|---|
| A | 6924 | 5071 | 6 | 6 | 0.09% | 0.12% | 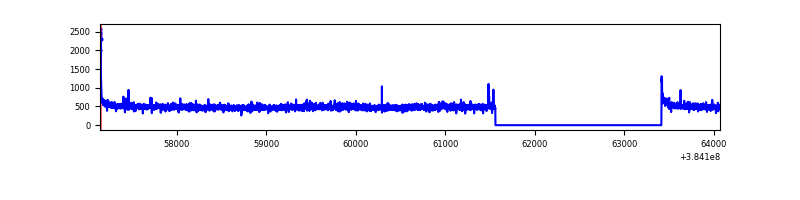 |
| B | 6924 | 5071 | 199 | 199 | 2.87% | 3.92% | 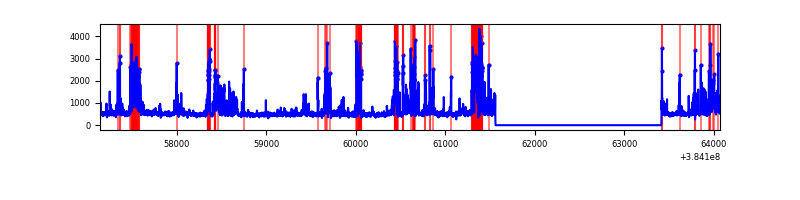 |
| C | 6924 | 5071 | 26 | 26 | 0.38% | 0.51% | 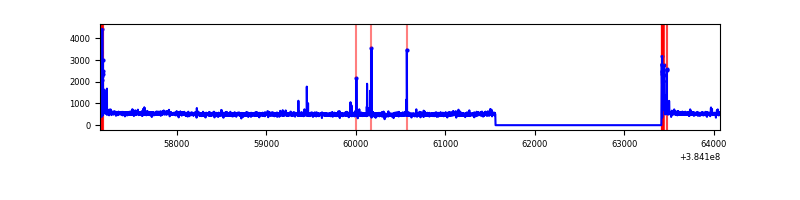 |
| D | 6924 | 5071 | 50 | 50 | 0.72% | 0.99% | 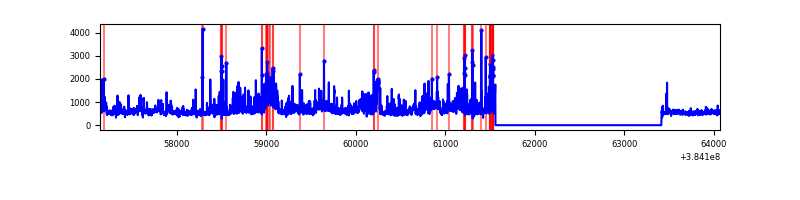 |
Top three noisy pixels from each quadrant. If the there are fewer than three noisy pixels in the level2.evt file, extra rows are filled as -1
| Pixel properties | Quadrant properties | ||||||
|---|---|---|---|---|---|---|---|
| Quadrant | DetID | PixID | Counts | Sigma | Mean | Median | Sigma |
| A | 15 | 169 | 56068 | 450.68 | 607 | 597 | 123.1 |
| A | 10 | 83 | 47169 | 378.38 | 607 | 597 | 123.1 |
| A | 8 | 192 | 16917 | 132.59 | 607 | 597 | 123.1 |
| B | 5 | 172 | 964308 | 8432.85 | 594 | 578 | 114.3 |
| B | 5 | 255 | 112585 | 980.09 | 594 | 578 | 114.3 |
| B | 4 | 232 | 80644 | 700.6 | 594 | 578 | 114.3 |
| C | 15 | 214 | 219757 | 1593.9 | 594 | 601 | 137.5 |
| C | 0 | 10 | 102104 | 738.22 | 594 | 601 | 137.5 |
| C | 15 | 159 | 29708 | 211.69 | 594 | 601 | 137.5 |
| D | 8 | 195 | 885716 | 6086.17 | 591 | 577 | 145.4 |
| D | 2 | 249 | 235552 | 1615.68 | 591 | 577 | 145.4 |
| D | 14 | 52 | 72193 | 492.43 | 591 | 577 | 145.4 |
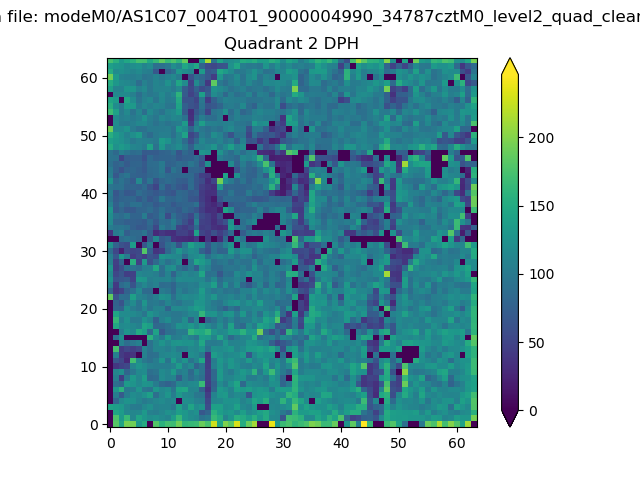
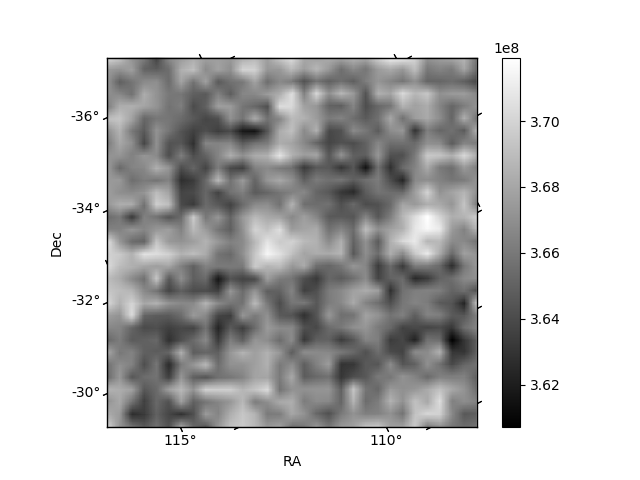
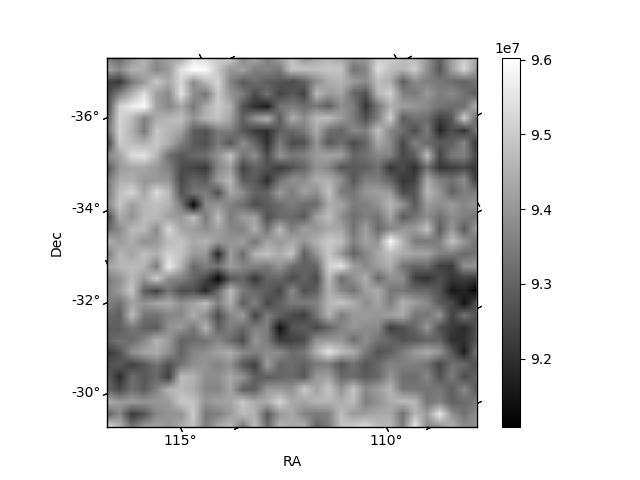
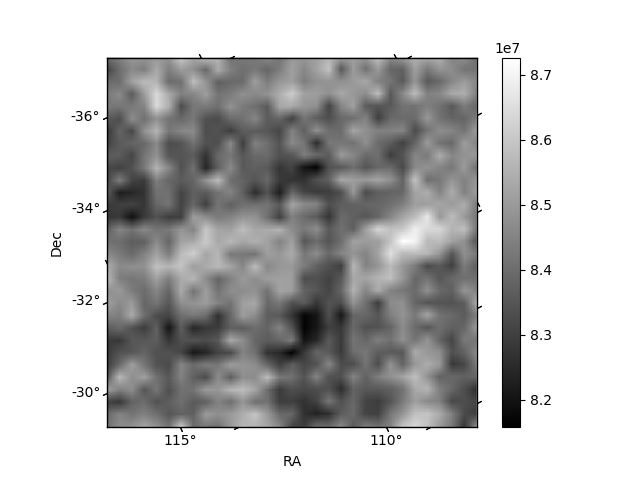
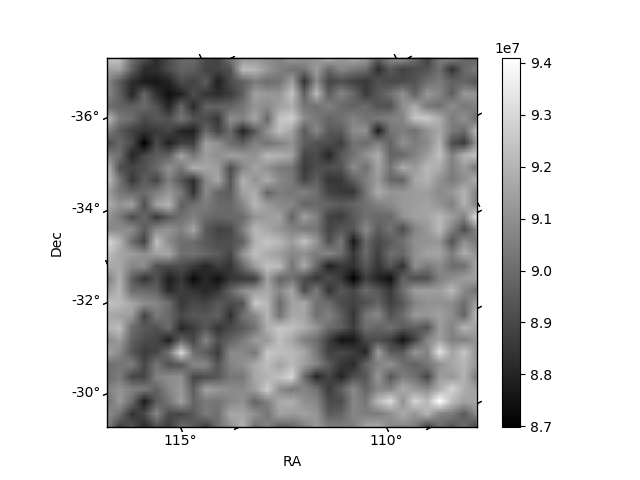
Histogram calculated using DETX and DETY for each event in the final _common_clean file
| Quadrant A | 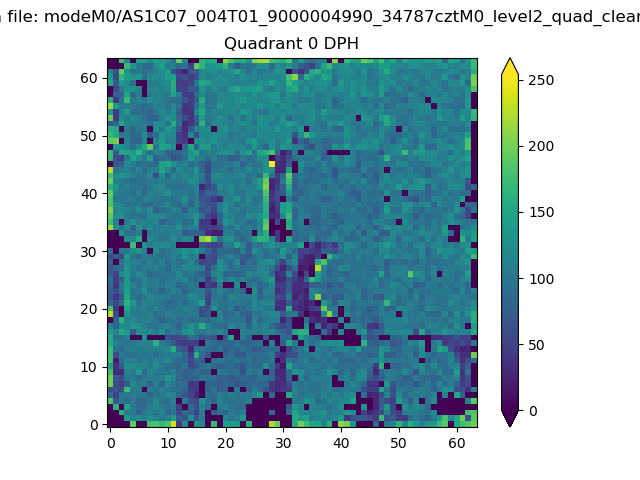 |
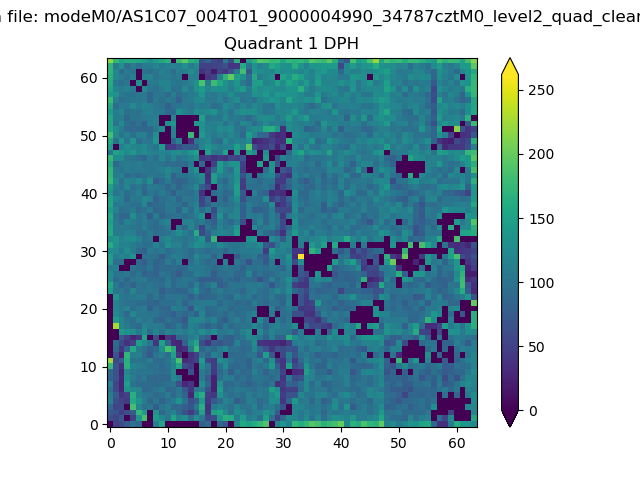 |
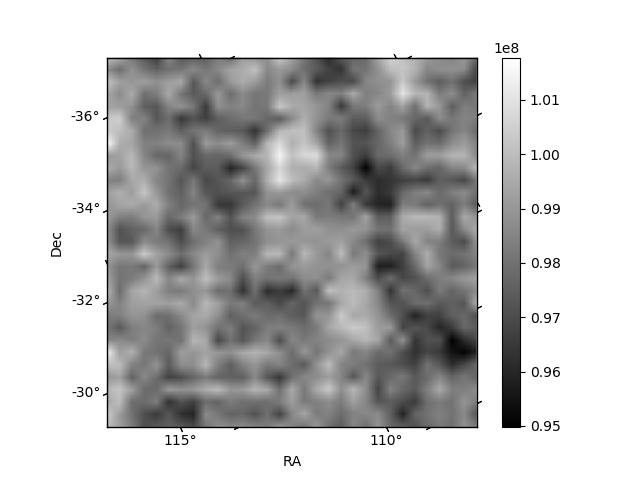
Quadrant B |
|---|---|---|---|
| Quadrant D | 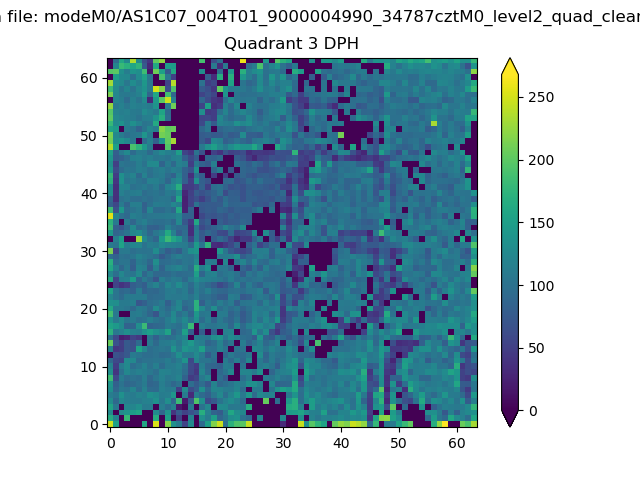 |
 |
Quadrant C |
| Plot type | Count rate plots | Images |
|---|---|---|
| Comparison with Poisson distribution Blue bars denote a histogram of data divided into 1 sec bins. Red curve is a Poisson curve with rate = median count rate of data. |
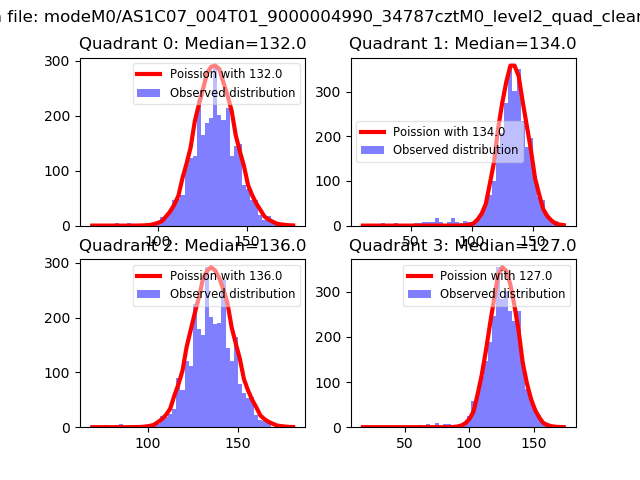 |
 |
| Quadrant-wise count rates Data is divided into 100 sec bins |
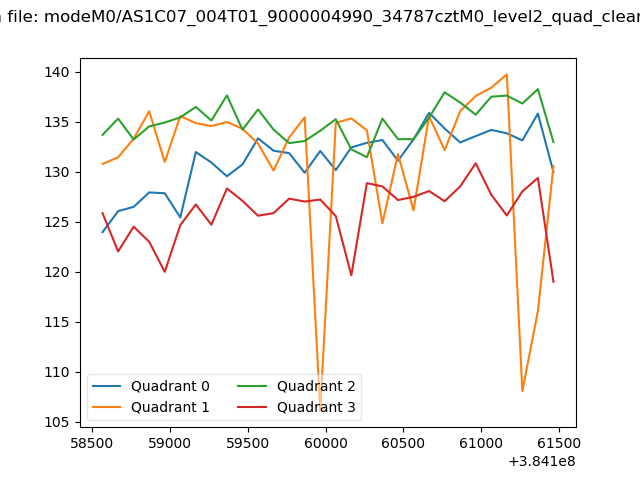 |
|
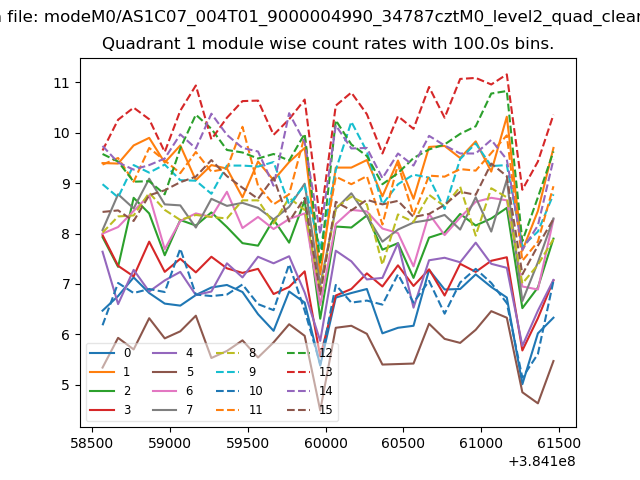
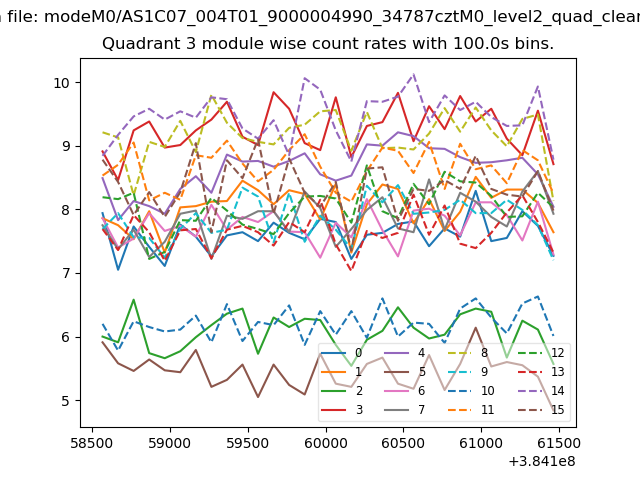
| Module-wise count rates for Quadrant A Data is divided into 100 sec bins |
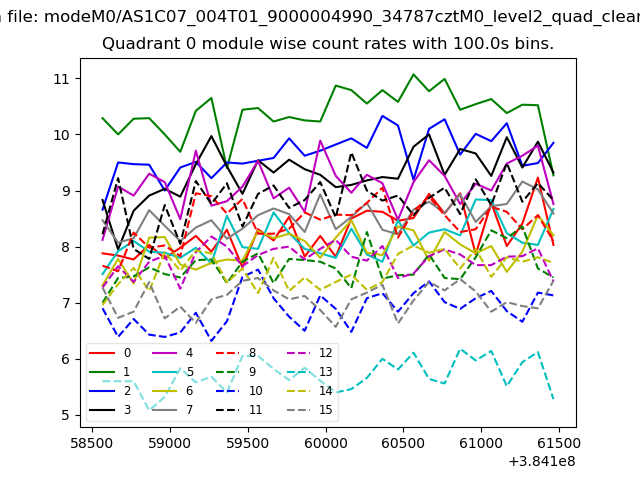 |
 |
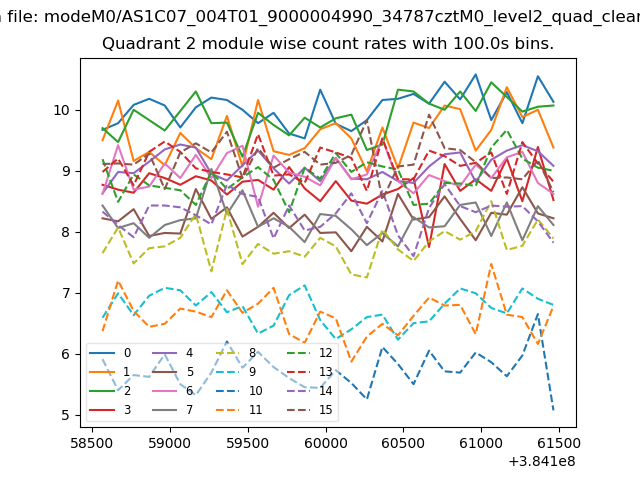
| Module-wise count rates for Quadrant B Data is divided into 100 sec bins |
 |
 |
| Module-wise count rates for Quadrant C Data is divided into 100 sec bins |
 |
 |
| Module-wise count rates for Quadrant D Data is divided into 100 sec bins |
 |
 |
| Parameter | Plot |
|---|---|
| CZT HV Monitor | 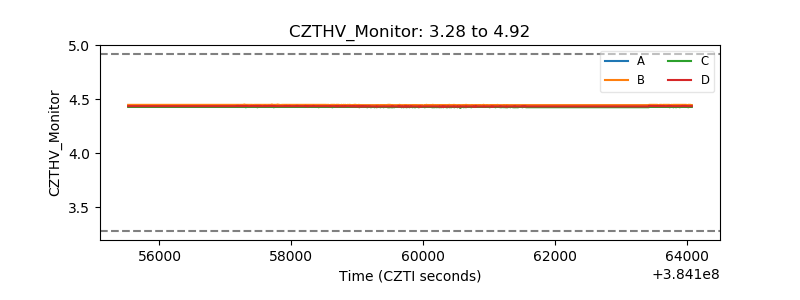 |
| D_VDD | 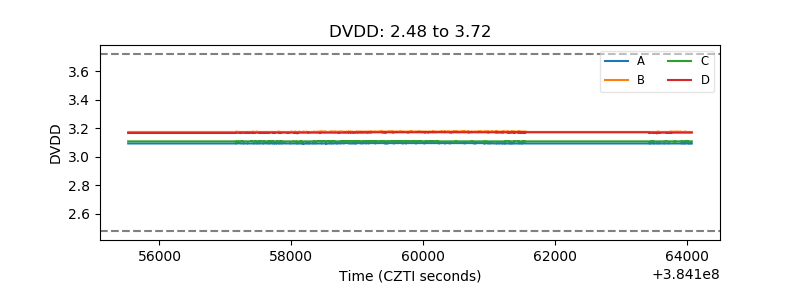 |
| Temperature 1 | 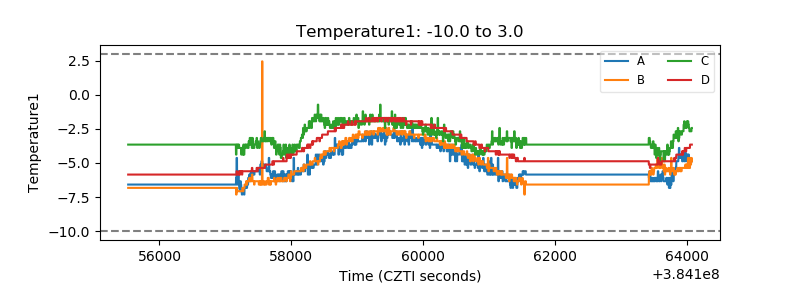 |
| Veto HV Monitor | 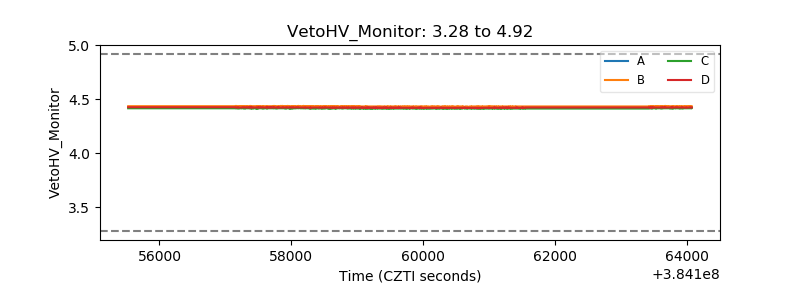 |
| Veto LLD | 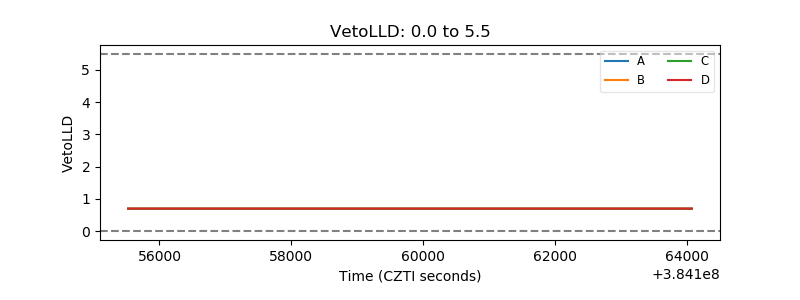 |
| Alpha Counter | 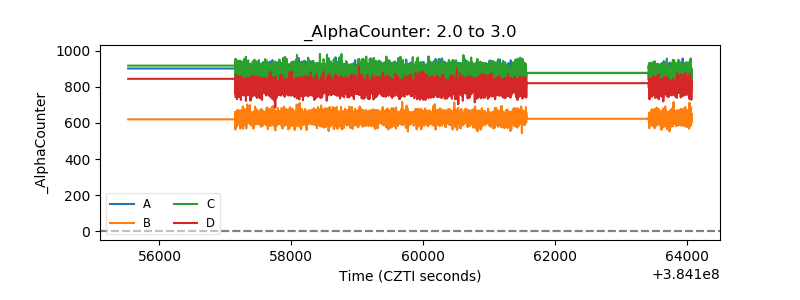 |
| _CPM_Rate | 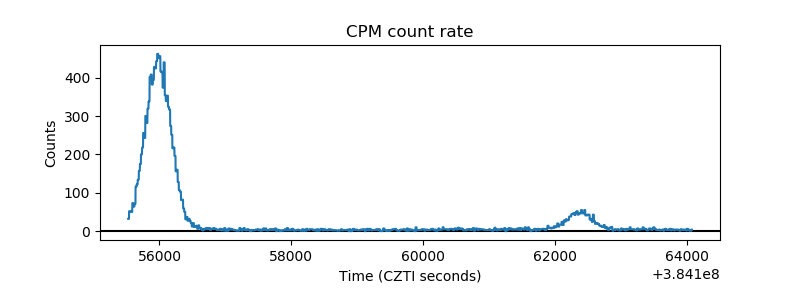 |
| CZT Counter | 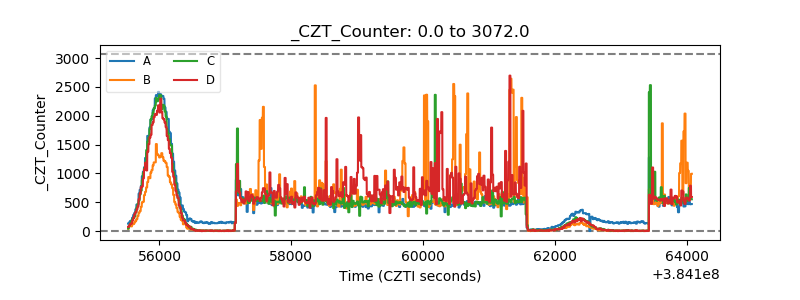 |
| +2.5 Volts monitor |  |
| +5 Volts monitor |  |
| _ROLL_ROT | 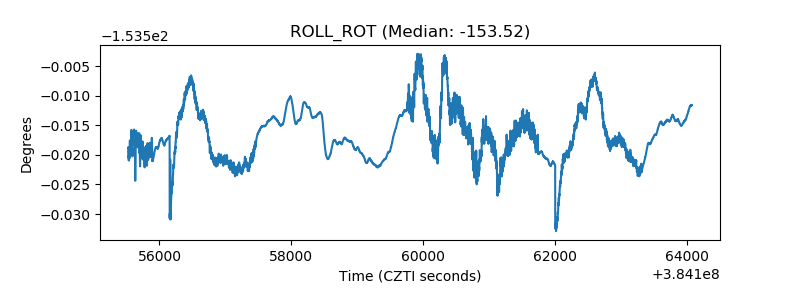 |
| _Roll_DEC |  |
| _Roll_RA | 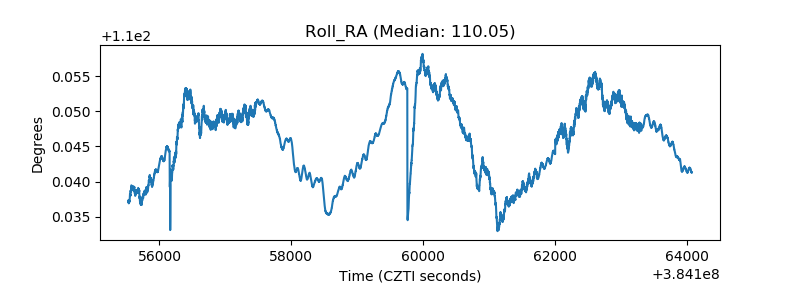 |
| Veto Counter | 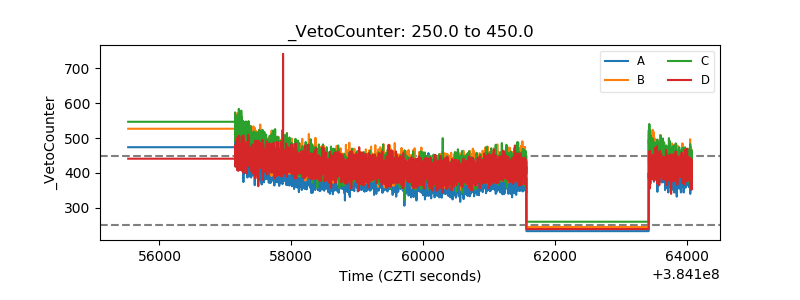 |