| Param | Original file | Final file |
|---|---|---|
| Filename | modeM0/AS1C07_004T01_9000004990_34800cztM0_level2.evt | modeM0/AS1C07_004T01_9000004990_34800cztM0_level2_quad_clean.evt |
| Size (bytes) | 424,342,080 | 47,707,200 |
| Size | 404.7 MB | 45.5 MB |
| Events in quadrant A | 2,472,197 | 273,921 |
| Events in quadrant B | 3,115,292 | 282,277 |
| Events in quadrant C | 2,858,013 | 285,324 |
| Events in quadrant D | 4,067,896 | 253,609 |
| Mode M9 | |||
|---|---|---|---|
| Quadrant | BADHDUFLAG | Total packets | Discarded packets |
| A | 0 | 32 | 0 |
| B | 0 | 32 | 0 |
| C | 0 | 32 | 0 |
| D | 0 | 33 | 0 |
| Mode M0 | |||
|---|---|---|---|
| Quadrant | BADHDUFLAG | Total packets | Discarded packets |
| A | 0 | 10171 | 3 |
| B | 0 | 12246 | 2 |
| C | 0 | 11118 | 2 |
| D | 0 | 15404 | 2 |
| Mode SS | |||
|---|---|---|---|
| Quadrant | BADHDUFLAG | Total packets | Discarded packets |
| A | 0 | 100 | 0 |
| B | 0 | 100 | 0 |
| C | 0 | 100 | 0 |
| D | 0 | 100 | 0 |
| Quadrant | Total seconds | Saturated seconds | Saturation percentage |
|---|---|---|---|
| A | 4980 | 9 | 0.180723% |
| B | 4980 | 107 | 2.148594% |
| C | 4980 | 47 | 0.943775% |
| D | 4980 | 223 | 4.477912% |
Noise dominated data is calculated using 1-second bins in cleaned event files. If a bin has >2000 counts, and if more than 50% of those come from <1% of pixels, then it is considered to be noise-dominated and hence unusable.
| Quadrant | # 1 sec bins | Bins with >0 counts | Bins with >2000 counts | High rate bins dominated by noise | Noise dominated (total time) | Noise dominated (detector-on time) | Marked lightcurve |
|---|---|---|---|---|---|---|---|
| A | 7132 | 4981 | 0 | 0 | 0.00% | 0.00% | 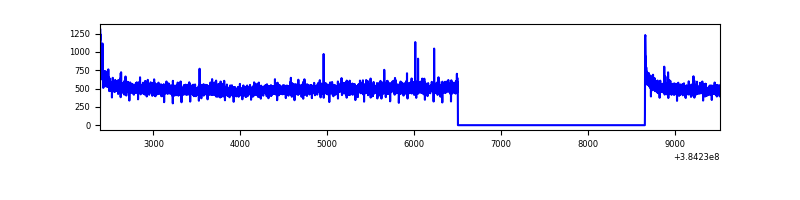 |
| B | 7132 | 4981 | 73 | 73 | 1.02% | 1.47% | 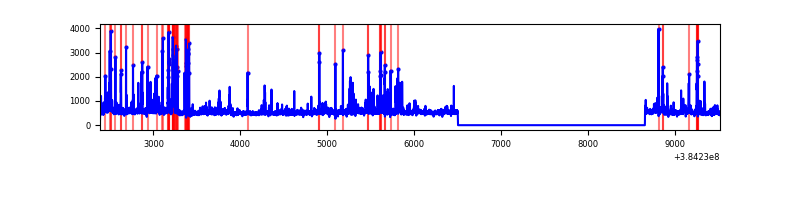 |
| C | 7132 | 4981 | 33 | 33 | 0.46% | 0.66% | 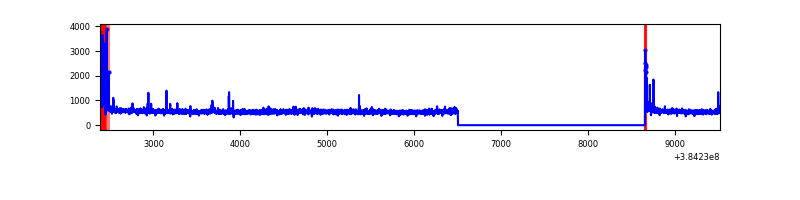 |
| D | 7132 | 4981 | 193 | 193 | 2.71% | 3.87% | 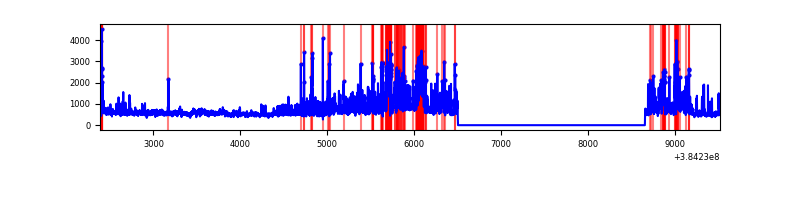 |
Top three noisy pixels from each quadrant. If the there are fewer than three noisy pixels in the level2.evt file, extra rows are filled as -1
| Pixel properties | Quadrant properties | ||||||
|---|---|---|---|---|---|---|---|
| Quadrant | DetID | PixID | Counts | Sigma | Mean | Median | Sigma |
| A | 10 | 83 | 49253 | 392.84 | 623 | 612 | 123.8 |
| A | 13 | 6 | 10122 | 76.8 | 623 | 612 | 123.8 |
| A | 13 | 254 | 8972 | 67.52 | 623 | 612 | 123.8 |
| B | 5 | 172 | 248473 | 2089.34 | 622 | 608 | 118.6 |
| B | 5 | 255 | 203049 | 1706.44 | 622 | 608 | 118.6 |
| B | 0 | 190 | 107574 | 901.65 | 622 | 608 | 118.6 |
| C | 15 | 214 | 217401 | 1529.1 | 617 | 625 | 141.8 |
| C | 0 | 10 | 173438 | 1218.99 | 617 | 625 | 141.8 |
| C | 14 | 67 | 52814 | 368.13 | 617 | 625 | 141.8 |
| D | 7 | 223 | 544017 | 3750.51 | 600 | 585 | 144.9 |
| D | 8 | 195 | 391900 | 2700.67 | 600 | 585 | 144.9 |
| D | 2 | 250 | 342877 | 2362.34 | 600 | 585 | 144.9 |
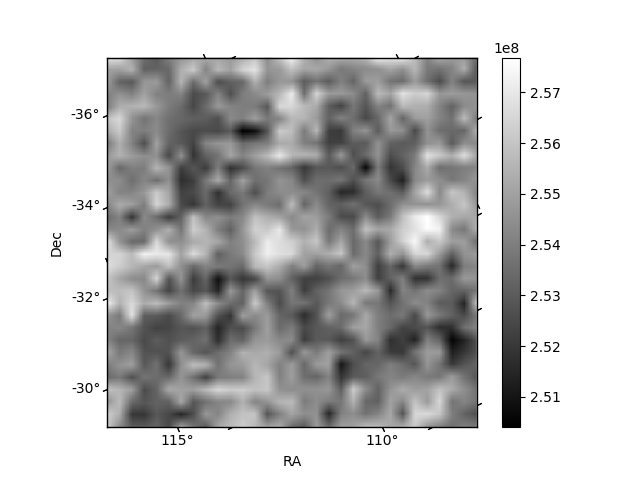
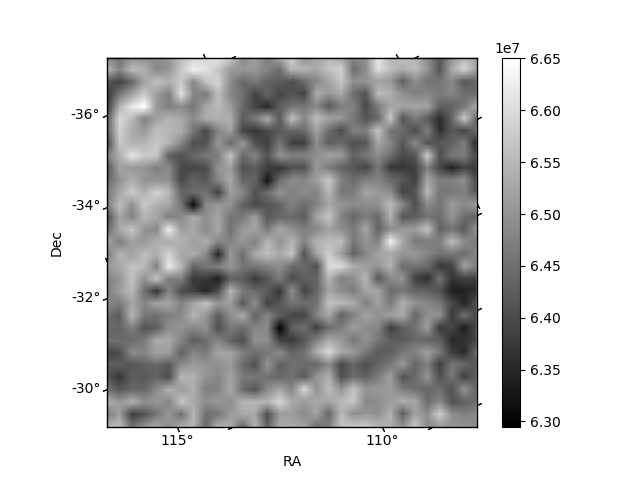
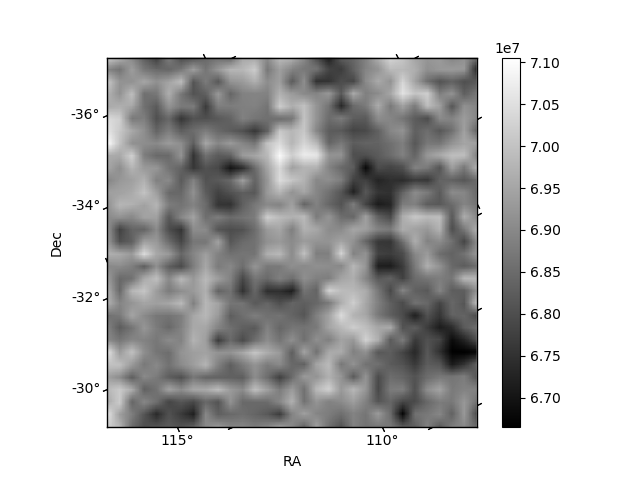
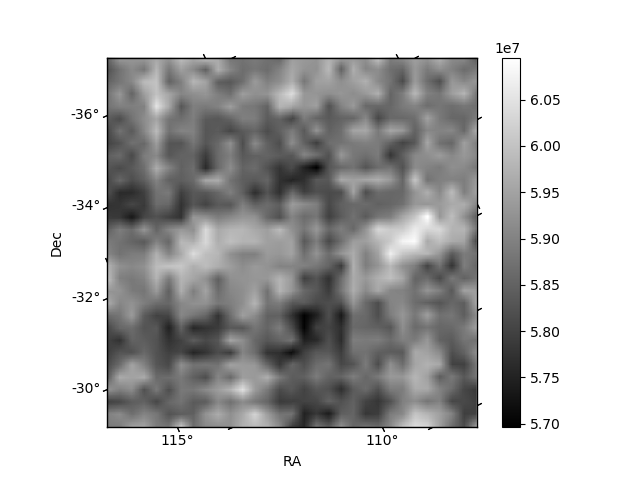
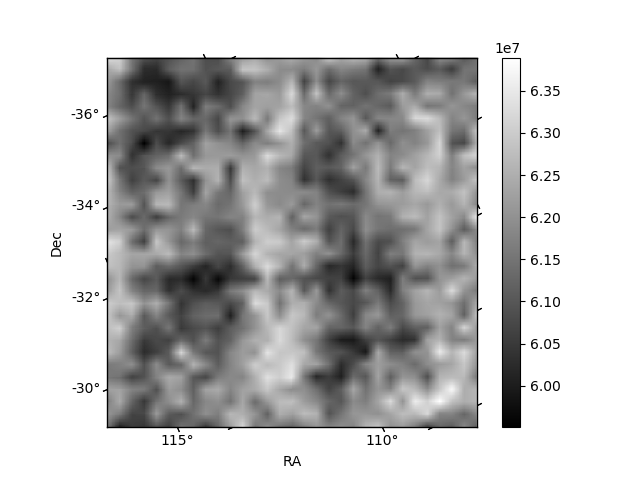
Histogram calculated using DETX and DETY for each event in the final _common_clean file
| Quadrant A | 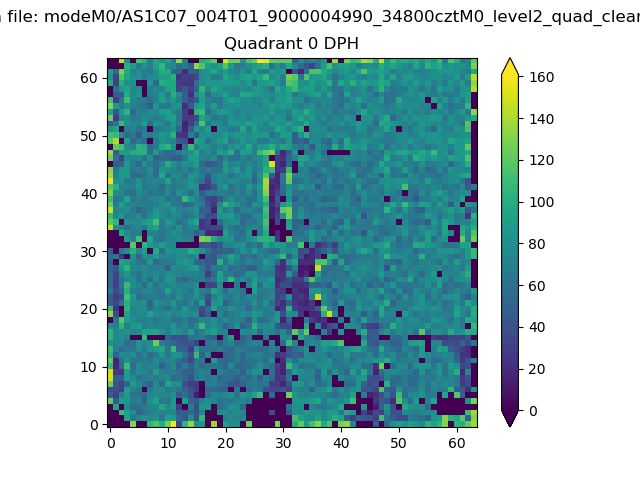 |
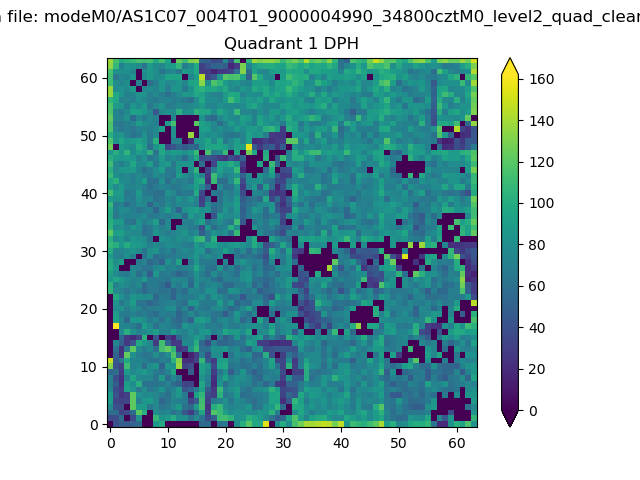 |
Quadrant B |
|---|---|---|---|
| Quadrant D | 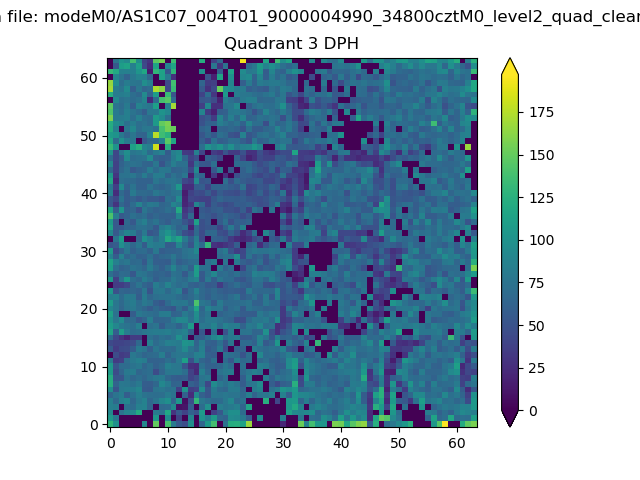 |
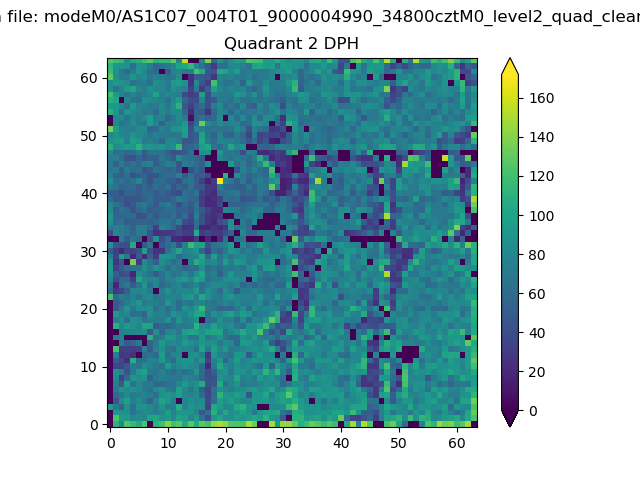 |
Quadrant C |
| Plot type | Count rate plots | Images |
|---|---|---|
| Comparison with Poisson distribution Blue bars denote a histogram of data divided into 1 sec bins. Red curve is a Poisson curve with rate = median count rate of data. |
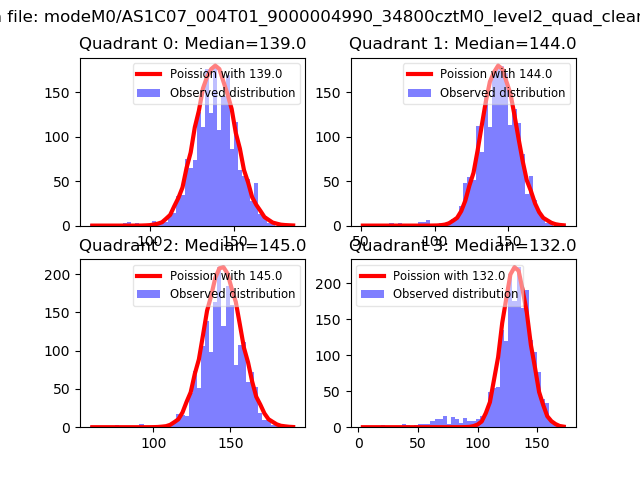 |
 |
| Quadrant-wise count rates Data is divided into 100 sec bins |
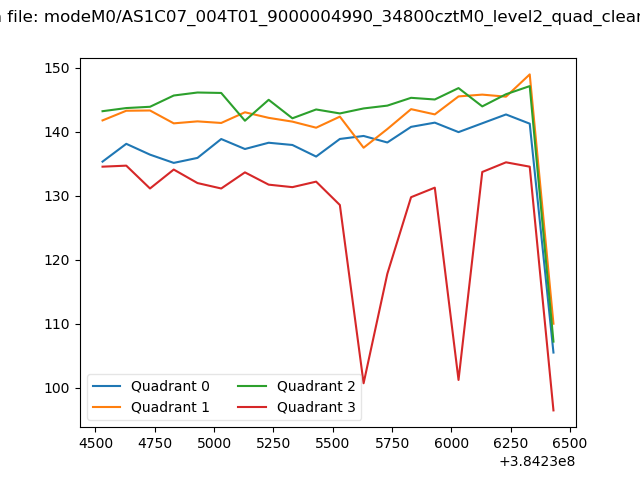 |
|
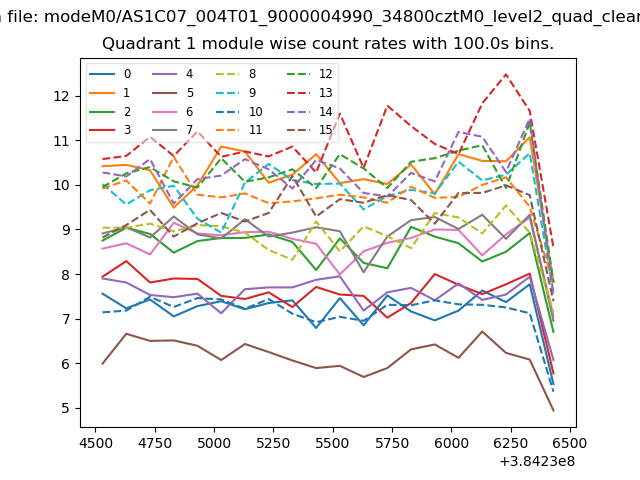
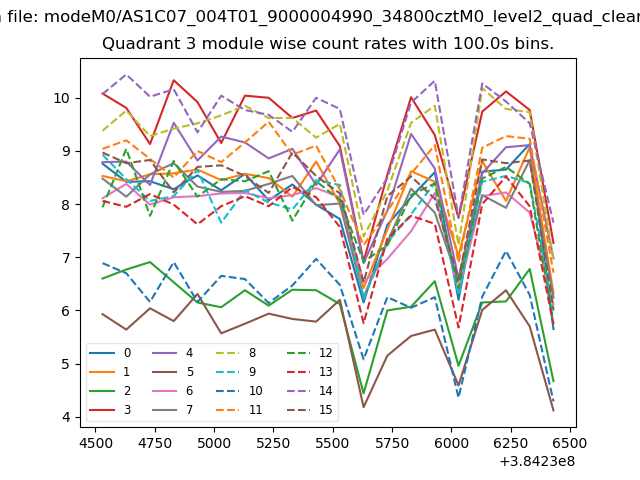
| Module-wise count rates for Quadrant A Data is divided into 100 sec bins |
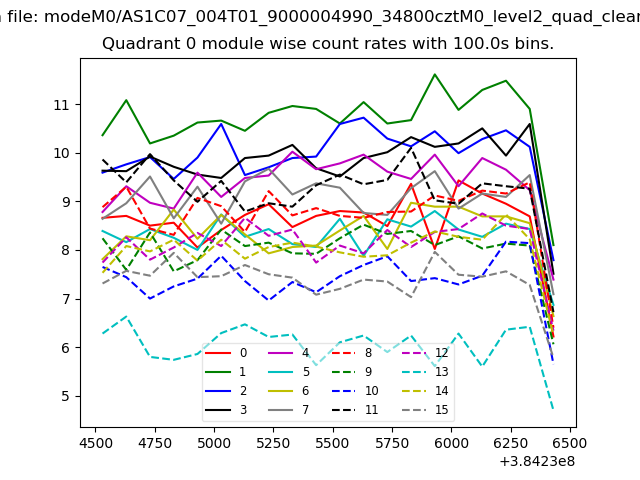 |
 |
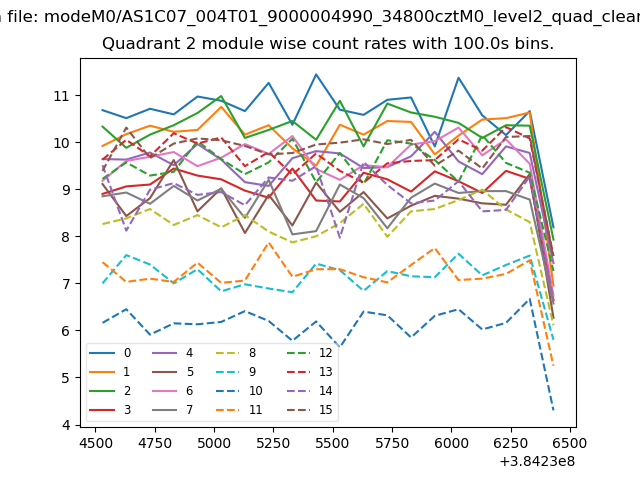
| Module-wise count rates for Quadrant B Data is divided into 100 sec bins |
 |
 |
| Module-wise count rates for Quadrant C Data is divided into 100 sec bins |
 |
 |
| Module-wise count rates for Quadrant D Data is divided into 100 sec bins |
 |
 |
| Parameter | Plot |
|---|---|
| CZT HV Monitor | 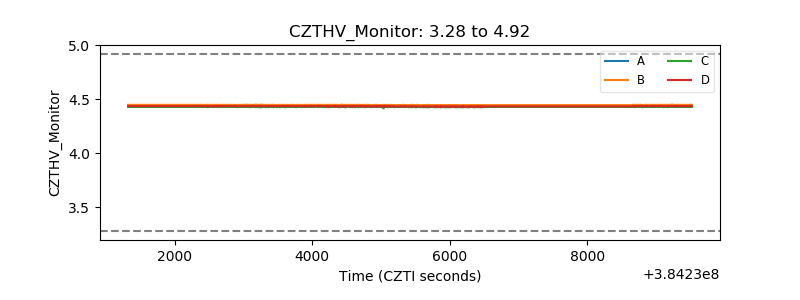 |
| D_VDD | 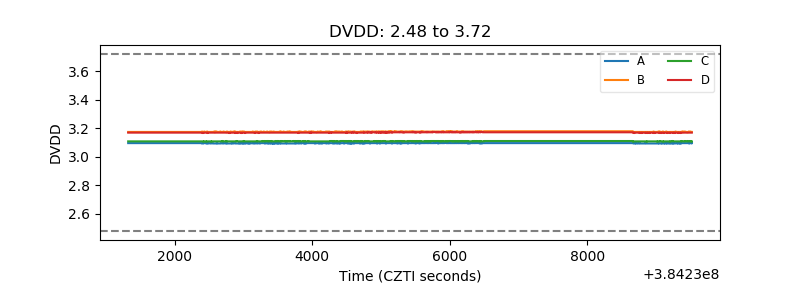 |
| Temperature 1 | 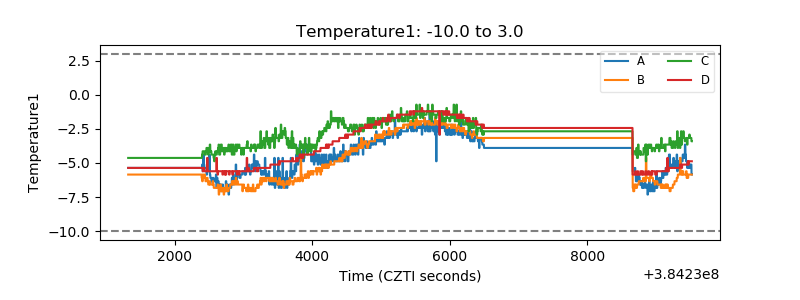 |
| Veto HV Monitor |  |
| Veto LLD | 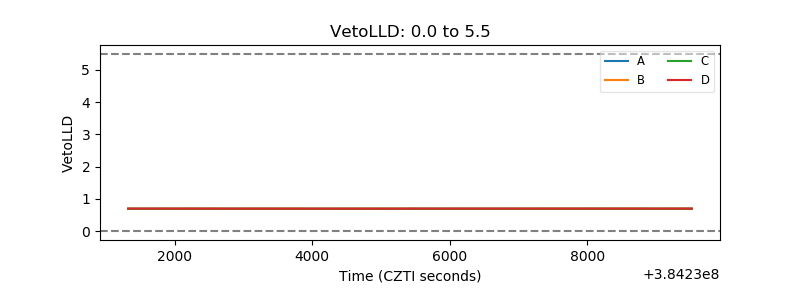 |
| Alpha Counter | 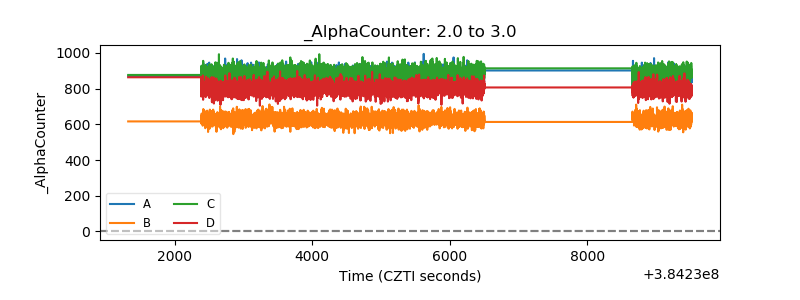 |
| _CPM_Rate |  |
| CZT Counter | 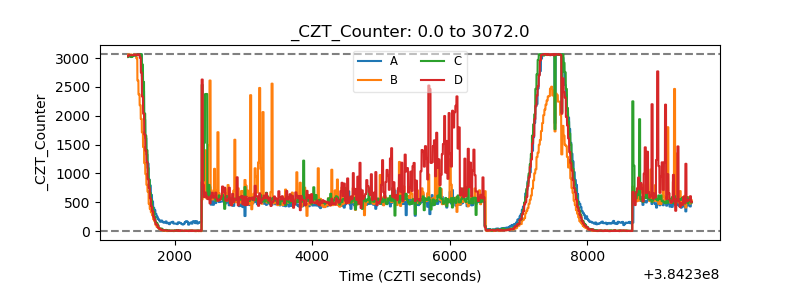 |
| +2.5 Volts monitor |  |
| +5 Volts monitor |  |
| _ROLL_ROT | 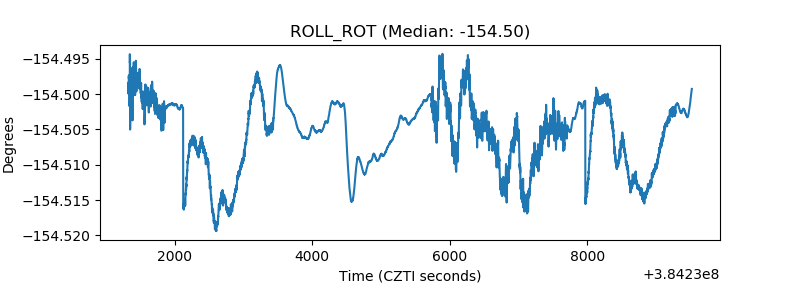 |
| _Roll_DEC | 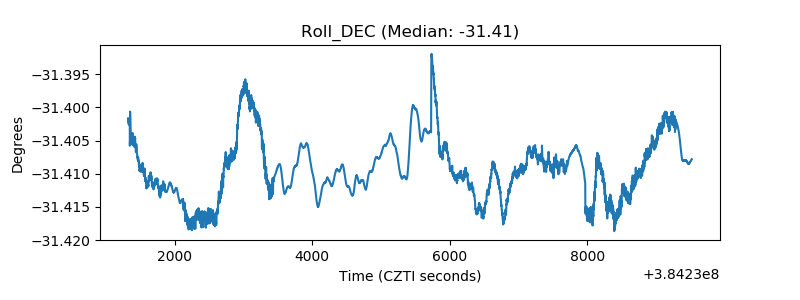 |
| _Roll_RA | 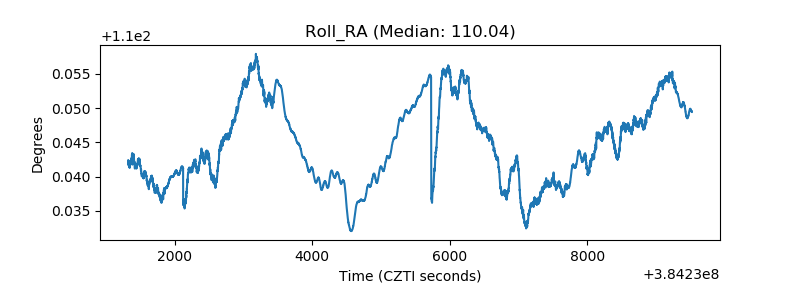 |
| Veto Counter | 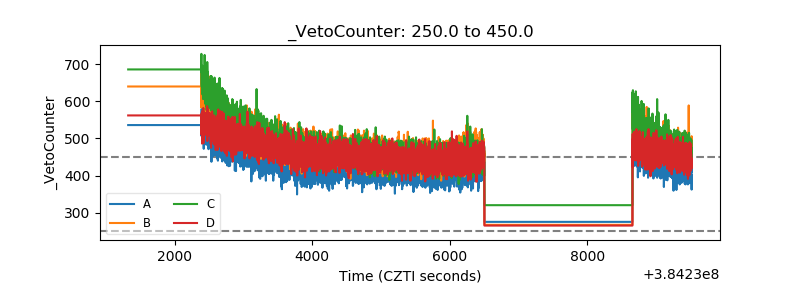 |