| Param | Original file | Final file |
|---|---|---|
| Filename | modeM0/AS1C07_005T01_9000004992_34807cztM0_level2.evt | modeM0/AS1C07_005T01_9000004992_34807cztM0_level2_quad_clean.evt |
| Size (bytes) | 274,389,120 | 61,217,280 |
| Size | 261.7 MB | 58.4 MB |
| Events in quadrant A | 1,831,754 | 411,246 |
| Events in quadrant B | 1,824,622 | 418,102 |
| Events in quadrant C | 1,936,372 | 403,505 |
| Events in quadrant D | 2,486,154 | 381,108 |
| Mode M9 | |||
|---|---|---|---|
| Quadrant | BADHDUFLAG | Total packets | Discarded packets |
| A | 0 | 15 | 0 |
| B | 0 | 15 | 0 |
| C | 0 | 15 | 0 |
| D | 0 | 15 | 0 |
| Mode M0 | |||
|---|---|---|---|
| Quadrant | BADHDUFLAG | Total packets | Discarded packets |
| A | 0 | 7674 | 2 |
| B | 0 | 7530 | 1 |
| C | 0 | 7856 | 1 |
| D | 0 | 9723 | 1 |
| Mode SS | |||
|---|---|---|---|
| Quadrant | BADHDUFLAG | Total packets | Discarded packets |
| A | 0 | 68 | 0 |
| B | 0 | 68 | 0 |
| C | 0 | 68 | 0 |
| D | 0 | 68 | 0 |
| Quadrant | Total seconds | Saturated seconds | Saturation percentage |
|---|---|---|---|
| A | 3385 | 25 | 0.738552% |
| B | 3385 | 32 | 0.945347% |
| C | 3385 | 24 | 0.709010% |
| D | 3385 | 167 | 4.933530% |
Noise dominated data is calculated using 1-second bins in cleaned event files. If a bin has >2000 counts, and if more than 50% of those come from <1% of pixels, then it is considered to be noise-dominated and hence unusable.
| Quadrant | # 1 sec bins | Bins with >0 counts | Bins with >2000 counts | High rate bins dominated by noise | Noise dominated (total time) | Noise dominated (detector-on time) | Marked lightcurve |
|---|---|---|---|---|---|---|---|
| A | 4877 | 3386 | 16 | 16 | 0.33% | 0.47% | 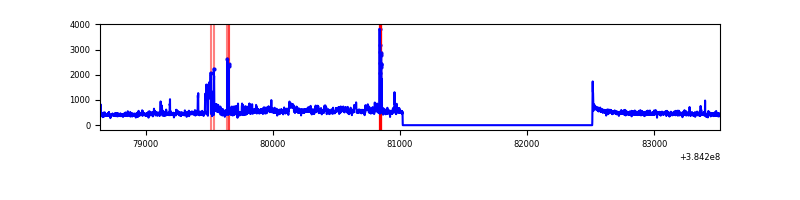 |
| B | 4877 | 3386 | 15 | 15 | 0.31% | 0.44% | 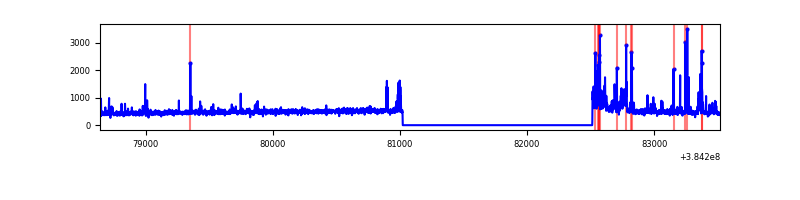 |
| C | 4877 | 3386 | 14 | 14 | 0.29% | 0.41% | 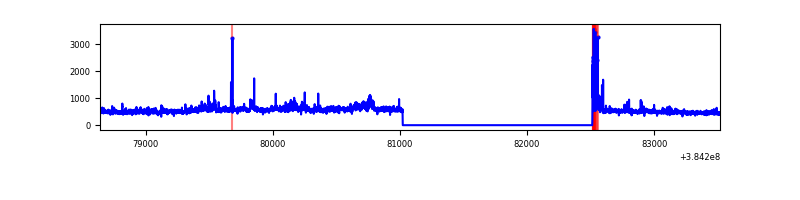 |
| D | 4877 | 3386 | 142 | 142 | 2.91% | 4.19% | 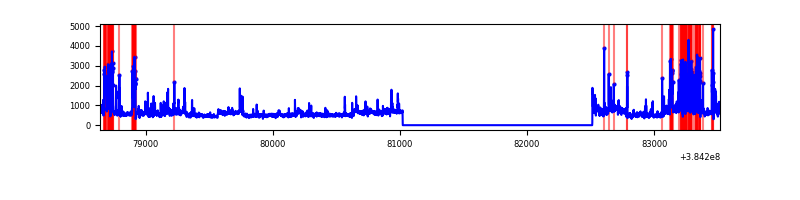 |
Top three noisy pixels from each quadrant. If the there are fewer than three noisy pixels in the level2.evt file, extra rows are filled as -1
| Pixel properties | Quadrant properties | ||||||
|---|---|---|---|---|---|---|---|
| Quadrant | DetID | PixID | Counts | Sigma | Mean | Median | Sigma |
| A | 15 | 169 | 250392 | 3084.44 | 398 | 389 | 81.1 |
| A | 10 | 83 | 28525 | 347.13 | 398 | 389 | 81.1 |
| A | 13 | 254 | 6293 | 72.84 | 398 | 389 | 81.1 |
| B | 5 | 172 | 157920 | 2053.65 | 398 | 387 | 76.7 |
| B | 5 | 255 | 46108 | 596.03 | 398 | 387 | 76.7 |
| B | 4 | 232 | 25165 | 323.01 | 398 | 387 | 76.7 |
| C | 15 | 214 | 153445 | 1673.05 | 388 | 389 | 91.5 |
| C | 14 | 67 | 126492 | 1378.43 | 388 | 389 | 91.5 |
| C | 0 | 10 | 62059 | 674.11 | 388 | 389 | 91.5 |
| D | 8 | 195 | 392804 | 4145.91 | 380 | 368 | 94.7 |
| D | 2 | 249 | 224151 | 2364.17 | 380 | 368 | 94.7 |
| D | 10 | 118 | 210187 | 2216.64 | 380 | 368 | 94.7 |
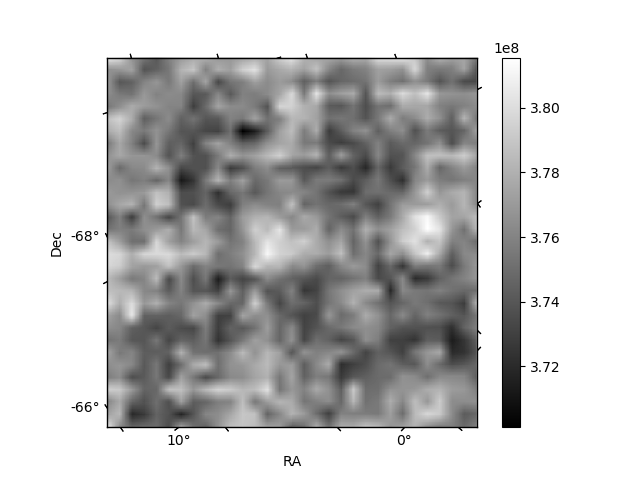
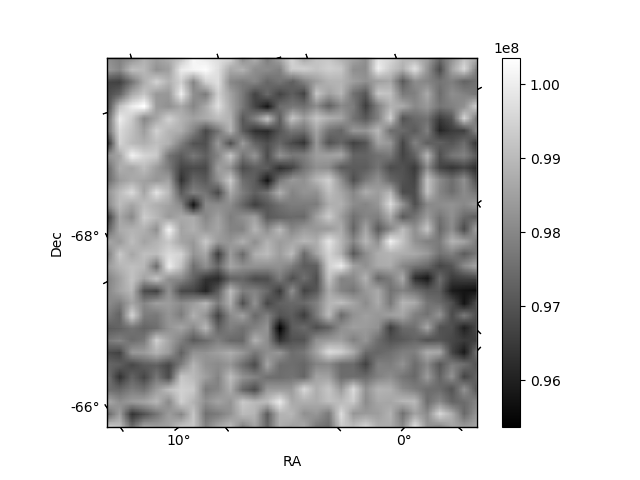
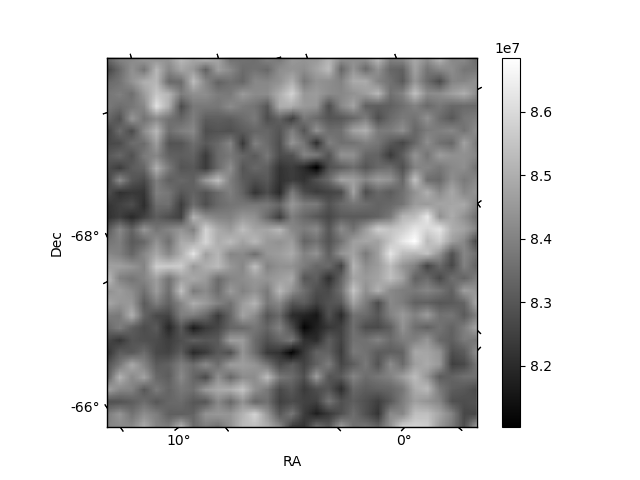
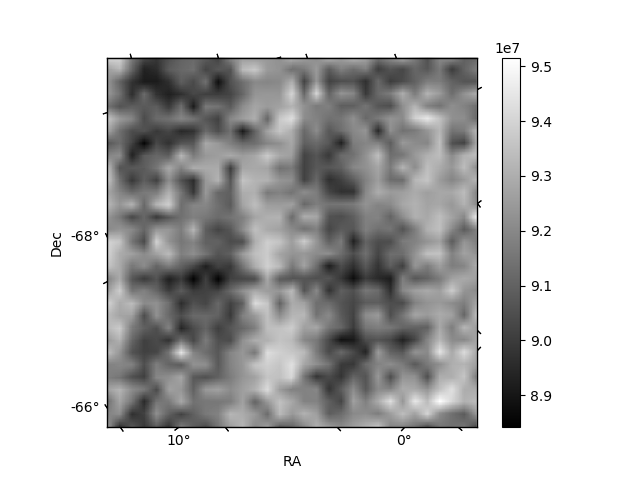
Histogram calculated using DETX and DETY for each event in the final _common_clean file
| Quadrant A | 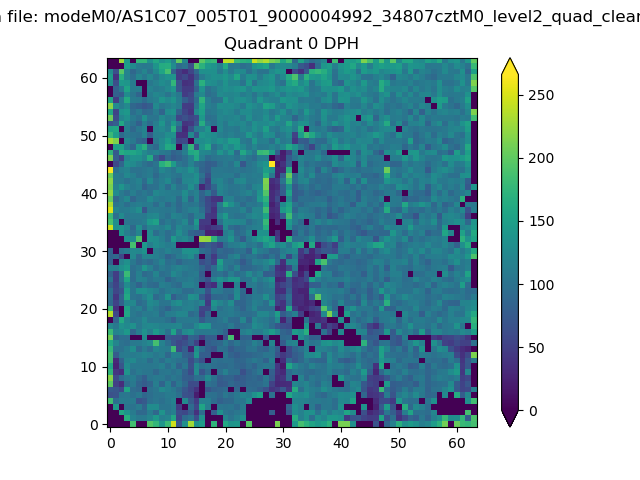 |
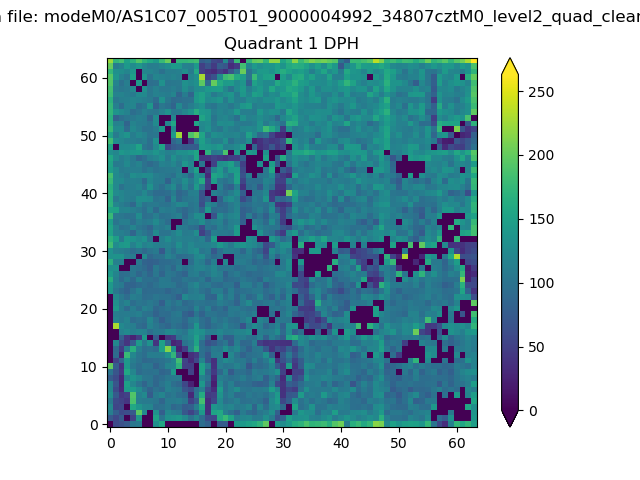 |
Quadrant B |
|---|---|---|---|
| Quadrant D | 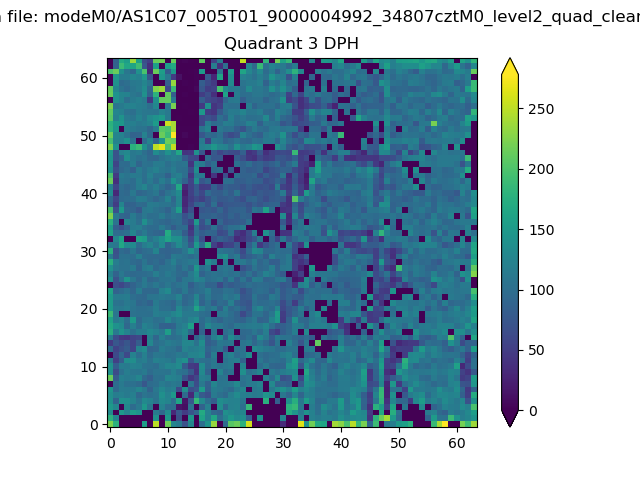 |
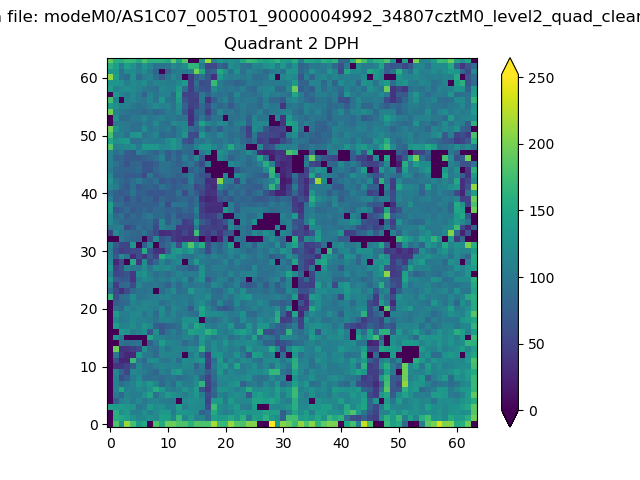 |
Quadrant C |
| Plot type | Count rate plots | Images |
|---|---|---|
| Comparison with Poisson distribution Blue bars denote a histogram of data divided into 1 sec bins. Red curve is a Poisson curve with rate = median count rate of data. |
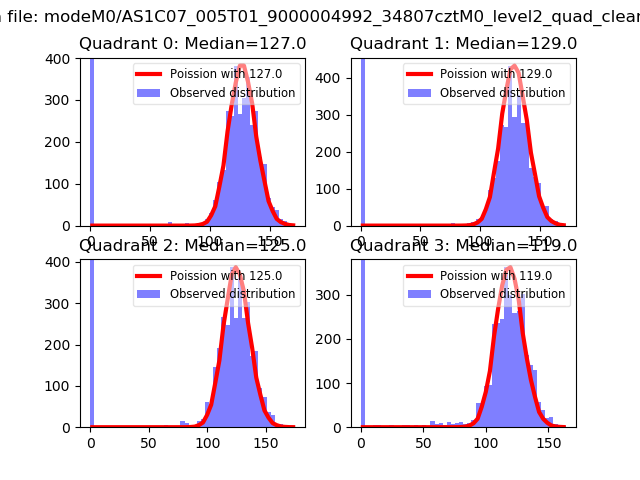 |
 |
| Quadrant-wise count rates Data is divided into 100 sec bins |
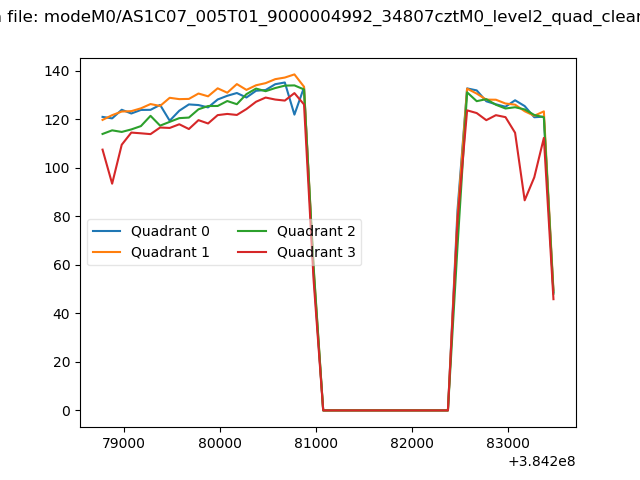 |
|
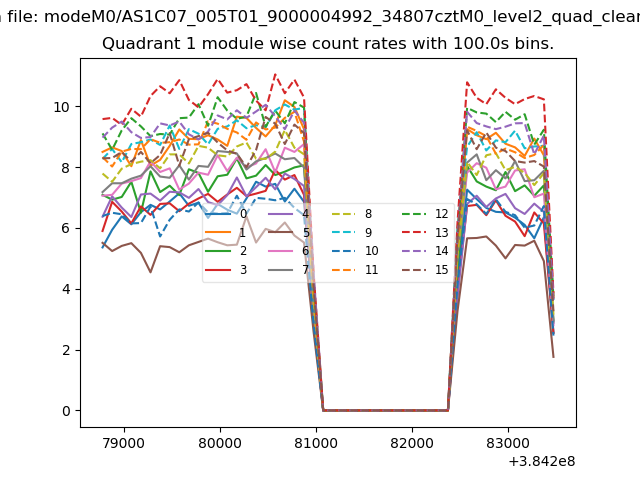
| Module-wise count rates for Quadrant A Data is divided into 100 sec bins |
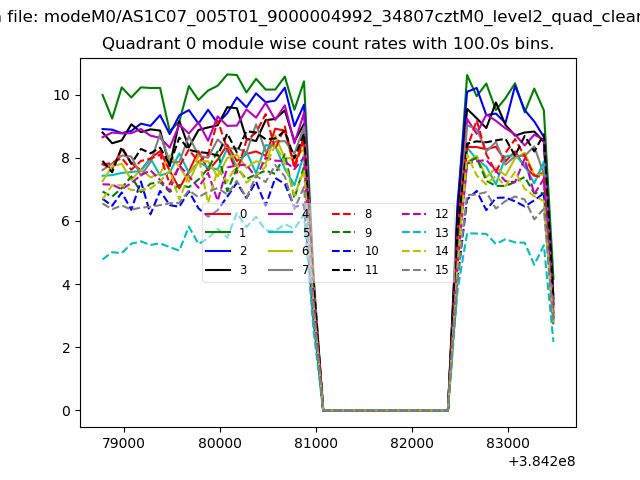 |
 |
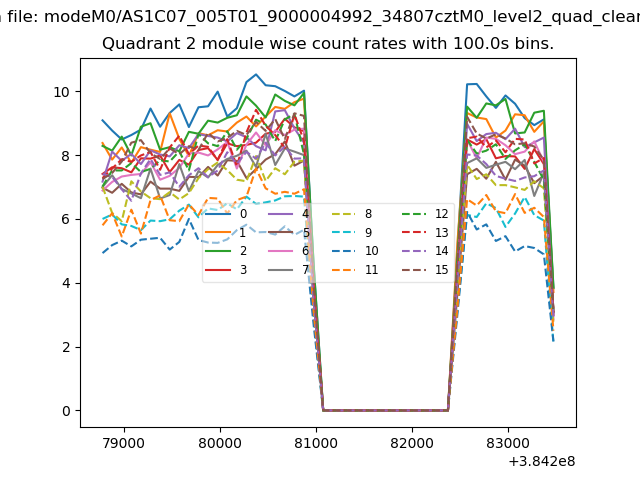
| Module-wise count rates for Quadrant B Data is divided into 100 sec bins |
 |
 |
| Module-wise count rates for Quadrant C Data is divided into 100 sec bins |
 |
 |
| Module-wise count rates for Quadrant D Data is divided into 100 sec bins |
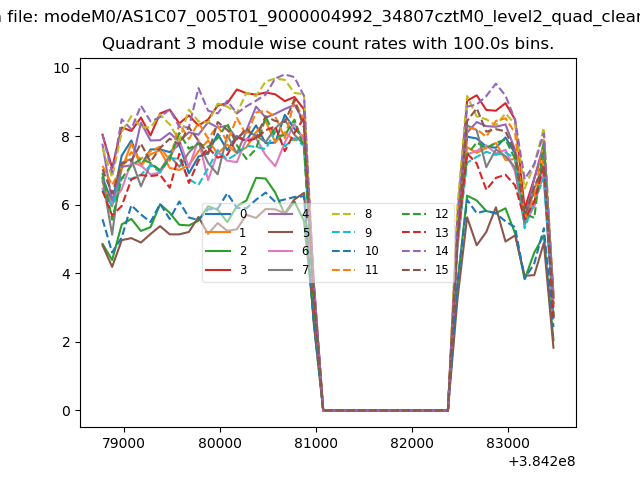 |
 |
| Parameter | Plot |
|---|---|
| CZT HV Monitor | 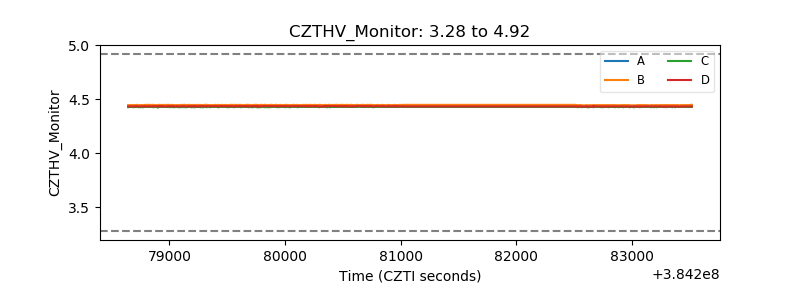 |
| D_VDD | 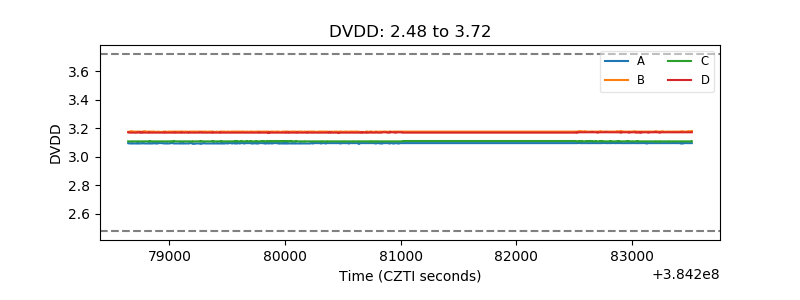 |
| Temperature 1 | 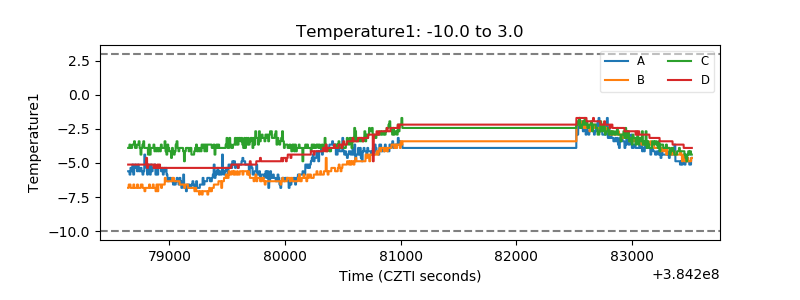 |
| Veto HV Monitor | 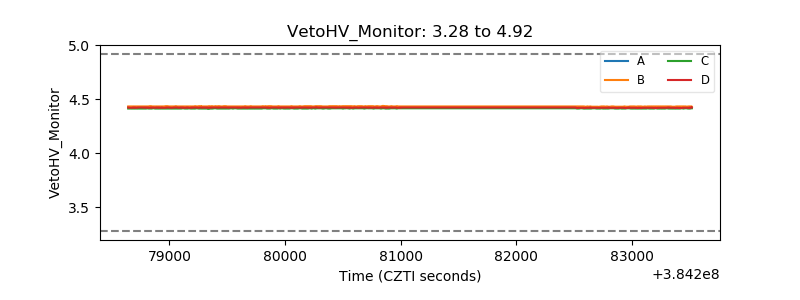 |
| Veto LLD | 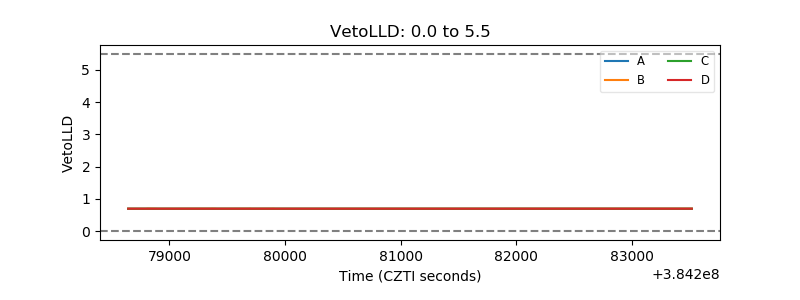 |
| Alpha Counter | 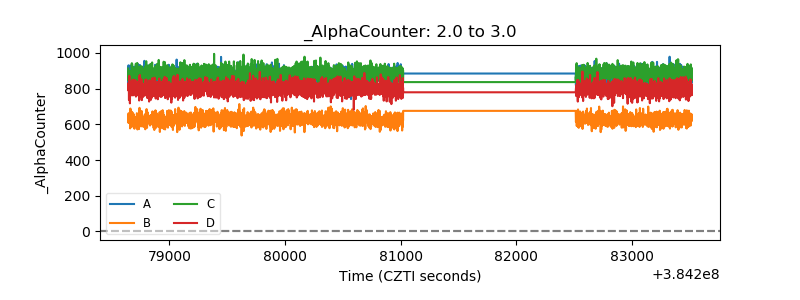 |
| _CPM_Rate | 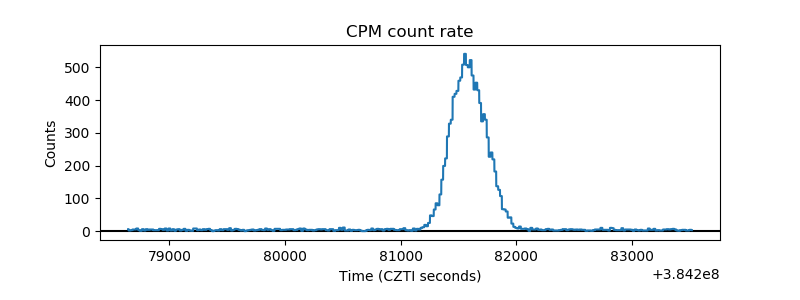 |
| CZT Counter | 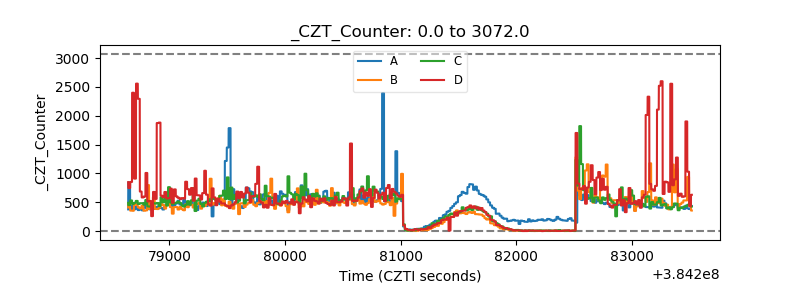 |
| +2.5 Volts monitor |  |
| +5 Volts monitor | 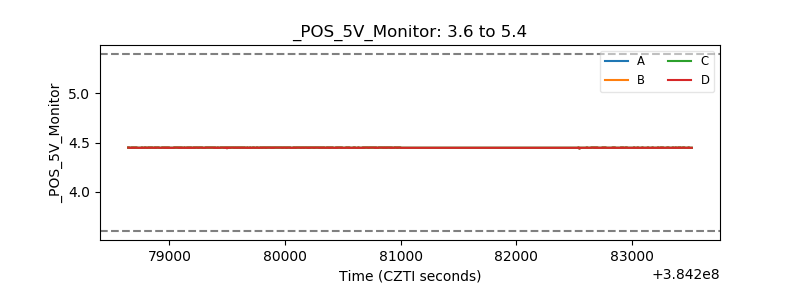 |
| _ROLL_ROT | 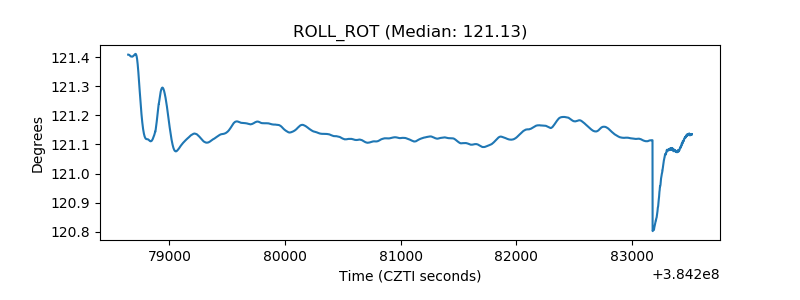 |
| _Roll_DEC | 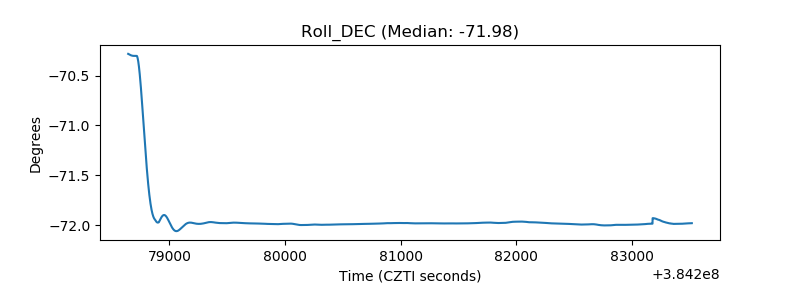 |
| _Roll_RA | 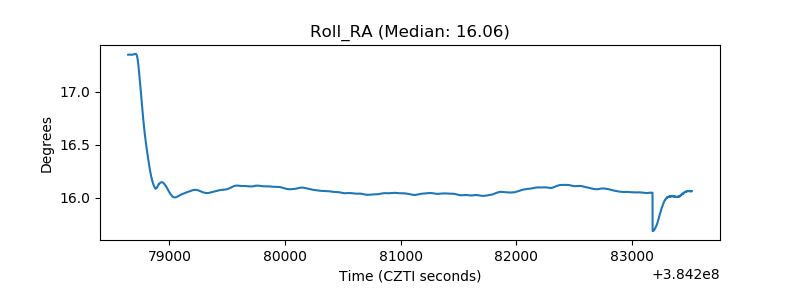 |
| Veto Counter | 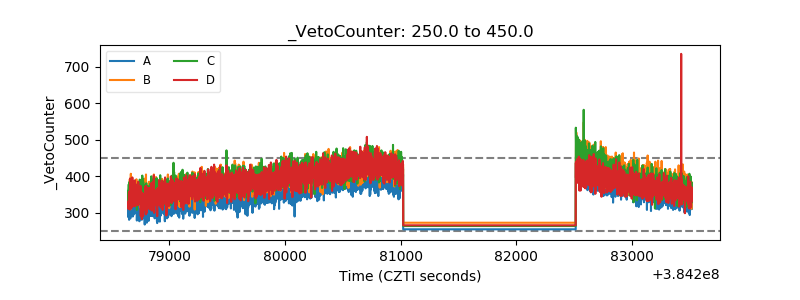 |