| Param | Original file | Final file |
|---|---|---|
| Filename | modeM0/AS1C07_005T01_9000004992_34847cztM0_level2.evt | modeM0/AS1C07_005T01_9000004992_34847cztM0_level2_quad_clean.evt |
| Size (bytes) | 777,882,240 | 91,440,000 |
| Size | 741.8 MB | 87.2 MB |
| Events in quadrant A | 7,744,918 | 511,119 |
| Events in quadrant B | 7,998,265 | 548,515 |
| Events in quadrant C | 3,301,255 | 659,782 |
| Events in quadrant D | 4,106,688 | 626,600 |
| Mode M9 | |||
|---|---|---|---|
| Quadrant | BADHDUFLAG | Total packets | Discarded packets |
| A | 0 | 14 | 0 |
| B | 0 | 14 | 0 |
| C | 0 | 14 | 0 |
| D | 0 | 15 | 0 |
| Mode M0 | |||
|---|---|---|---|
| Quadrant | BADHDUFLAG | Total packets | Discarded packets |
| A | 0 | 27214 | 3 |
| B | 0 | 27709 | 2 |
| C | 0 | 13321 | 2 |
| D | 0 | 16446 | 2 |
| Mode SS | |||
|---|---|---|---|
| Quadrant | BADHDUFLAG | Total packets | Discarded packets |
| A | 0 | 124 | 0 |
| B | 0 | 124 | 0 |
| C | 0 | 124 | 0 |
| D | 0 | 124 | 0 |
| Quadrant | Total seconds | Saturated seconds | Saturation percentage |
|---|---|---|---|
| A | 6027 | 1915 | 31.773685% |
| B | 6027 | 2131 | 35.357558% |
| C | 6027 | 49 | 0.813008% |
| D | 6027 | 106 | 1.758752% |
Noise dominated data is calculated using 1-second bins in cleaned event files. If a bin has >2000 counts, and if more than 50% of those come from <1% of pixels, then it is considered to be noise-dominated and hence unusable.
| Quadrant | # 1 sec bins | Bins with >0 counts | Bins with >2000 counts | High rate bins dominated by noise | Noise dominated (total time) | Noise dominated (detector-on time) | Marked lightcurve |
|---|---|---|---|---|---|---|---|
| A | 7340 | 6028 | 1522 | 1522 | 20.74% | 25.25% | 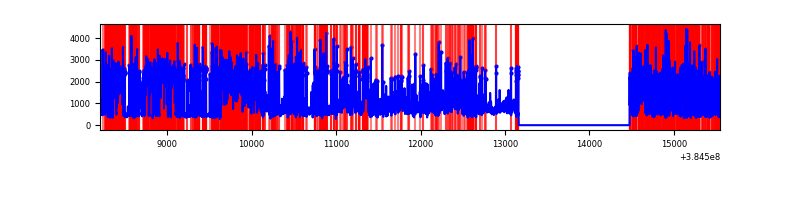 |
| B | 7340 | 6028 | 1957 | 1957 | 26.66% | 32.47% | 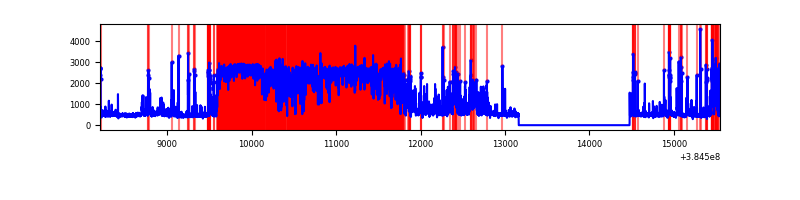 |
| C | 7340 | 6028 | 31 | 31 | 0.42% | 0.51% | 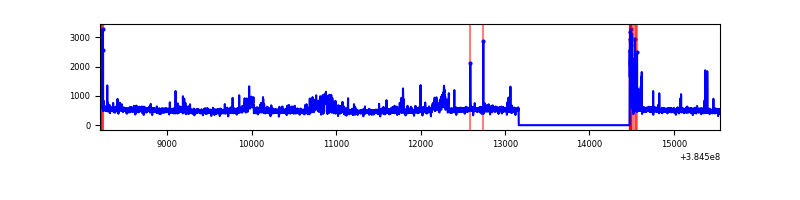 |
| D | 7339 | 6027 | 103 | 103 | 1.40% | 1.71% | 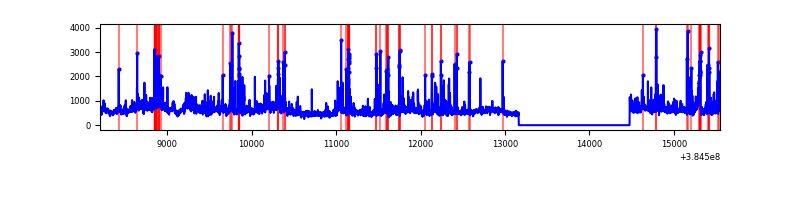 |
Top three noisy pixels from each quadrant. If the there are fewer than three noisy pixels in the level2.evt file, extra rows are filled as -1
| Pixel properties | Quadrant properties | ||||||
|---|---|---|---|---|---|---|---|
| Quadrant | DetID | PixID | Counts | Sigma | Mean | Median | Sigma |
| A | 15 | 169 | 5413078 | 47421.87 | 563 | 549 | 114.1 |
| A | 15 | 237 | 58568 | 508.33 | 563 | 549 | 114.1 |
| A | 10 | 83 | 41724 | 360.75 | 563 | 549 | 114.1 |
| B | 5 | 14 | 1583584 | 13983.16 | 592 | 576 | 113.2 |
| B | 5 | 31 | 1571902 | 13879.97 | 592 | 576 | 113.2 |
| B | 5 | 15 | 1568651 | 13851.25 | 592 | 576 | 113.2 |
| C | 15 | 214 | 278808 | 1794.05 | 669 | 674 | 155.0 |
| C | 8 | 111 | 182127 | 1170.42 | 669 | 674 | 155.0 |
| C | 0 | 10 | 128491 | 824.46 | 669 | 674 | 155.0 |
| D | 8 | 195 | 663143 | 4044.06 | 672 | 653 | 163.8 |
| D | 2 | 249 | 110191 | 668.66 | 672 | 653 | 163.8 |
| D | 12 | 233 | 90475 | 548.3 | 672 | 653 | 163.8 |
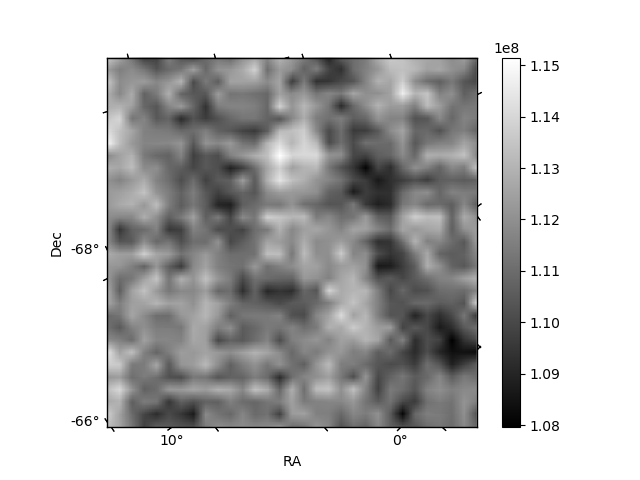
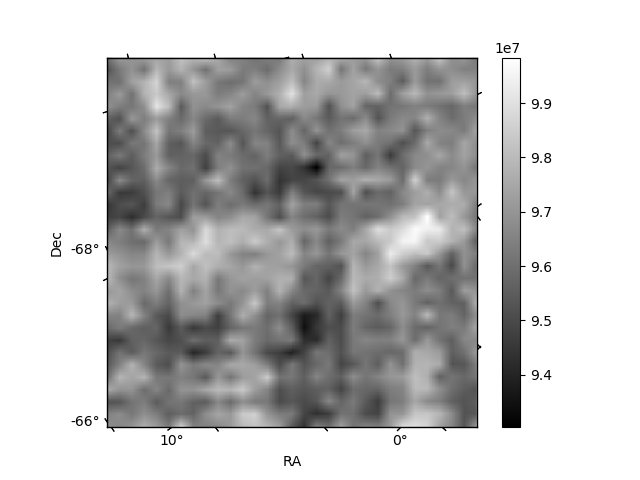
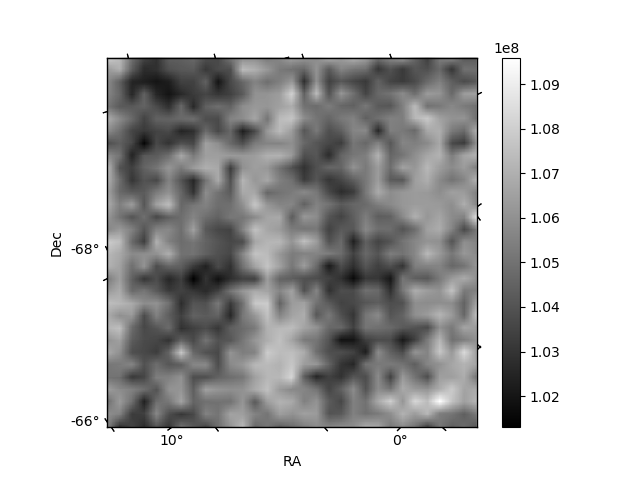
Histogram calculated using DETX and DETY for each event in the final _common_clean file
| Quadrant A | 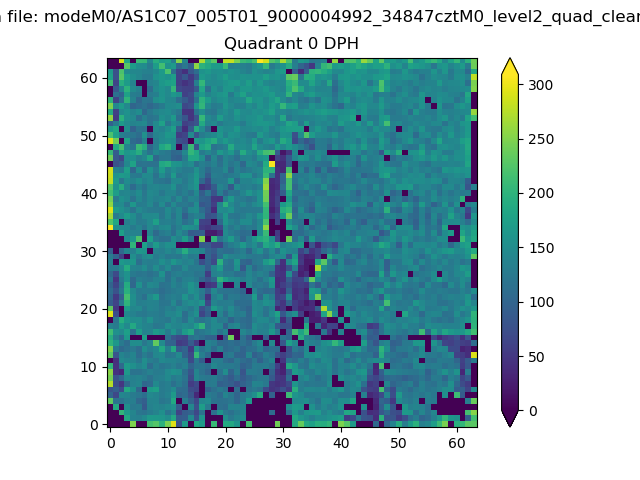 |
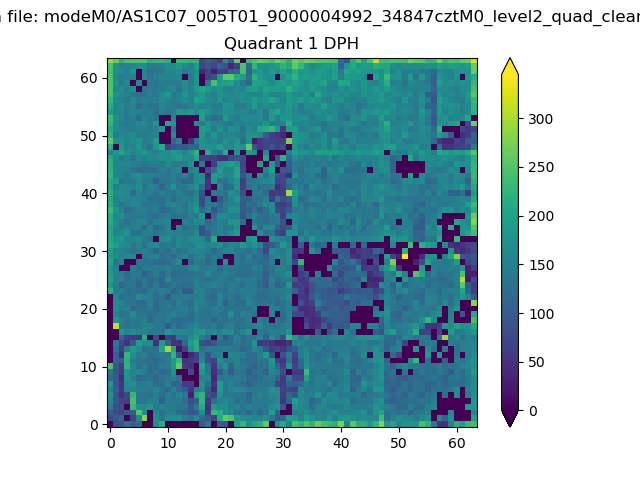 |
Quadrant B |
|---|---|---|---|
| Quadrant D | 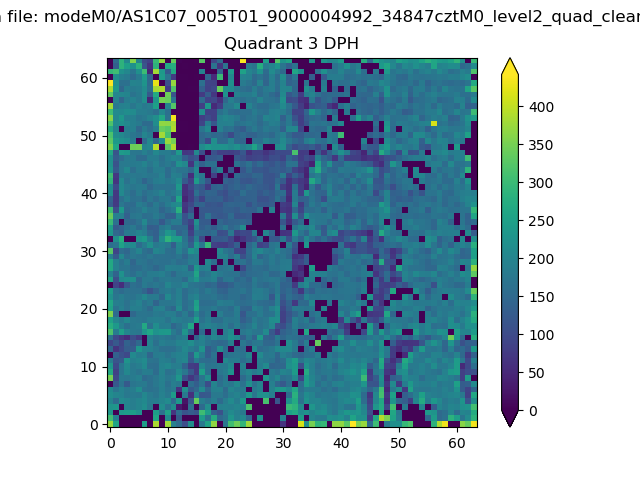 |
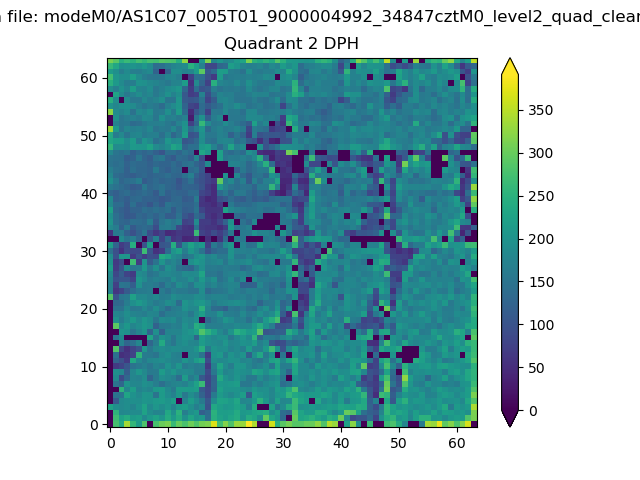 |
Quadrant C |
| Plot type | Count rate plots | Images |
|---|---|---|
| Comparison with Poisson distribution Blue bars denote a histogram of data divided into 1 sec bins. Red curve is a Poisson curve with rate = median count rate of data. |
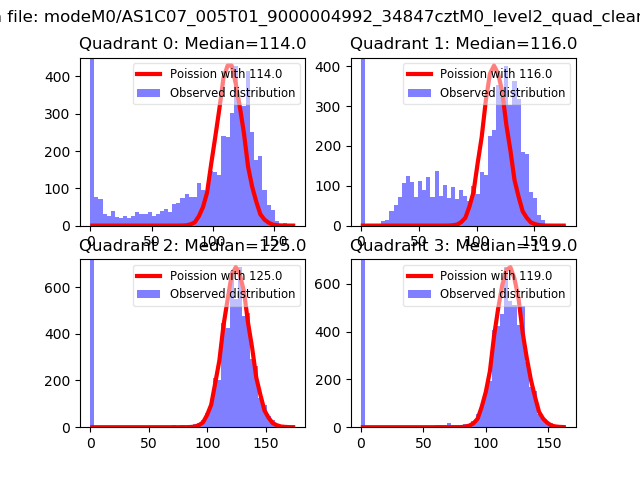 |
 |
| Quadrant-wise count rates Data is divided into 100 sec bins |
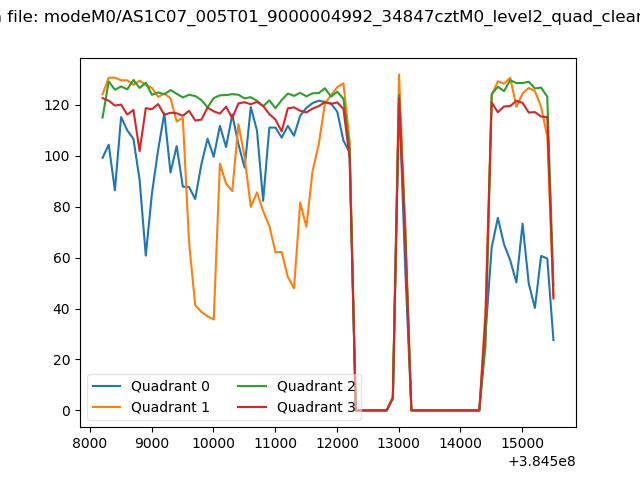 |
|
| Module-wise count rates for Quadrant A Data is divided into 100 sec bins |
 |
 |
| Module-wise count rates for Quadrant B Data is divided into 100 sec bins |
 |
 |
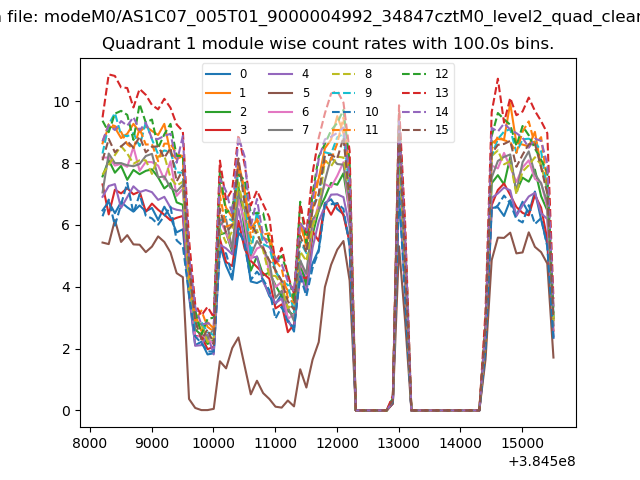
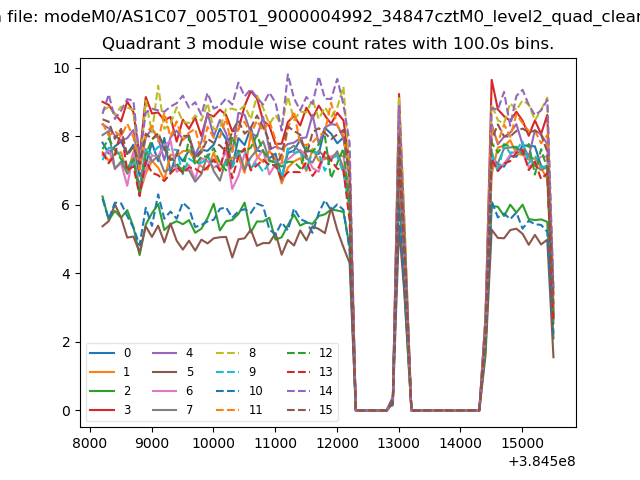
| Module-wise count rates for Quadrant C Data is divided into 100 sec bins |
 |
 |
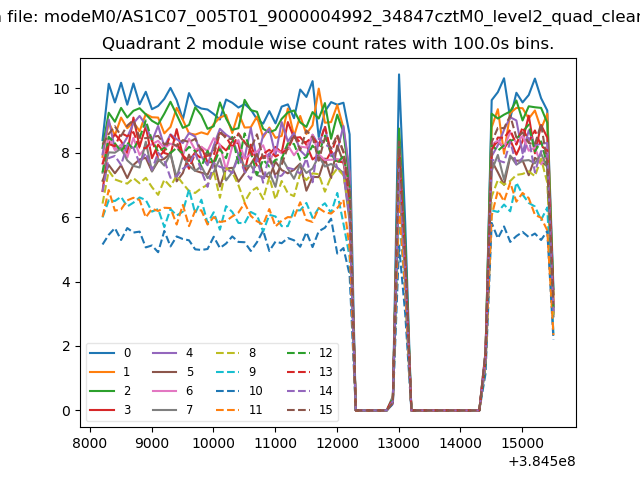
| Module-wise count rates for Quadrant D Data is divided into 100 sec bins |
 |
 |
| Parameter | Plot |
|---|---|
| CZT HV Monitor | 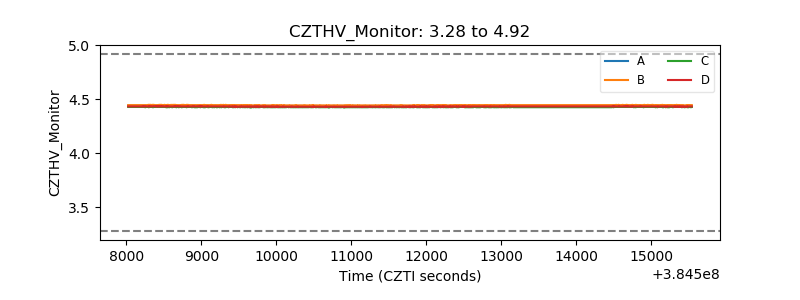 |
| D_VDD | 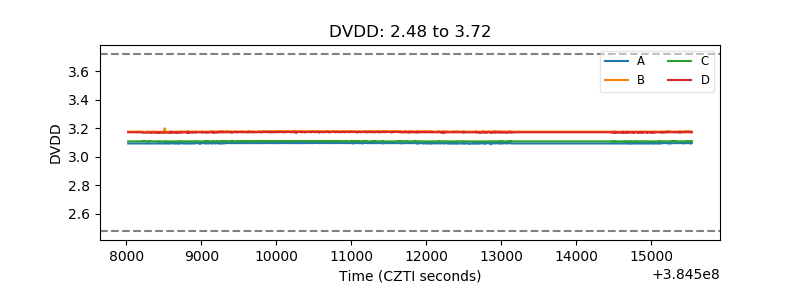 |
| Temperature 1 | 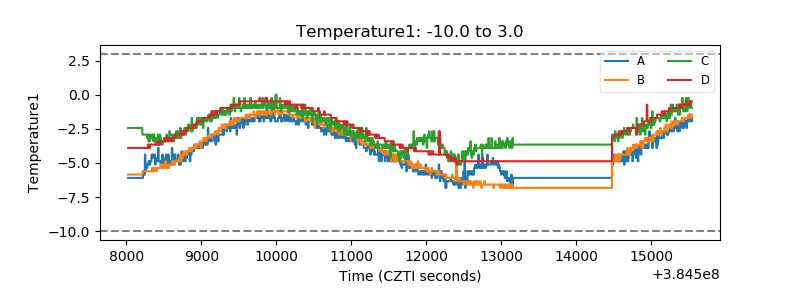 |
| Veto HV Monitor |  |
| Veto LLD | 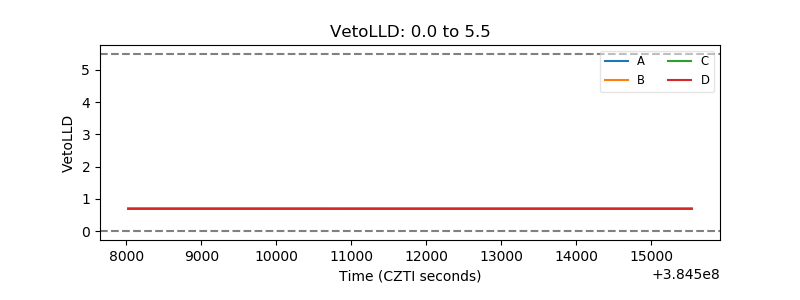 |
| Alpha Counter | 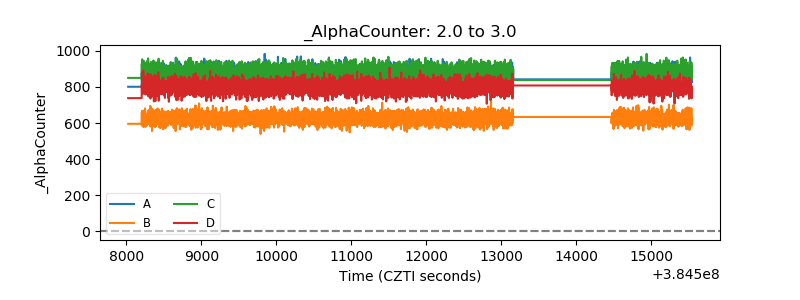 |
| _CPM_Rate | 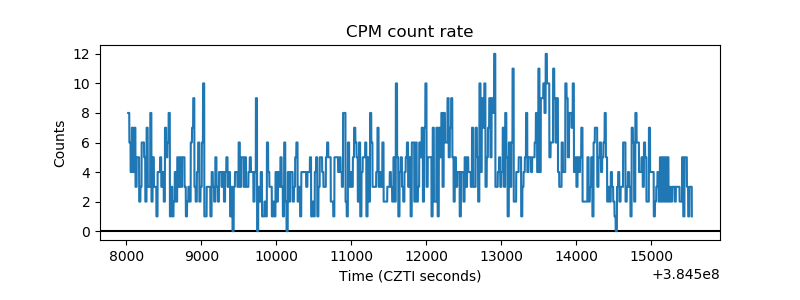 |
| CZT Counter | 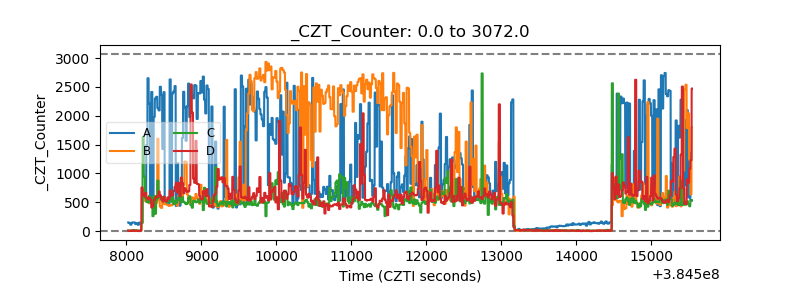 |
| +2.5 Volts monitor |  |
| +5 Volts monitor |  |
| _ROLL_ROT | 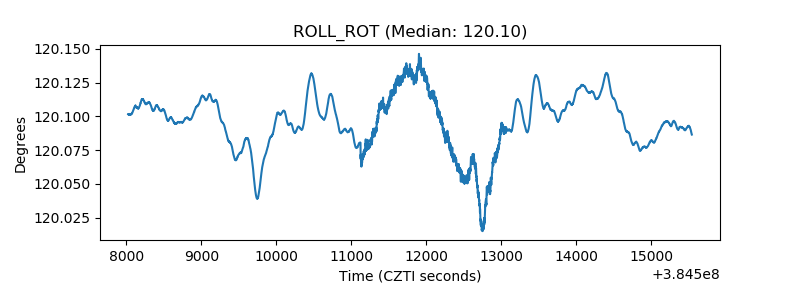 |
| _Roll_DEC | 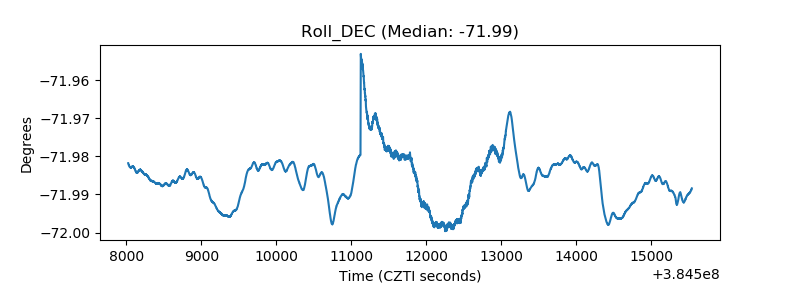 |
| _Roll_RA | 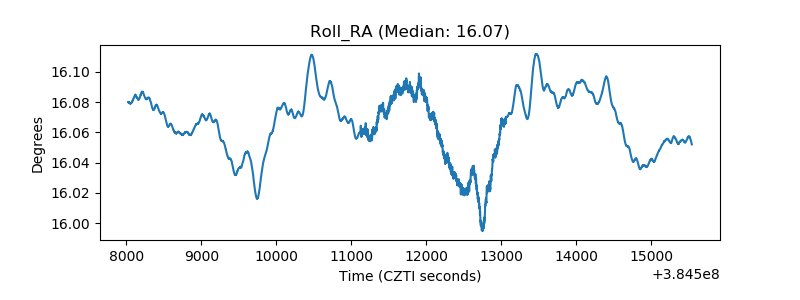 |
| Veto Counter | 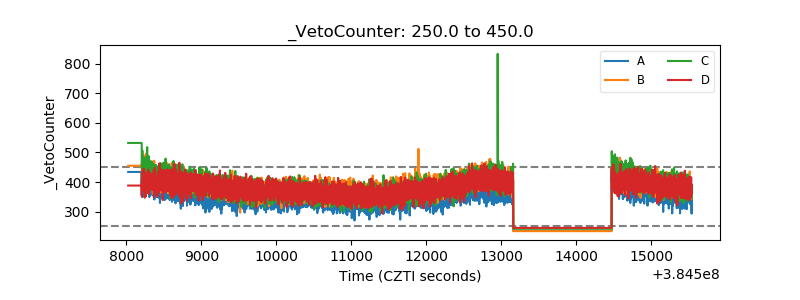 |