| Param | Original file | Final file |
|---|---|---|
| Filename | modeM0/AS1C07_005T01_9000004992_34851cztM0_level2.evt | modeM0/AS1C07_005T01_9000004992_34851cztM0_level2_quad_clean.evt |
| Size (bytes) | 870,344,640 | 78,750,720 |
| Size | 830.0 MB | 75.1 MB |
| Events in quadrant A | 12,419,181 | 266,754 |
| Events in quadrant B | 6,746,658 | 543,753 |
| Events in quadrant C | 3,069,367 | 601,591 |
| Events in quadrant D | 3,744,028 | 576,753 |
| Mode M9 | |||
|---|---|---|---|
| Quadrant | BADHDUFLAG | Total packets | Discarded packets |
| A | 0 | 18 | 0 |
| B | 0 | 18 | 0 |
| C | 0 | 18 | 0 |
| D | 0 | 19 | 0 |
| Mode M0 | |||
|---|---|---|---|
| Quadrant | BADHDUFLAG | Total packets | Discarded packets |
| A | 0 | 40747 | 3 |
| B | 0 | 23708 | 2 |
| C | 0 | 12532 | 2 |
| D | 0 | 14903 | 2 |
| Mode SS | |||
|---|---|---|---|
| Quadrant | BADHDUFLAG | Total packets | Discarded packets |
| A | 0 | 114 | 0 |
| B | 0 | 114 | 0 |
| C | 0 | 114 | 0 |
| D | 0 | 114 | 0 |
| Quadrant | Total seconds | Saturated seconds | Saturation percentage |
|---|---|---|---|
| A | 5623 | 4749 | 84.456696% |
| B | 5623 | 1457 | 25.911435% |
| C | 5623 | 87 | 1.547217% |
| D | 5623 | 114 | 2.027388% |
Noise dominated data is calculated using 1-second bins in cleaned event files. If a bin has >2000 counts, and if more than 50% of those come from <1% of pixels, then it is considered to be noise-dominated and hence unusable.
| Quadrant | # 1 sec bins | Bins with >0 counts | Bins with >2000 counts | High rate bins dominated by noise | Noise dominated (total time) | Noise dominated (detector-on time) | Marked lightcurve |
|---|---|---|---|---|---|---|---|
| A | 7205 | 5623 | 4299 | 4299 | 59.67% | 76.45% | 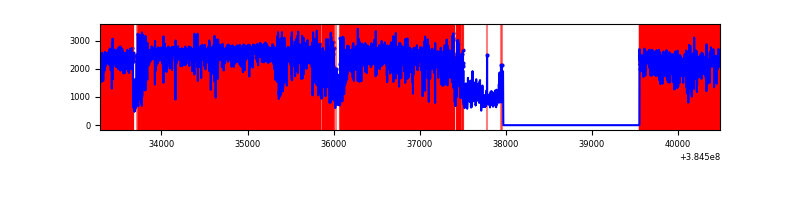 |
| B | 7205 | 5623 | 1330 | 1330 | 18.46% | 23.65% | 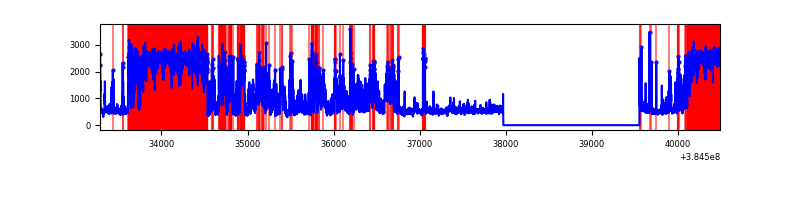 |
| C | 7206 | 5624 | 71 | 71 | 0.99% | 1.26% | 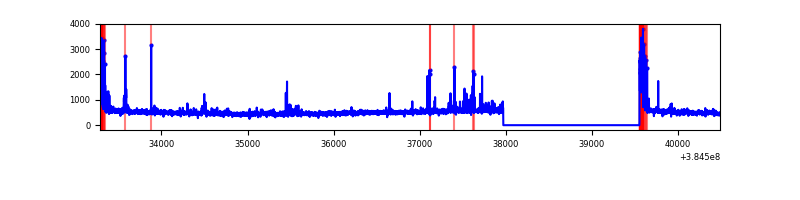 |
| D | 7206 | 5624 | 98 | 98 | 1.36% | 1.74% | 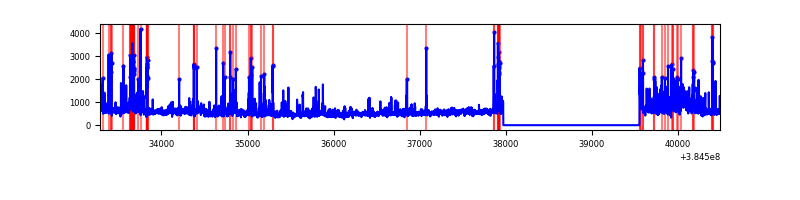 |
Top three noisy pixels from each quadrant. If the there are fewer than three noisy pixels in the level2.evt file, extra rows are filled as -1
| Pixel properties | Quadrant properties | ||||||
|---|---|---|---|---|---|---|---|
| Quadrant | DetID | PixID | Counts | Sigma | Mean | Median | Sigma |
| A | 15 | 169 | 11044627 | 161723.49 | 336 | 329 | 68.3 |
| A | 7 | 3 | 21191 | 305.49 | 336 | 329 | 68.3 |
| A | 10 | 83 | 18073 | 259.83 | 336 | 329 | 68.3 |
| B | 5 | 14 | 1262600 | 11423.49 | 578 | 564 | 110.5 |
| B | 5 | 31 | 1255944 | 11363.24 | 578 | 564 | 110.5 |
| B | 5 | 15 | 1253455 | 11340.71 | 578 | 564 | 110.5 |
| C | 15 | 214 | 256613 | 1782.46 | 617 | 621 | 143.6 |
| C | 0 | 10 | 203168 | 1410.33 | 617 | 621 | 143.6 |
| C | 12 | 250 | 99102 | 685.72 | 617 | 621 | 143.6 |
| D | 8 | 195 | 675166 | 4464.18 | 616 | 600 | 151.1 |
| D | 2 | 250 | 187124 | 1234.39 | 616 | 600 | 151.1 |
| D | 12 | 233 | 178333 | 1176.21 | 616 | 600 | 151.1 |
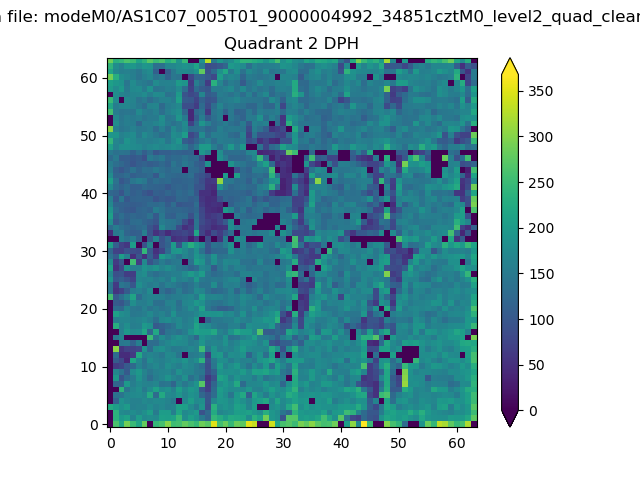
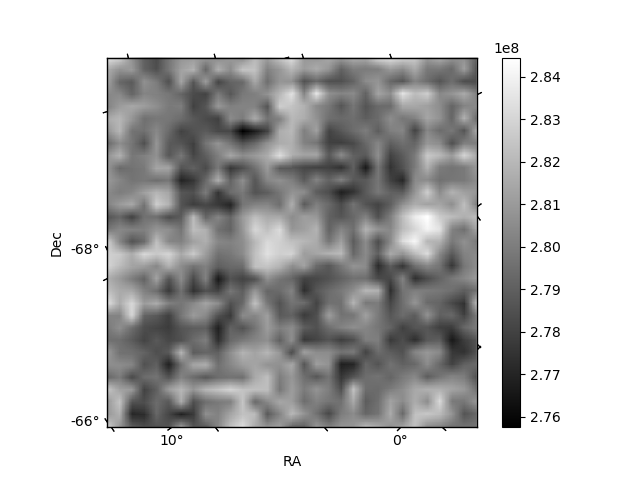
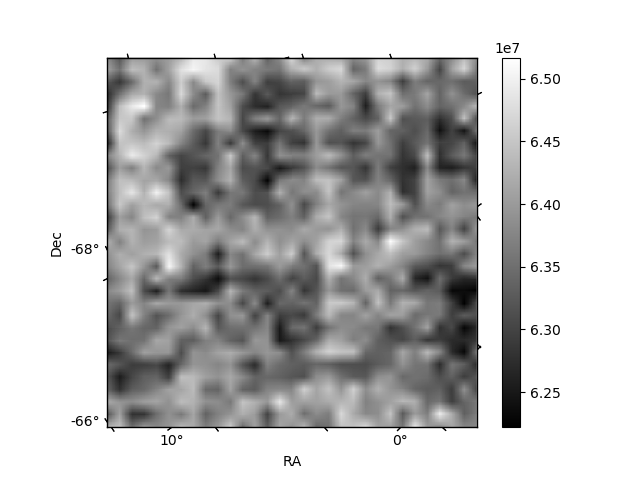
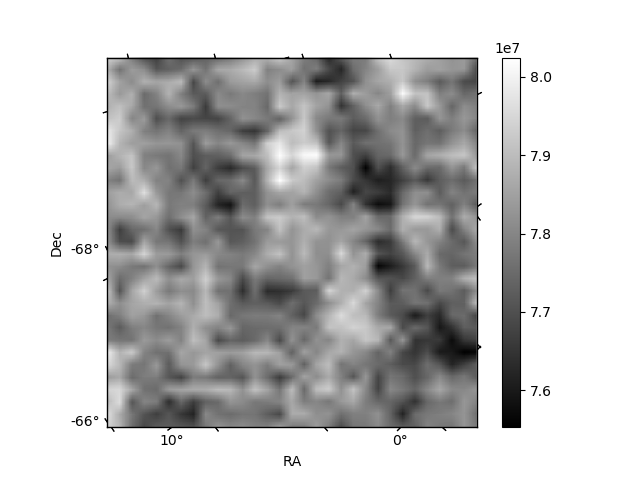
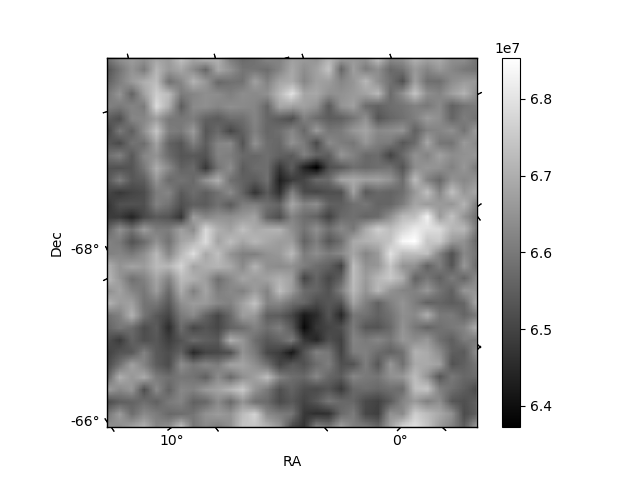
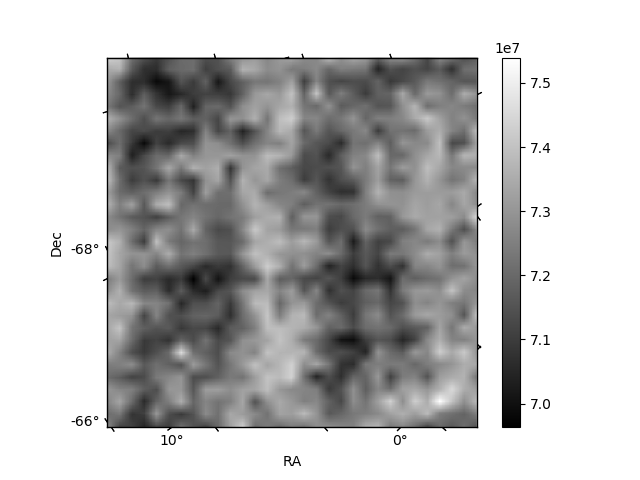
Histogram calculated using DETX and DETY for each event in the final _common_clean file
| Quadrant A | 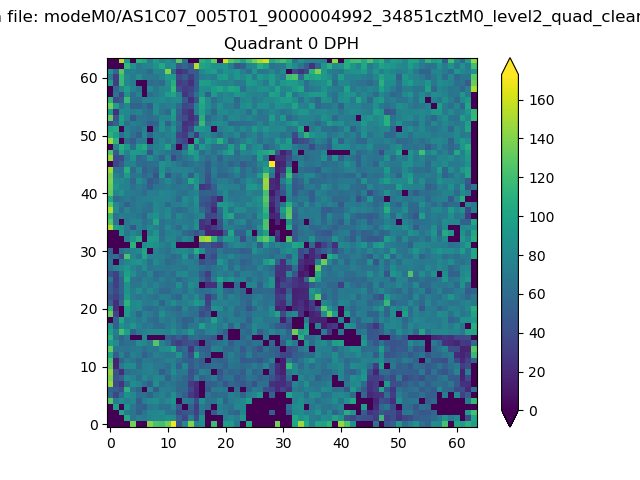 |
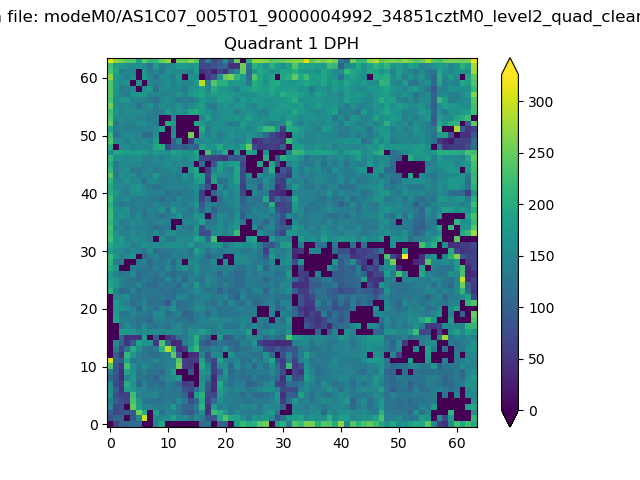 |
Quadrant B |
|---|---|---|---|
| Quadrant D | 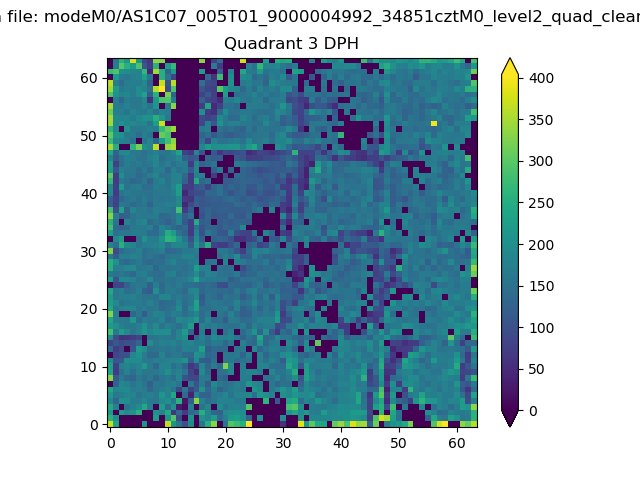 |
 |
Quadrant C |
| Plot type | Count rate plots | Images |
|---|---|---|
| Comparison with Poisson distribution Blue bars denote a histogram of data divided into 1 sec bins. Red curve is a Poisson curve with rate = median count rate of data. |
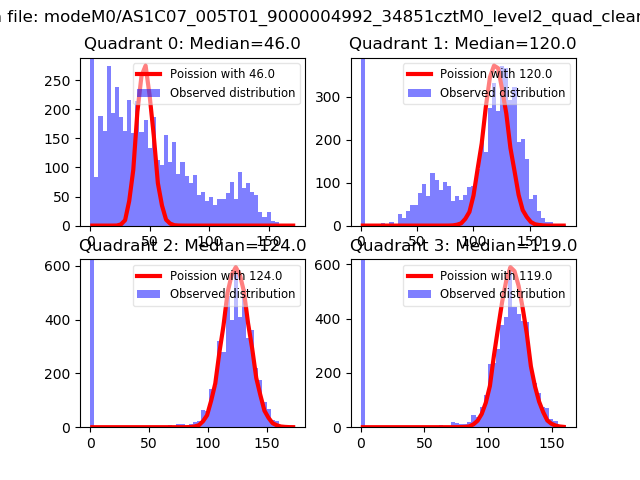 |
 |
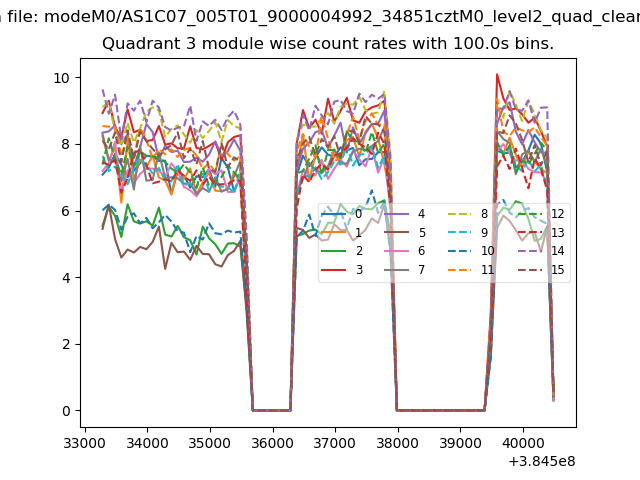
| Quadrant-wise count rates Data is divided into 100 sec bins |
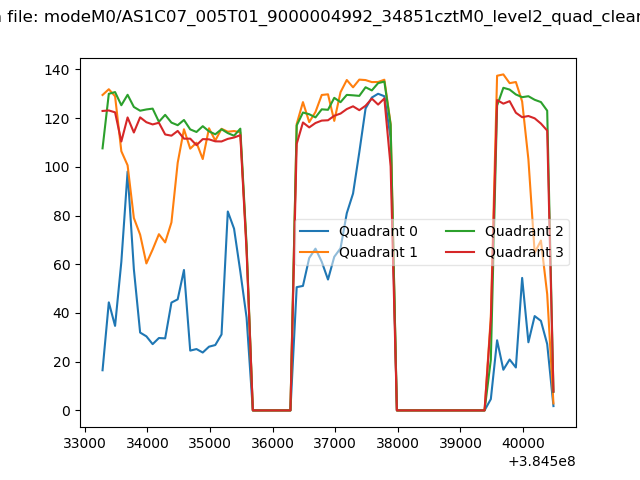 |
|
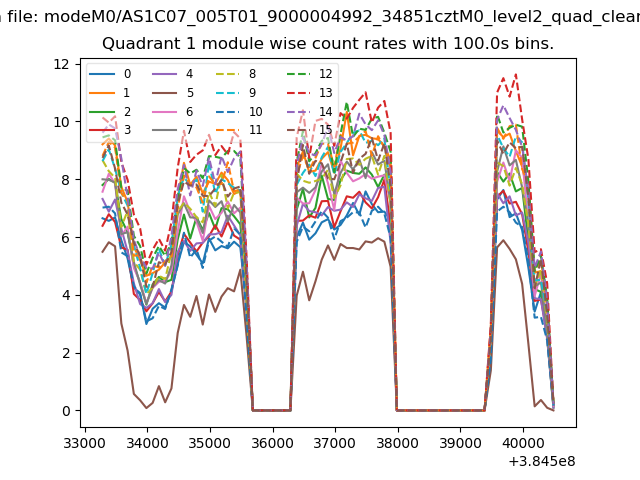
| Module-wise count rates for Quadrant A Data is divided into 100 sec bins |
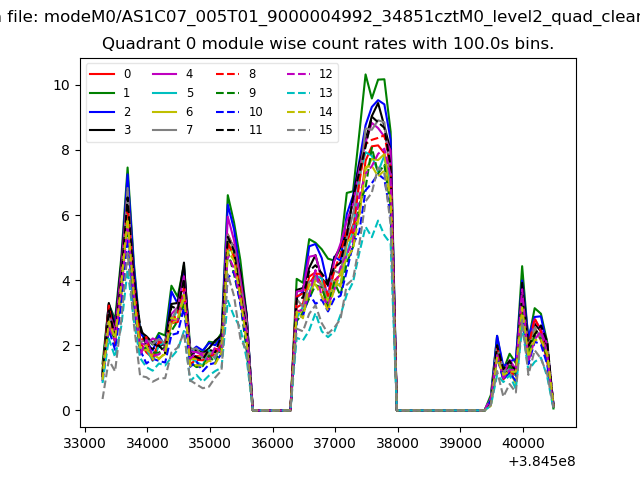 |
 |
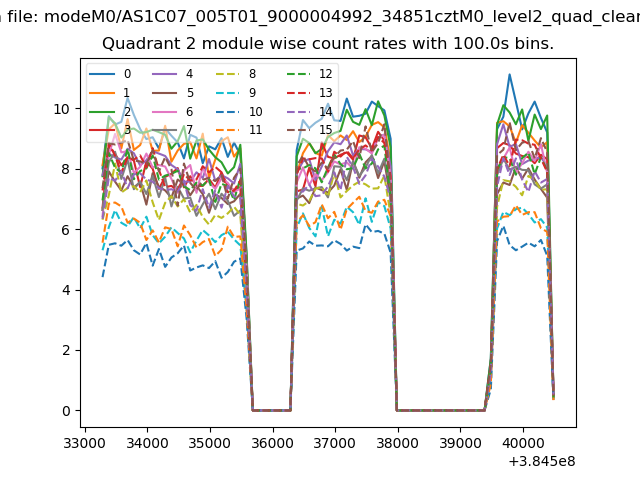
| Module-wise count rates for Quadrant B Data is divided into 100 sec bins |
 |
 |
| Module-wise count rates for Quadrant C Data is divided into 100 sec bins |
 |
 |
| Module-wise count rates for Quadrant D Data is divided into 100 sec bins |
 |
 |
| Parameter | Plot |
|---|---|
| CZT HV Monitor | 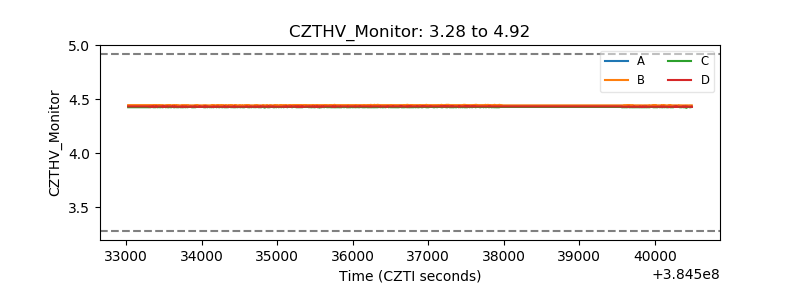 |
| D_VDD | 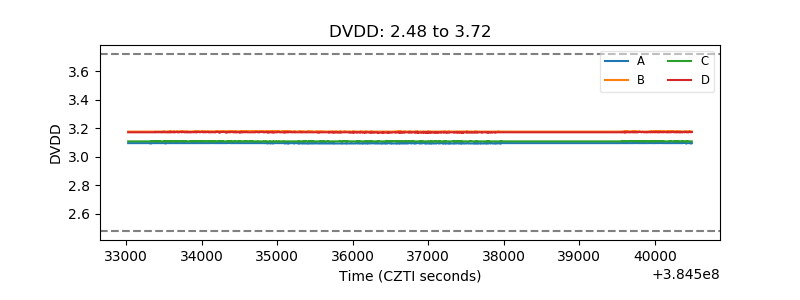 |
| Temperature 1 |  |
| Veto HV Monitor | 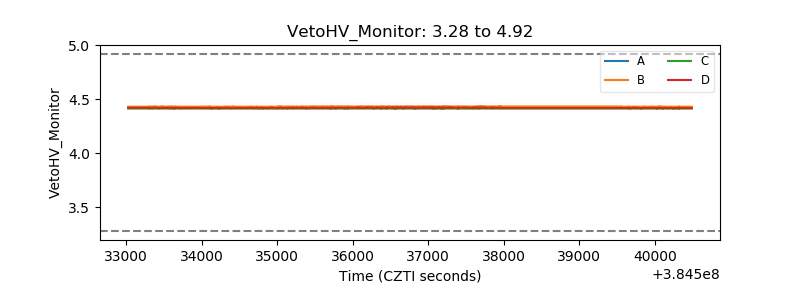 |
| Veto LLD | 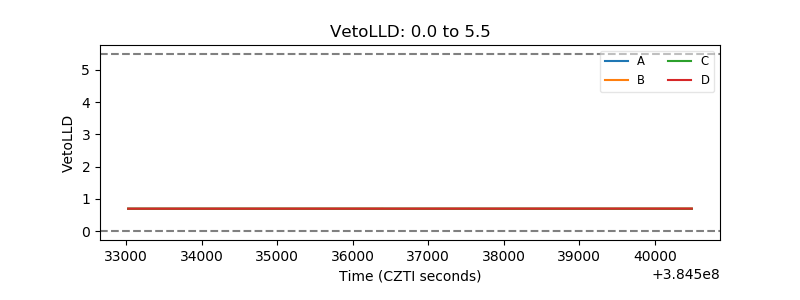 |
| Alpha Counter | 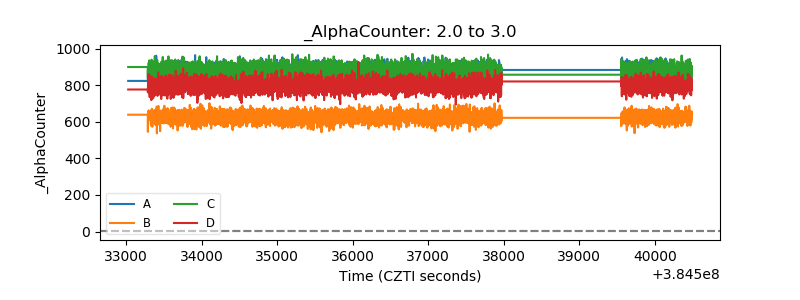 |
| _CPM_Rate | 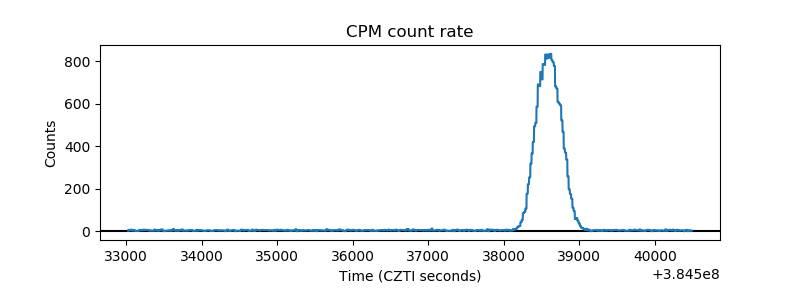 |
| CZT Counter | 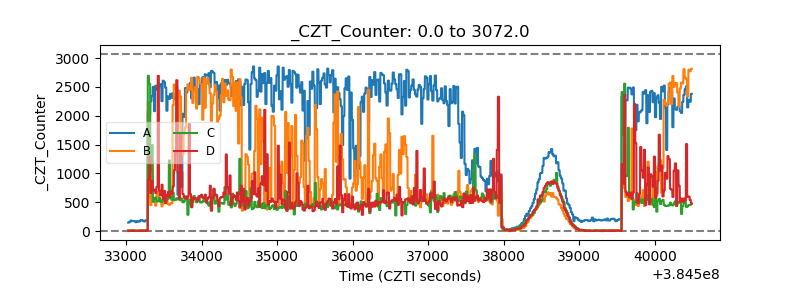 |
| +2.5 Volts monitor |  |
| +5 Volts monitor |  |
| _ROLL_ROT | 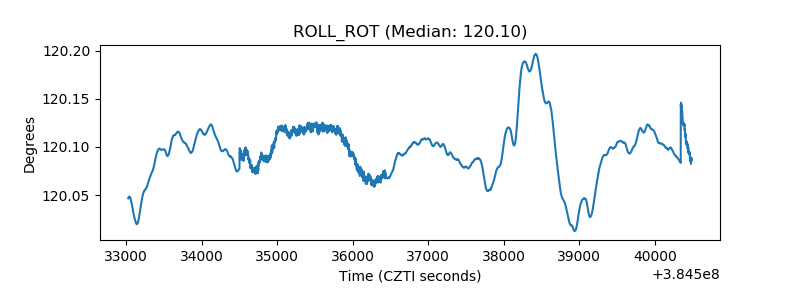 |
| _Roll_DEC | 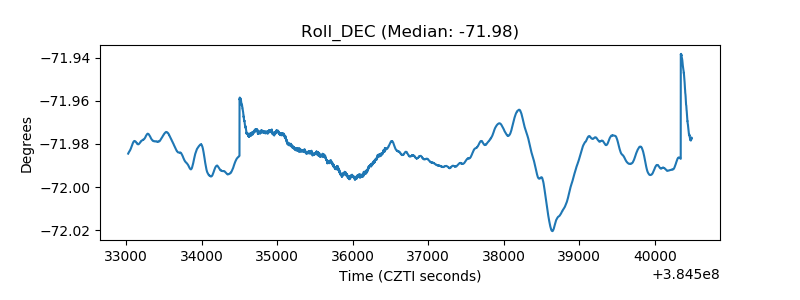 |
| _Roll_RA | 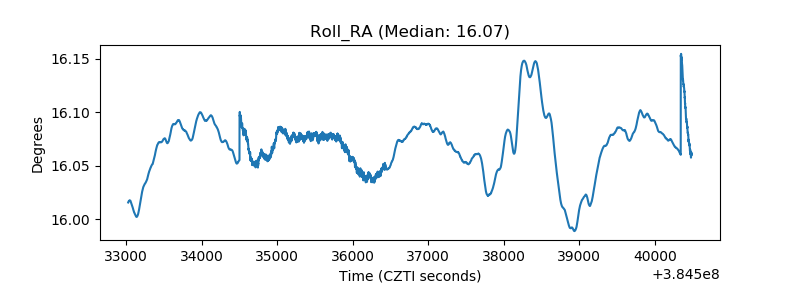 |
| Veto Counter | 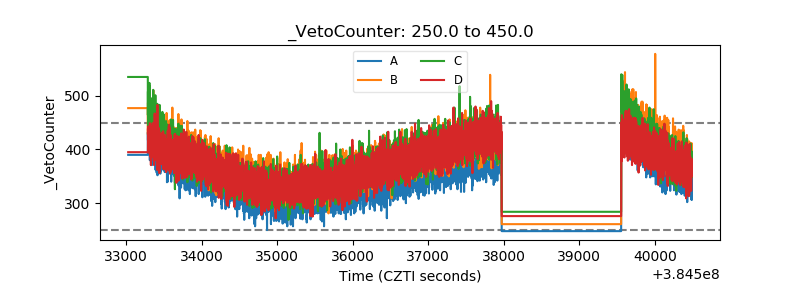 |