| Param | Original file | Final file |
|---|---|---|
| Filename | modeM0/AS1C07_005T01_9000004992_34876cztM0_level2.evt | modeM0/AS1C07_005T01_9000004992_34876cztM0_level2_quad_clean.evt |
| Size (bytes) | 513,374,400 | 95,650,560 |
| Size | 489.6 MB | 91.2 MB |
| Events in quadrant A | 3,088,523 | 631,223 |
| Events in quadrant B | 4,846,352 | 609,463 |
| Events in quadrant C | 3,115,050 | 638,312 |
| Events in quadrant D | 4,095,762 | 603,500 |
| Mode M9 | |||
|---|---|---|---|
| Quadrant | BADHDUFLAG | Total packets | Discarded packets |
| A | 0 | 21 | 0 |
| B | 0 | 21 | 0 |
| C | 0 | 21 | 0 |
| D | 0 | 22 | 0 |
| Mode M0 | |||
|---|---|---|---|
| Quadrant | BADHDUFLAG | Total packets | Discarded packets |
| A | 0 | 13043 | 3 |
| B | 0 | 18305 | 2 |
| C | 0 | 12732 | 2 |
| D | 0 | 15902 | 2 |
| Mode SS | |||
|---|---|---|---|
| Quadrant | BADHDUFLAG | Total packets | Discarded packets |
| A | 0 | 118 | 0 |
| B | 0 | 118 | 0 |
| C | 0 | 118 | 0 |
| D | 0 | 118 | 0 |
| Quadrant | Total seconds | Saturated seconds | Saturation percentage |
|---|---|---|---|
| A | 5935 | 85 | 1.432182% |
| B | 5935 | 542 | 9.132266% |
| C | 5935 | 44 | 0.741365% |
| D | 5935 | 124 | 2.089301% |
Noise dominated data is calculated using 1-second bins in cleaned event files. If a bin has >2000 counts, and if more than 50% of those come from <1% of pixels, then it is considered to be noise-dominated and hence unusable.
| Quadrant | # 1 sec bins | Bins with >0 counts | Bins with >2000 counts | High rate bins dominated by noise | Noise dominated (total time) | Noise dominated (detector-on time) | Marked lightcurve |
|---|---|---|---|---|---|---|---|
| A | 7248 | 5936 | 54 | 54 | 0.75% | 0.91% | 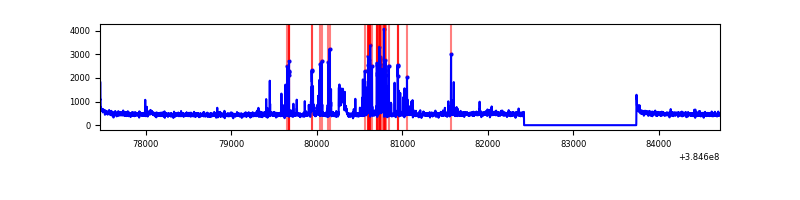 |
| B | 7248 | 5936 | 422 | 422 | 5.82% | 7.11% |  |
| C | 7248 | 5936 | 32 | 32 | 0.44% | 0.54% | 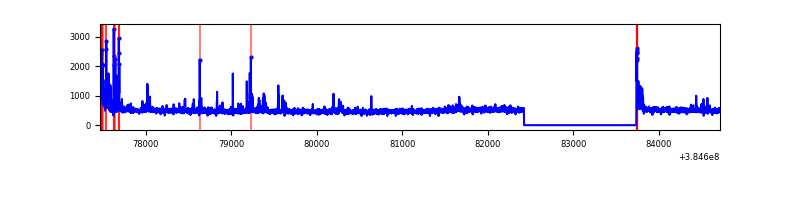 |
| D | 7248 | 5936 | 121 | 121 | 1.67% | 2.04% | 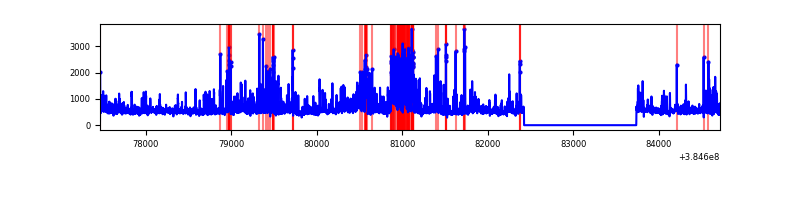 |
Top three noisy pixels from each quadrant. If the there are fewer than three noisy pixels in the level2.evt file, extra rows are filled as -1
| Pixel properties | Quadrant properties | ||||||
|---|---|---|---|---|---|---|---|
| Quadrant | DetID | PixID | Counts | Sigma | Mean | Median | Sigma |
| A | 15 | 237 | 304355 | 2257.36 | 678 | 665 | 134.5 |
| A | 10 | 83 | 56942 | 418.31 | 678 | 665 | 134.5 |
| A | 15 | 169 | 47143 | 345.48 | 678 | 665 | 134.5 |
| B | 5 | 31 | 740089 | 5986.37 | 650 | 634 | 123.5 |
| B | 5 | 200 | 572495 | 4629.59 | 650 | 634 | 123.5 |
| B | 5 | 172 | 462979 | 3742.99 | 650 | 634 | 123.5 |
| C | 15 | 214 | 271357 | 1758.49 | 662 | 665 | 153.9 |
| C | 0 | 207 | 125739 | 812.51 | 662 | 665 | 153.9 |
| C | 0 | 10 | 93932 | 605.89 | 662 | 665 | 153.9 |
| D | 8 | 195 | 625162 | 3861.36 | 660 | 641 | 161.7 |
| D | 10 | 118 | 200262 | 1234.24 | 660 | 641 | 161.7 |
| D | 2 | 31 | 170924 | 1052.84 | 660 | 641 | 161.7 |
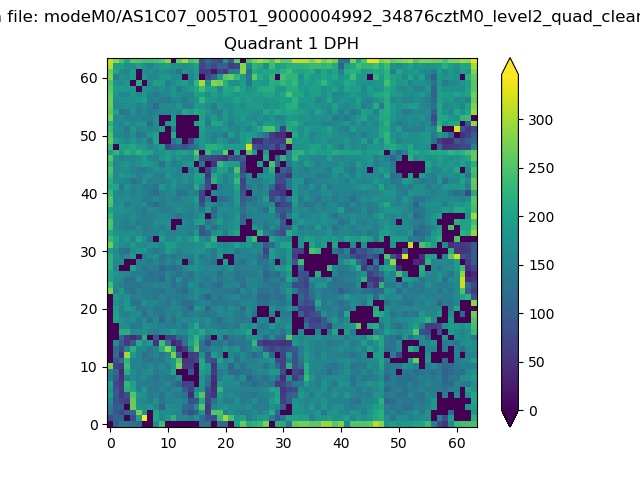
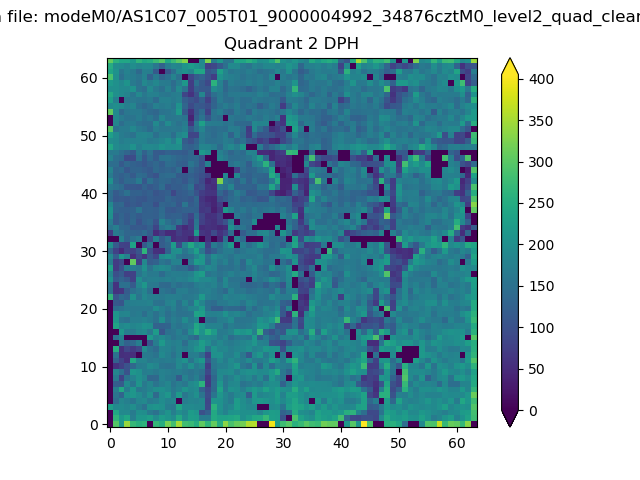
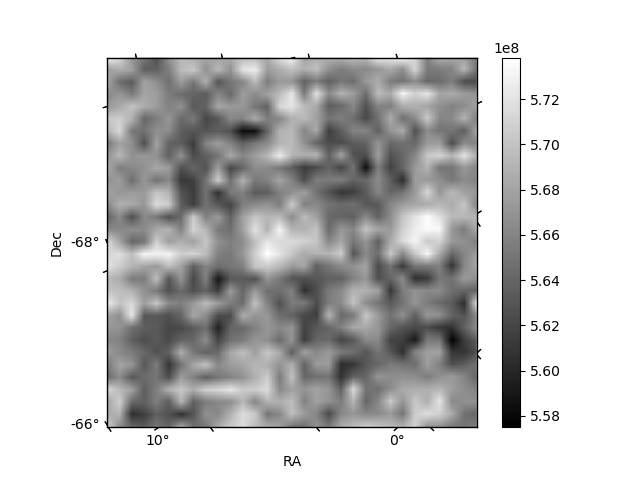
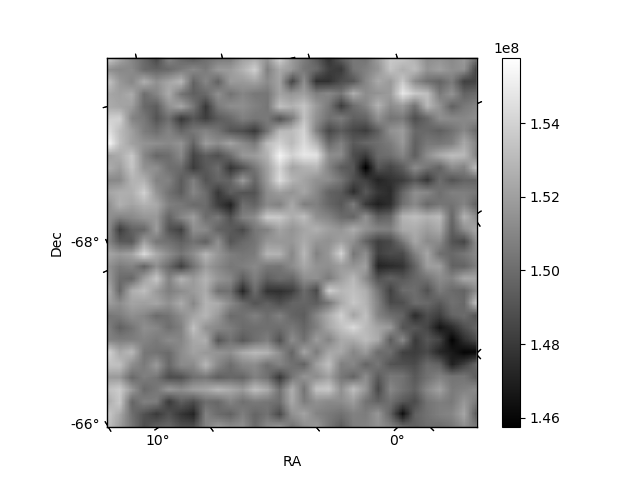
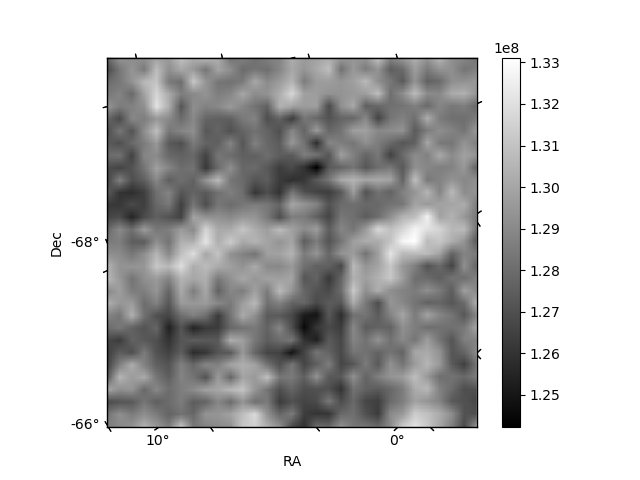
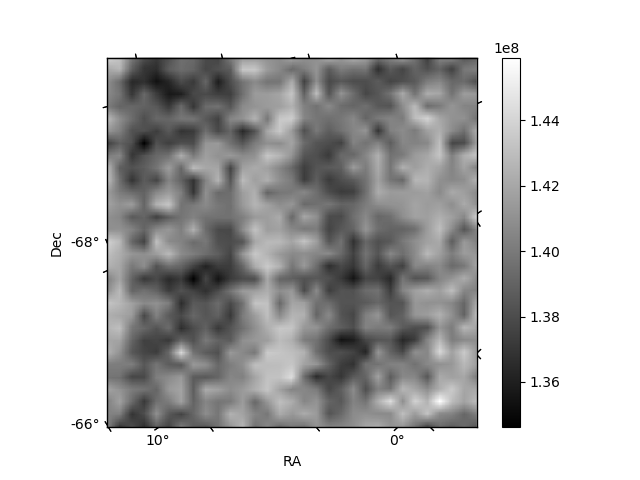
Histogram calculated using DETX and DETY for each event in the final _common_clean file
| Quadrant A | 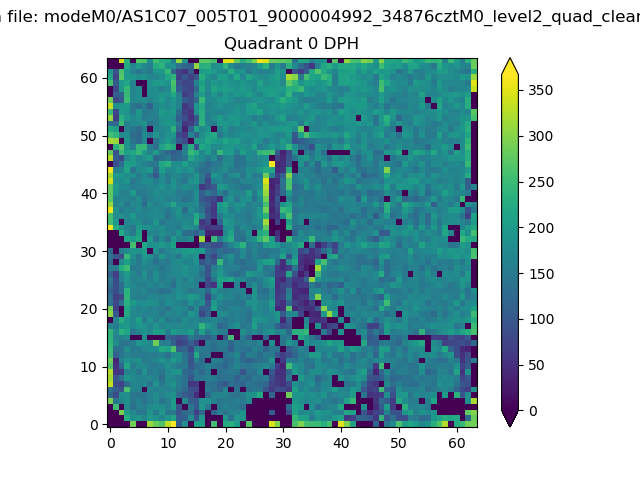 |
 |
Quadrant B |
|---|---|---|---|
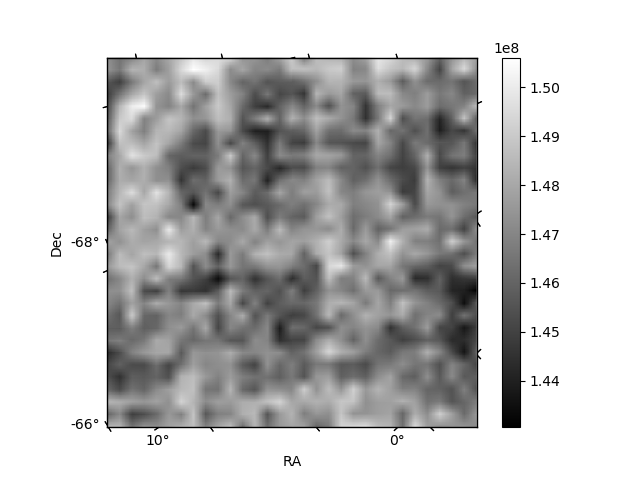
| Quadrant D | 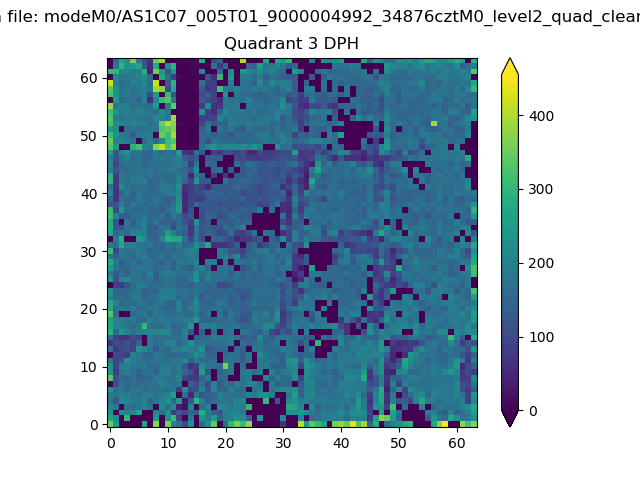 |
 |
Quadrant C |
| Plot type | Count rate plots | Images |
|---|---|---|
| Comparison with Poisson distribution Blue bars denote a histogram of data divided into 1 sec bins. Red curve is a Poisson curve with rate = median count rate of data. |
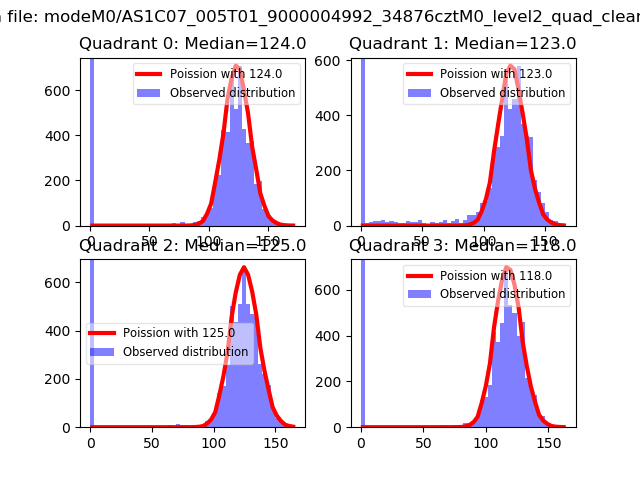 |
 |
| Quadrant-wise count rates Data is divided into 100 sec bins |
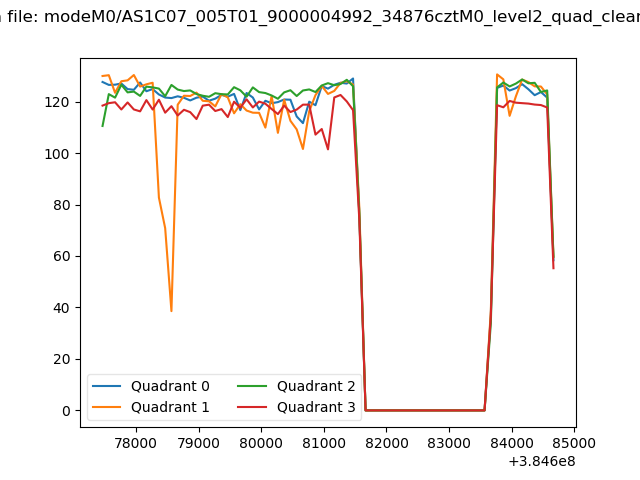 |
|
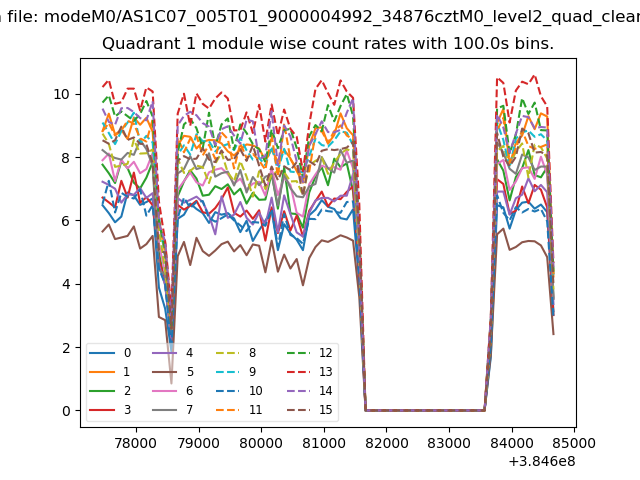
| Module-wise count rates for Quadrant A Data is divided into 100 sec bins |
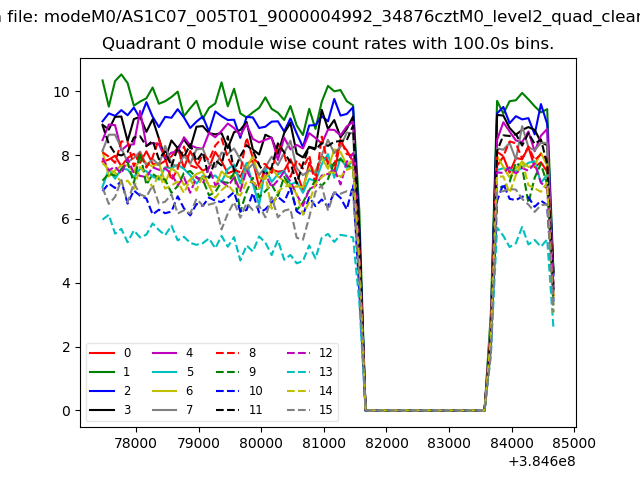 |
 |
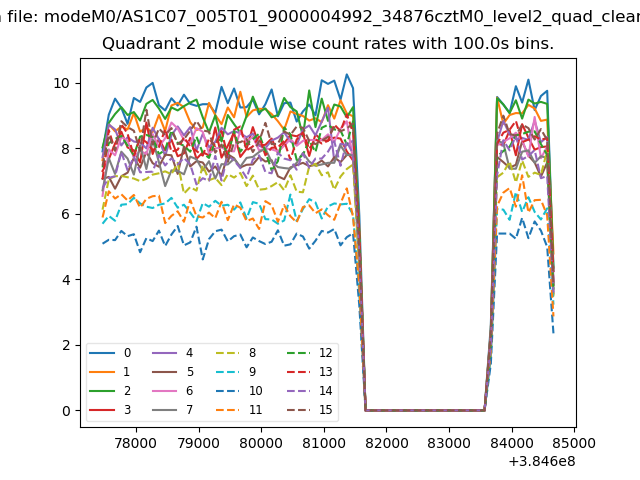
| Module-wise count rates for Quadrant B Data is divided into 100 sec bins |
 |
 |
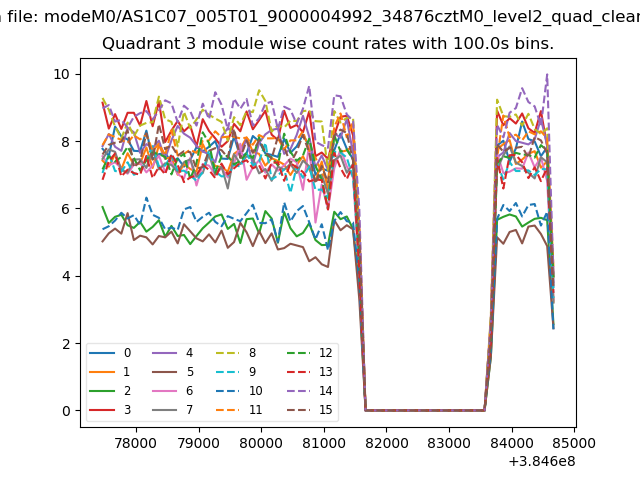
| Module-wise count rates for Quadrant C Data is divided into 100 sec bins |
 |
 |
| Module-wise count rates for Quadrant D Data is divided into 100 sec bins |
 |
 |
| Parameter | Plot |
|---|---|
| CZT HV Monitor | 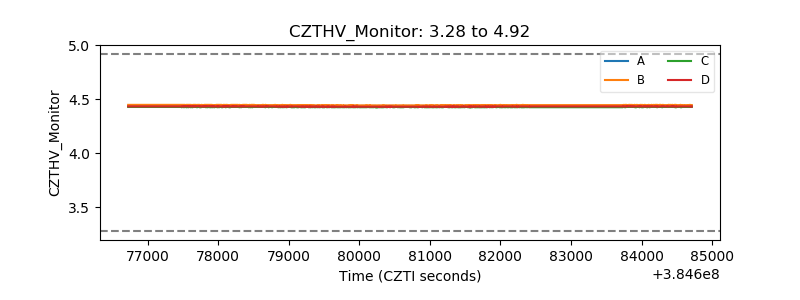 |
| D_VDD | 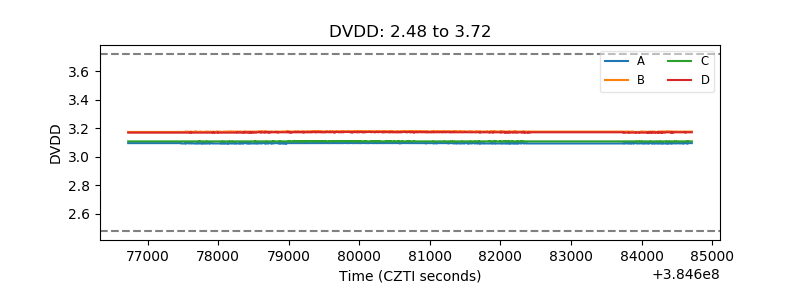 |
| Temperature 1 | 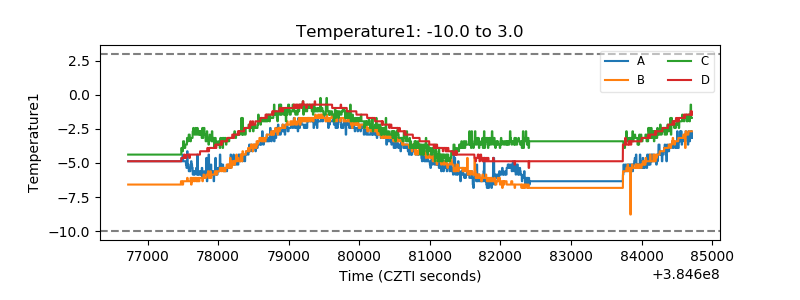 |
| Veto HV Monitor |  |
| Veto LLD | 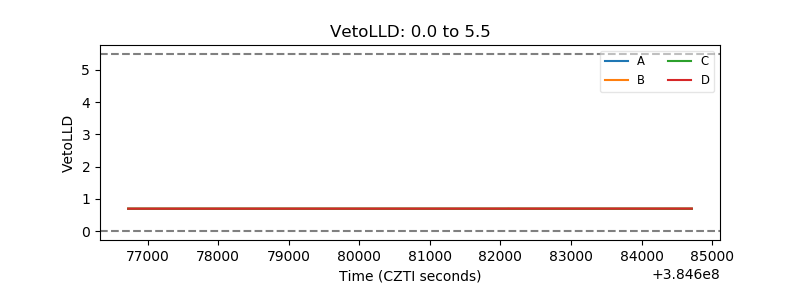 |
| Alpha Counter | 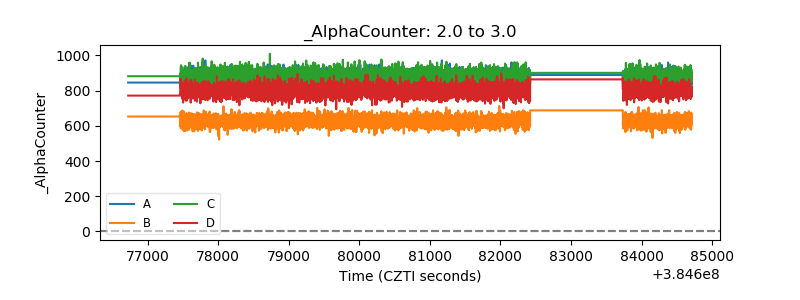 |
| _CPM_Rate | 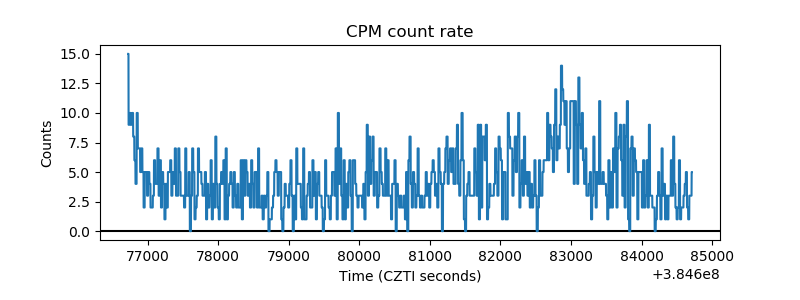 |
| CZT Counter | 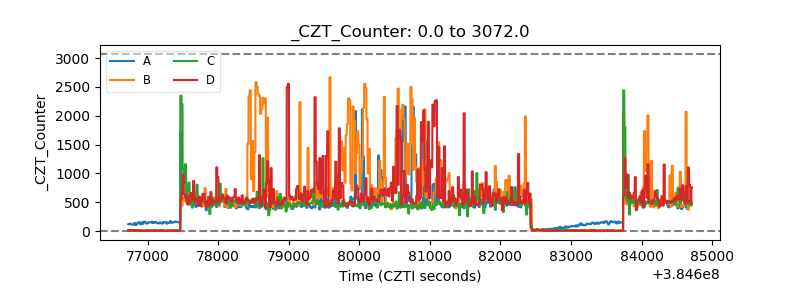 |
| +2.5 Volts monitor |  |
| +5 Volts monitor |  |
| _ROLL_ROT | 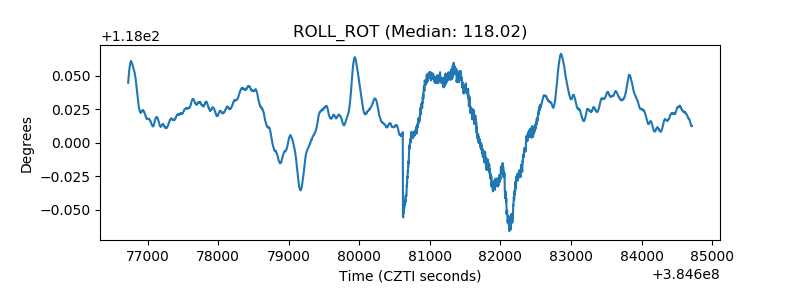 |
| _Roll_DEC | 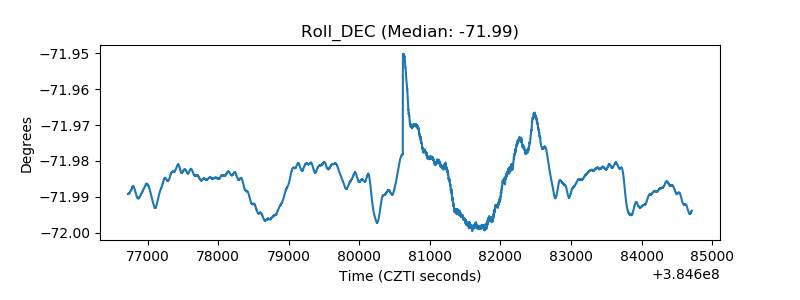 |
| _Roll_RA | 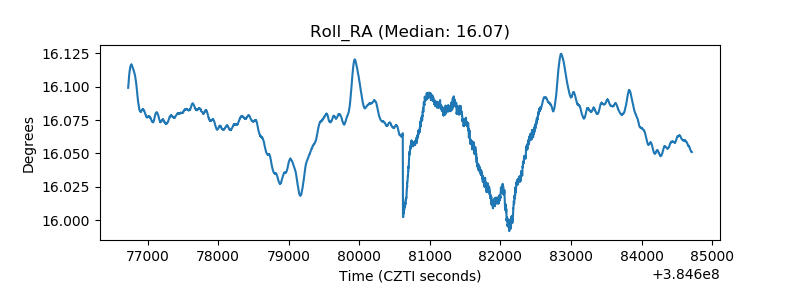 |
| Veto Counter | 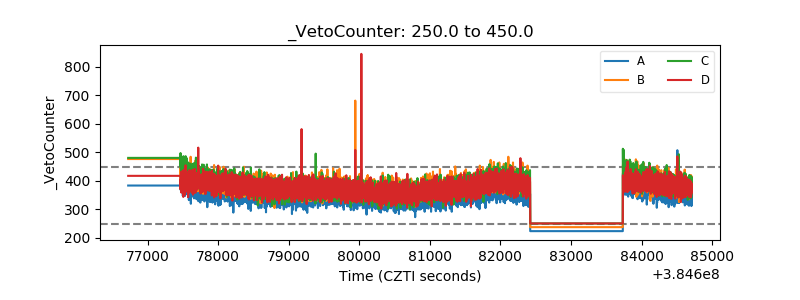 |