| Param | Original file | Final file |
|---|---|---|
| Filename | modeM0/AS1A11_053T01_9000004996cztM0_level2.fits | modeM0/AS1A11_053T01_9000004996cztM0_level2_quad_clean.evt |
| Size (bytes) | 241,191,360 | 260,285,760 |
| Size | 230.0 MB | 248.2 MB |
| Events in quadrant A | 1,484,794 | 1,581,257 |
| Events in quadrant B | 1,430,522 | 1,596,494 |
| Events in quadrant C | 1,485,476 | 1,591,832 |
| Events in quadrant D | 1,226,456 | 1,435,906 |
| Mode M9 | |||
|---|---|---|---|
| Quadrant | BADHDUFLAG | Total packets | Discarded packets |
| A | 0 | 117 | 0 |
| B | 0 | 117 | 0 |
| C | 0 | 117 | 0 |
| D | 0 | 117 | 0 |
| Mode SS | |||
|---|---|---|---|
| Quadrant | BADHDUFLAG | Total packets | Discarded packets |
| A | 0 | 500 | 0 |
| B | 0 | 500 | 0 |
| C | 0 | 500 | 0 |
| D | 0 | 500 | 0 |
| Mode M0 | |||
|---|---|---|---|
| Quadrant | BADHDUFLAG | Total packets | Discarded packets |
| A | 0 | 50063 | 0 |
| B | 0 | 56929 | 0 |
| C | 0 | 52671 | 0 |
| D | 0 | 72506 | 0 |
| Quadrant | Total seconds | Saturated seconds | Saturation percentage |
|---|---|---|---|
| A | 24376 | 27 | 0.110765% |
| B | 24376 | 461 | 1.891204% |
| C | 24376 | 226 | 0.927141% |
| D | 24376 | 1261 | 5.173121% |
Noise dominated data is calculated using 1-second bins in cleaned event files. If a bin has >2000 counts, and if more than 50% of those come from <1% of pixels, then it is considered to be noise-dominated and hence unusable.
| Quadrant | # 1 sec bins | Bins with >0 counts | Bins with >2000 counts | High rate bins dominated by noise | Noise dominated (total time) | Noise dominated (detector-on time) | Marked lightcurve |
|---|---|---|---|---|---|---|---|
| A | 36035 | 24377 | 0 | 0 | 0.00% | 0.00% | 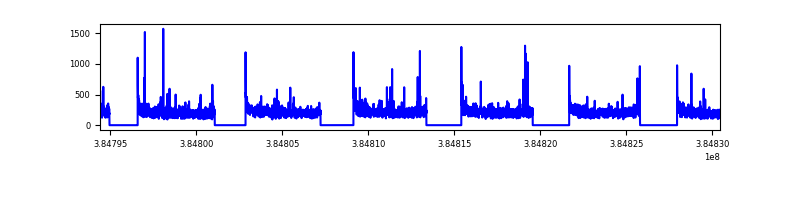 |
| B | 36035 | 24370 | 0 | 0 | 0.00% | 0.00% |  |
| C | 36035 | 24374 | 0 | 0 | 0.00% | 0.00% | 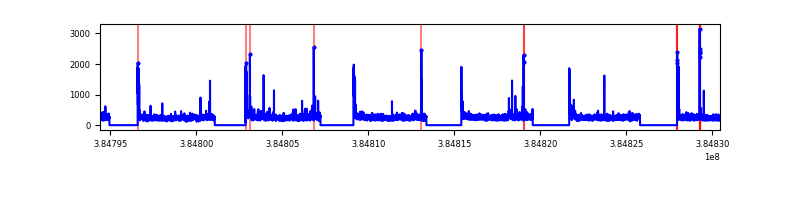 |
| D | 36035 | 24330 | 0 | 0 | 0.00% | 0.00% | 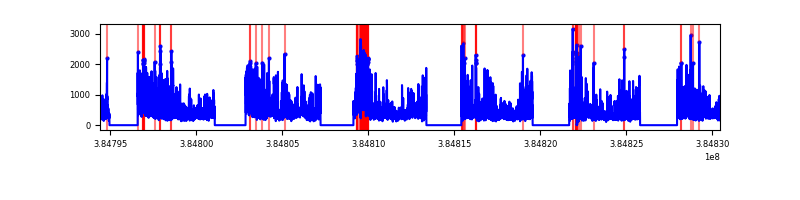 |
Top three noisy pixels from each quadrant. If the there are fewer than three noisy pixels in the level2.evt file, extra rows are filled as -1
| Pixel properties | Quadrant properties | ||||||
|---|---|---|---|---|---|---|---|
| Quadrant | DetID | PixID | Counts | Sigma | Mean | Median | Sigma |
| A | 7 | 110 | 1265 | 9.21 | 388 | 367 | 97.5 |
| A | 9 | 19 | 1235 | 8.9 | 388 | 367 | 97.5 |
| A | 0 | 29 | 1190 | 8.44 | 388 | 367 | 97.5 |
| B | 2 | 9 | 1203 | 11.11 | 379 | 363 | 75.6 |
| B | 3 | 80 | 1123 | 10.05 | 379 | 363 | 75.6 |
| B | 2 | 8 | 1018 | 8.66 | 379 | 363 | 75.6 |
| C | 1 | 81 | 1300 | 9.13 | 393 | 373 | 101.5 |
| C | 1 | 80 | 1242 | 8.56 | 393 | 373 | 101.5 |
| C | 9 | 233 | 1023 | 6.4 | 393 | 373 | 101.5 |
| D | 7 | 3 | 898 | 6.03 | 351 | 323 | 95.4 |
| D | 10 | 189 | 890 | 5.94 | 351 | 323 | 95.4 |
| D | 10 | 113 | 890 | 5.94 | 351 | 323 | 95.4 |
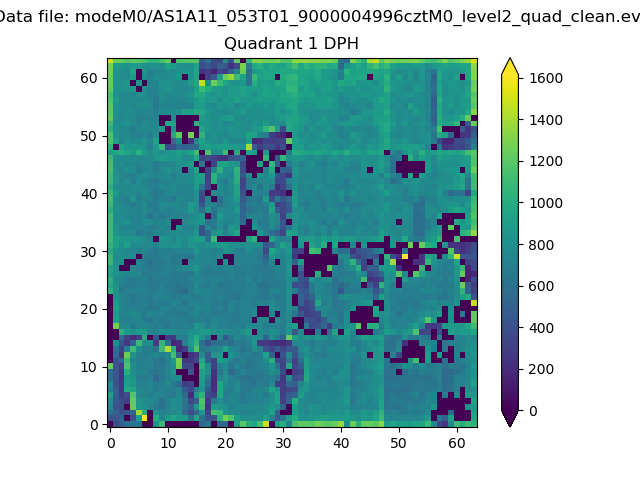
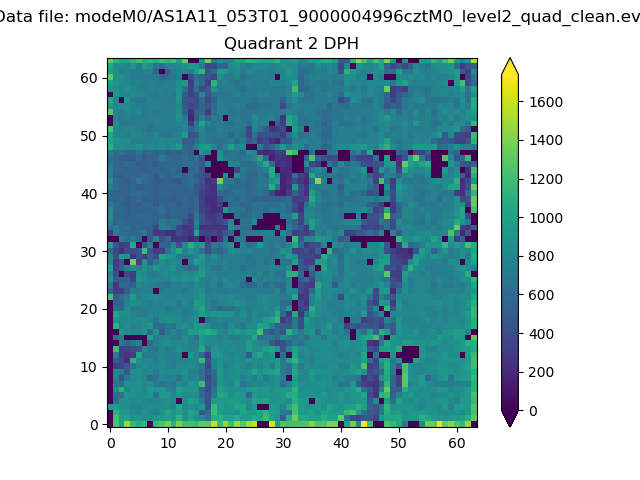
Histogram calculated using DETX and DETY for each event in the final _common_clean file
| Quadrant A | 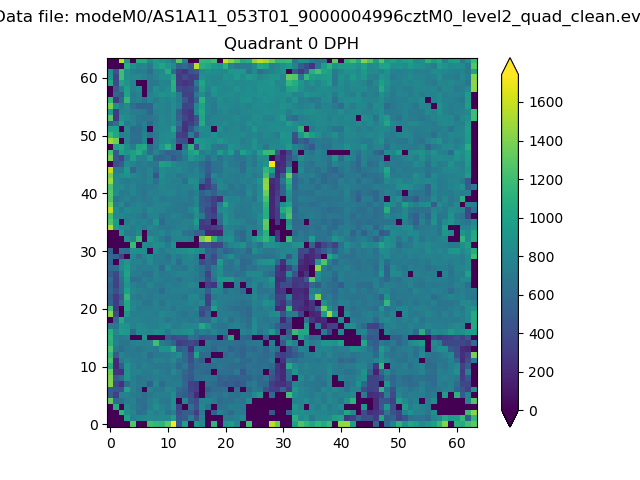 |
 |
Quadrant B |
|---|---|---|---|
| Quadrant D | 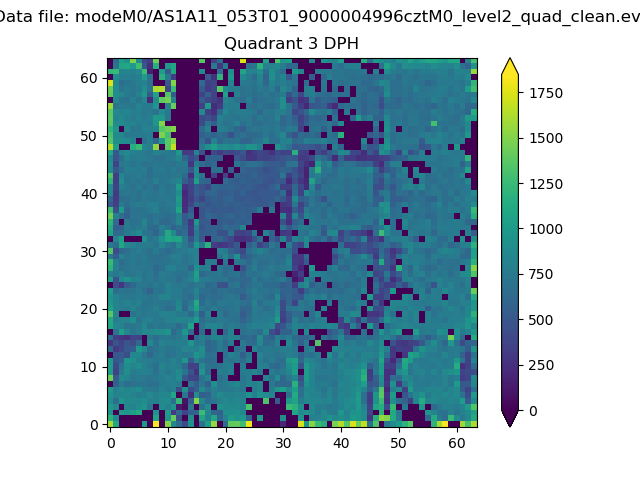 |
 |
Quadrant C |
| Plot type | Count rate plots | Images |
|---|---|---|
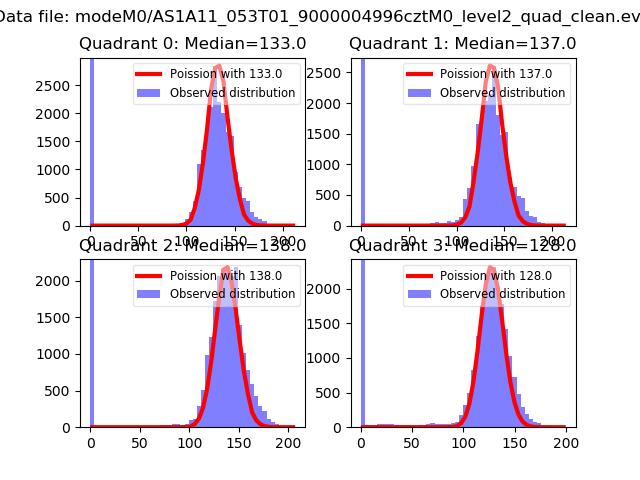
| Comparison with Poisson distribution Blue bars denote a histogram of data divided into 1 sec bins. Red curve is a Poisson curve with rate = median count rate of data. |
 |
 |
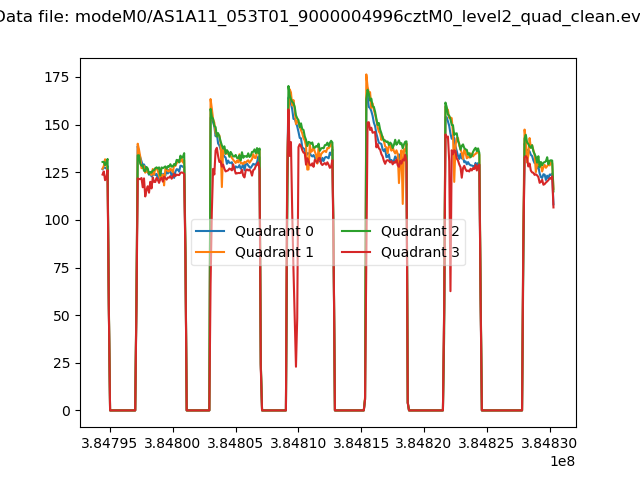
| Quadrant-wise count rates Data is divided into 100 sec bins |
 |
|
| Module-wise count rates for Quadrant A Data is divided into 100 sec bins |
 |
 |
| Module-wise count rates for Quadrant B Data is divided into 100 sec bins |
 |
 |
| Module-wise count rates for Quadrant C Data is divided into 100 sec bins |
 |
 |
| Module-wise count rates for Quadrant D Data is divided into 100 sec bins |
 |
 |
| Parameter | Plot |
|---|---|
| CZT HV Monitor |  |
| D_VDD | 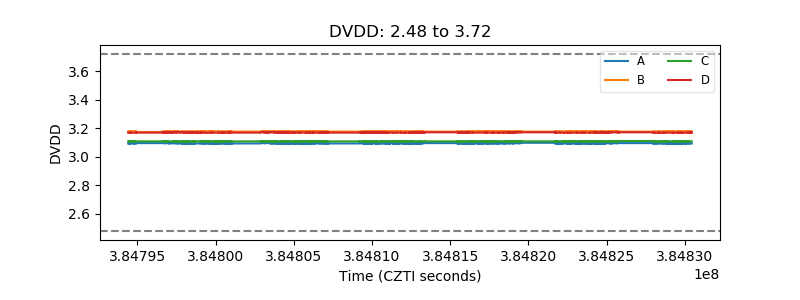 |
| Temperature 1 | 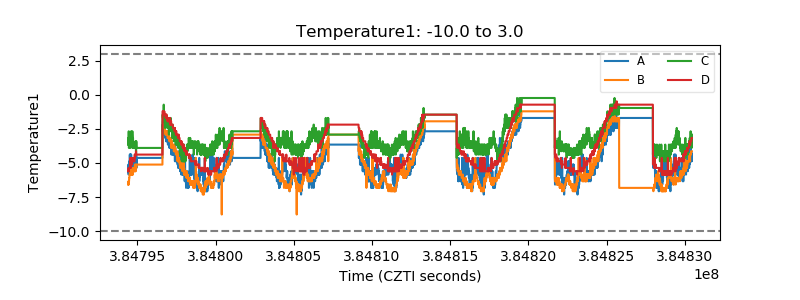 |
| Veto HV Monitor | 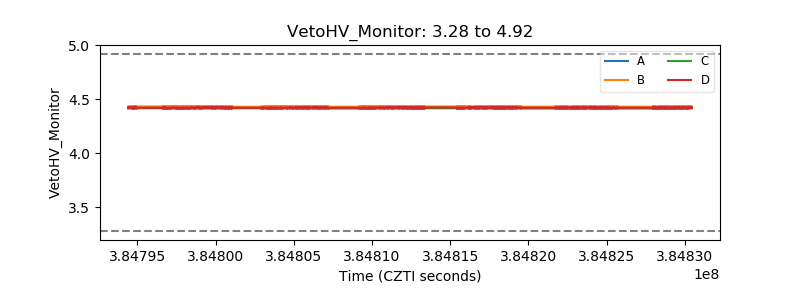 |
| Veto LLD | 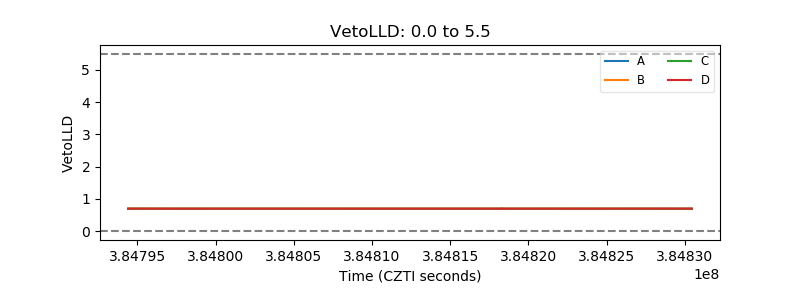 |
| Alpha Counter | 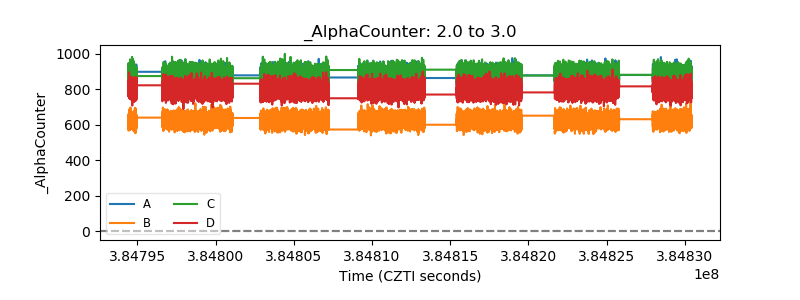 |
| _CPM_Rate |  |
| CZT Counter |  |
| +2.5 Volts monitor |  |
| +5 Volts monitor |  |
| _ROLL_ROT | 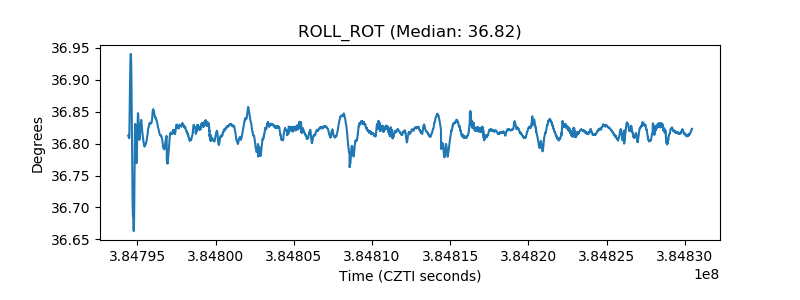 |
| _Roll_DEC | 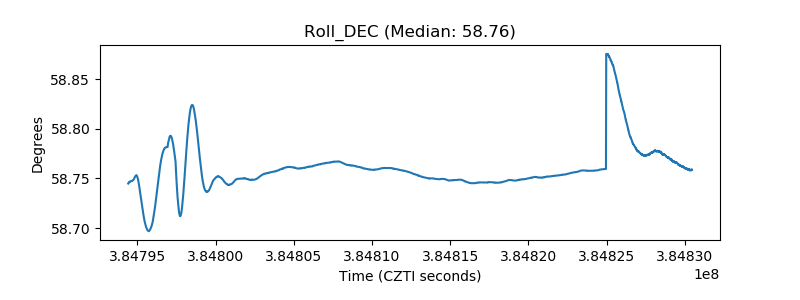 |
| _Roll_RA | 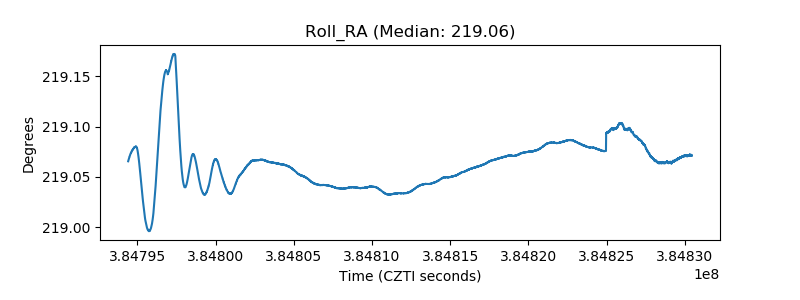 |
| Veto Counter | 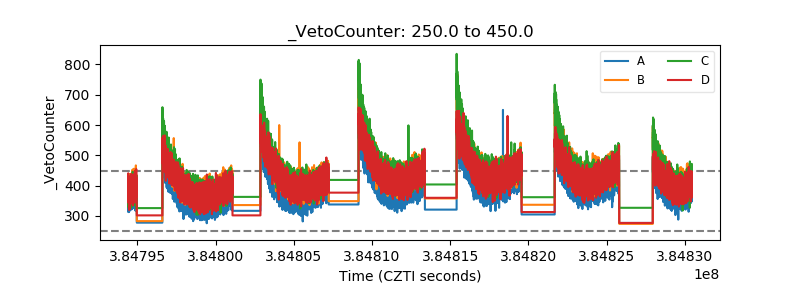 |