| Param | Original file | Final file |
|---|---|---|
| Filename | modeM0/AS1A11_053T01_9000004996_34901cztM0_level2.evt | modeM0/AS1A11_053T01_9000004996_34901cztM0_level2_quad_clean.evt |
| Size (bytes) | 378,627,840 | 77,627,520 |
| Size | 361.1 MB | 74.0 MB |
| Events in quadrant A | 2,300,450 | 499,688 |
| Events in quadrant B | 2,769,093 | 515,047 |
| Events in quadrant C | 2,637,079 | 518,308 |
| Events in quadrant D | 3,426,253 | 473,438 |
| Mode M9 | |||
|---|---|---|---|
| Quadrant | BADHDUFLAG | Total packets | Discarded packets |
| A | 0 | 34 | 0 |
| B | 0 | 34 | 0 |
| C | 0 | 34 | 0 |
| D | 0 | 35 | 0 |
| Mode SS | |||
|---|---|---|---|
| Quadrant | BADHDUFLAG | Total packets | Discarded packets |
| A | 0 | 100 | 0 |
| B | 0 | 100 | 0 |
| C | 0 | 100 | 0 |
| D | 0 | 100 | 0 |
| Mode M0 | |||
|---|---|---|---|
| Quadrant | BADHDUFLAG | Total packets | Discarded packets |
| A | 0 | 10043 | 3 |
| B | 0 | 11413 | 2 |
| C | 0 | 10650 | 2 |
| D | 0 | 13521 | 2 |
| Quadrant | Total seconds | Saturated seconds | Saturation percentage |
|---|---|---|---|
| A | 4909 | 5 | 0.101854% |
| B | 4909 | 113 | 2.301894% |
| C | 4909 | 54 | 1.100020% |
| D | 4909 | 111 | 2.261153% |
Noise dominated data is calculated using 1-second bins in cleaned event files. If a bin has >2000 counts, and if more than 50% of those come from <1% of pixels, then it is considered to be noise-dominated and hence unusable.
| Quadrant | # 1 sec bins | Bins with >0 counts | Bins with >2000 counts | High rate bins dominated by noise | Noise dominated (total time) | Noise dominated (detector-on time) | Marked lightcurve |
|---|---|---|---|---|---|---|---|
| A | 7062 | 4910 | 0 | 0 | 0.00% | 0.00% | 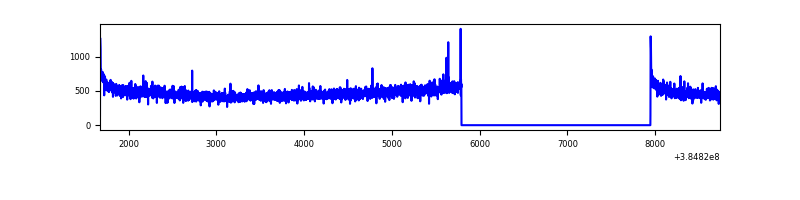 |
| B | 7062 | 4910 | 72 | 72 | 1.02% | 1.47% | 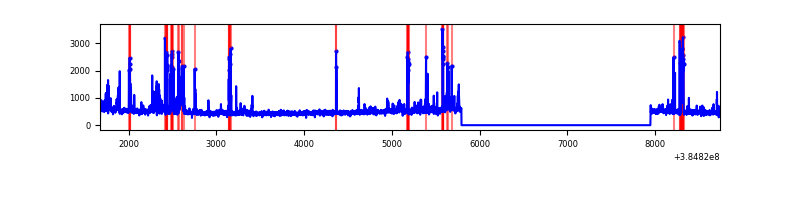 |
| C | 7062 | 4910 | 39 | 39 | 0.55% | 0.79% |  |
| D | 7062 | 4910 | 92 | 92 | 1.30% | 1.87% | 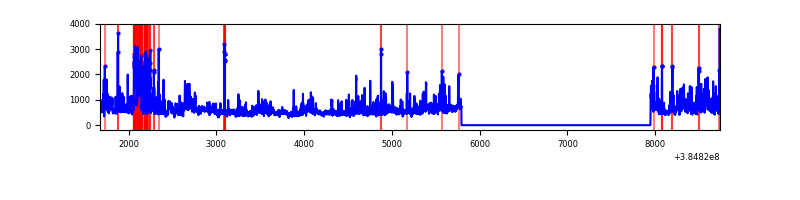 |
Top three noisy pixels from each quadrant. If the there are fewer than three noisy pixels in the level2.evt file, extra rows are filled as -1
| Pixel properties | Quadrant properties | ||||||
|---|---|---|---|---|---|---|---|
| Quadrant | DetID | PixID | Counts | Sigma | Mean | Median | Sigma |
| A | 10 | 83 | 57924 | 501.26 | 573 | 562 | 114.4 |
| A | 13 | 6 | 13165 | 110.13 | 573 | 562 | 114.4 |
| A | 13 | 254 | 8531 | 69.64 | 573 | 562 | 114.4 |
| B | 5 | 172 | 279451 | 2554.08 | 577 | 563 | 109.2 |
| B | 0 | 190 | 119389 | 1088.22 | 577 | 563 | 109.2 |
| B | 4 | 171 | 40853 | 368.98 | 577 | 563 | 109.2 |
| C | 15 | 214 | 222190 | 1704.46 | 567 | 573 | 130.0 |
| C | 0 | 10 | 148341 | 1136.49 | 567 | 573 | 130.0 |
| C | 14 | 67 | 28831 | 217.33 | 567 | 573 | 130.0 |
| D | 8 | 195 | 721251 | 5350.22 | 553 | 538 | 134.7 |
| D | 12 | 217 | 183361 | 1357.19 | 553 | 538 | 134.7 |
| D | 13 | 249 | 179738 | 1330.29 | 553 | 538 | 134.7 |
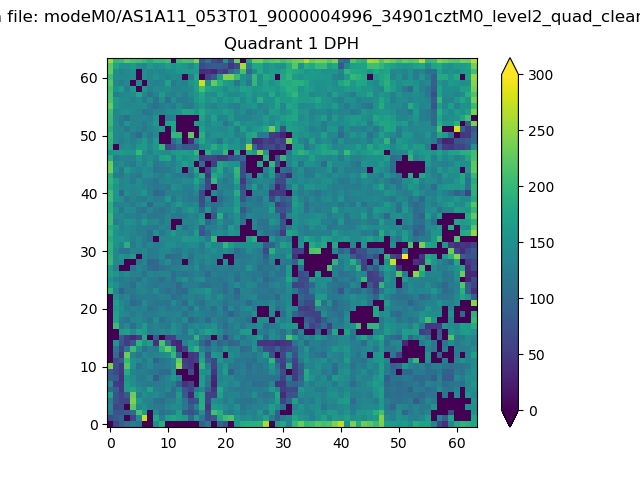
Histogram calculated using DETX and DETY for each event in the final _common_clean file
| Quadrant A | 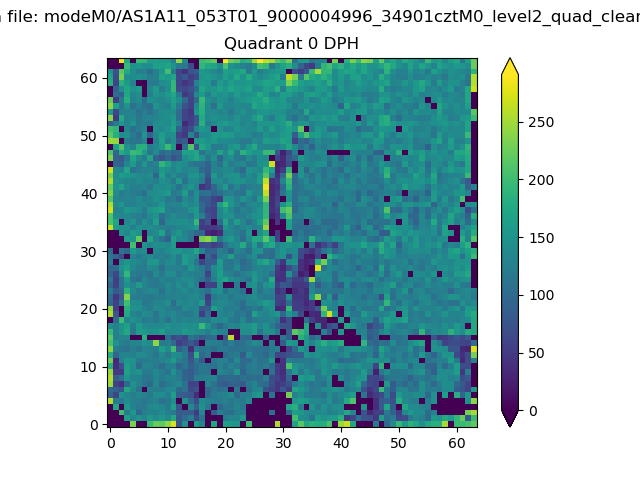 |
 |
Quadrant B |
|---|---|---|---|
| Quadrant D | 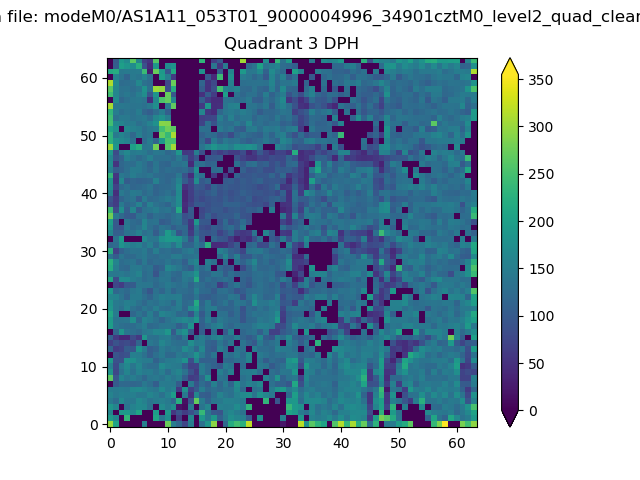 |
 |
Quadrant C |
| Plot type | Count rate plots | Images |
|---|---|---|
| Comparison with Poisson distribution Blue bars denote a histogram of data divided into 1 sec bins. Red curve is a Poisson curve with rate = median count rate of data. |
 |
 |
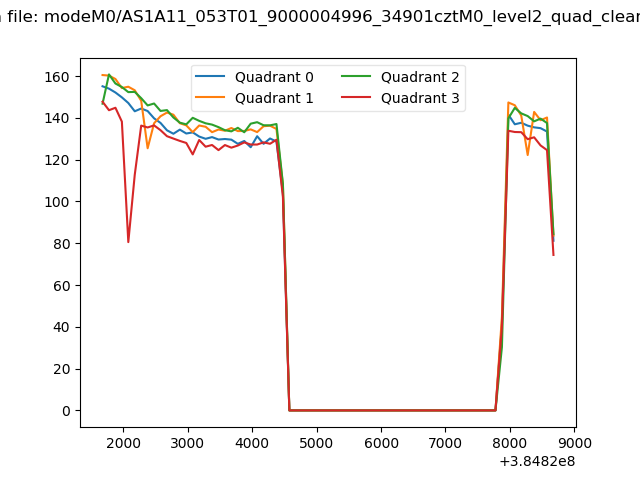
| Quadrant-wise count rates Data is divided into 100 sec bins |
 |
|
| Module-wise count rates for Quadrant A Data is divided into 100 sec bins |
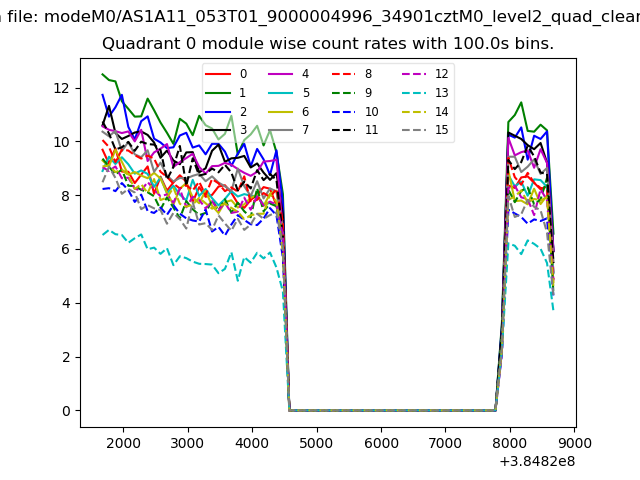 |
 |
| Module-wise count rates for Quadrant B Data is divided into 100 sec bins |
 |
 |
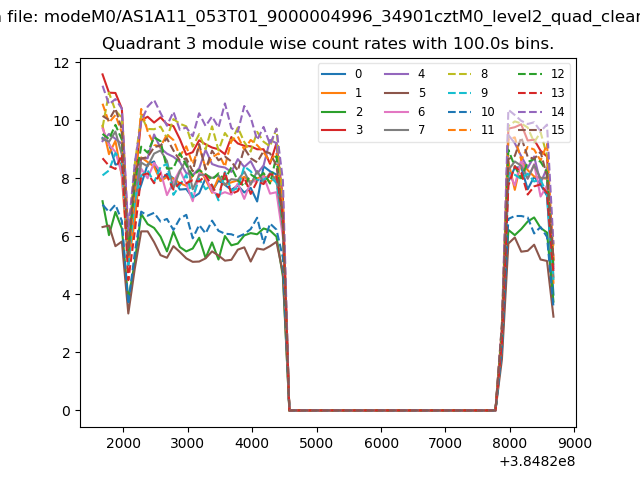
| Module-wise count rates for Quadrant C Data is divided into 100 sec bins |
 |
 |
| Module-wise count rates for Quadrant D Data is divided into 100 sec bins |
 |
 |
| Parameter | Plot |
|---|---|
| CZT HV Monitor |  |
| D_VDD | 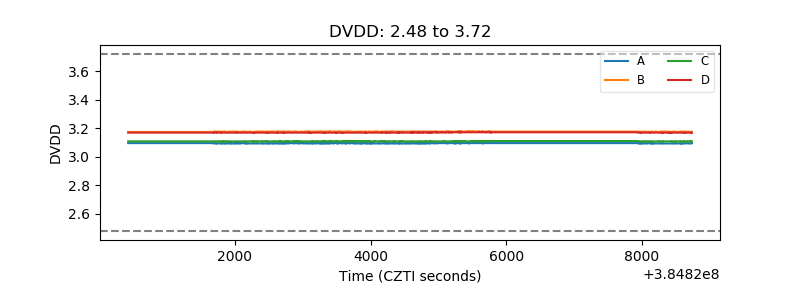 |
| Temperature 1 | 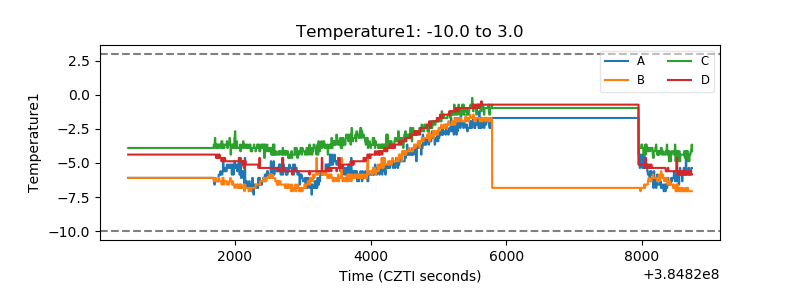 |
| Veto HV Monitor | 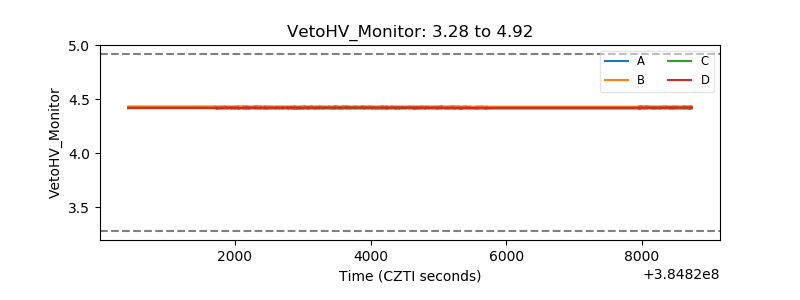 |
| Veto LLD | 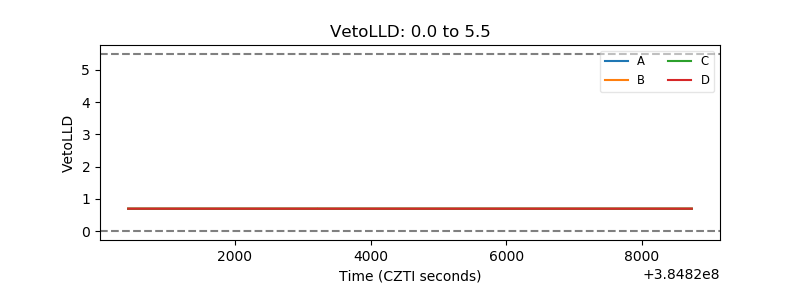 |
| Alpha Counter | 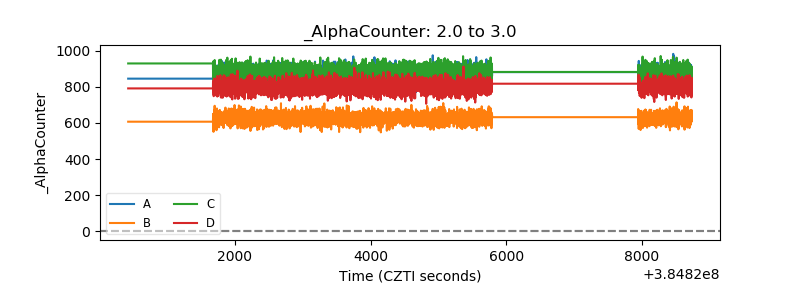 |
| _CPM_Rate | 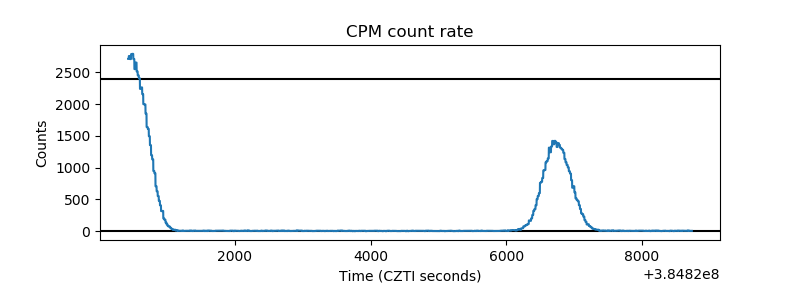 |
| CZT Counter |  |
| +2.5 Volts monitor | 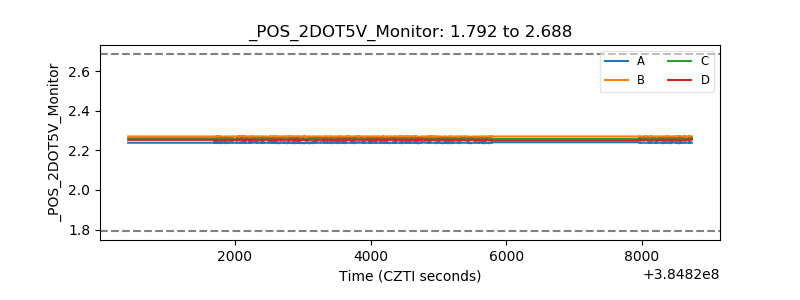 |
| +5 Volts monitor |  |
| _ROLL_ROT | 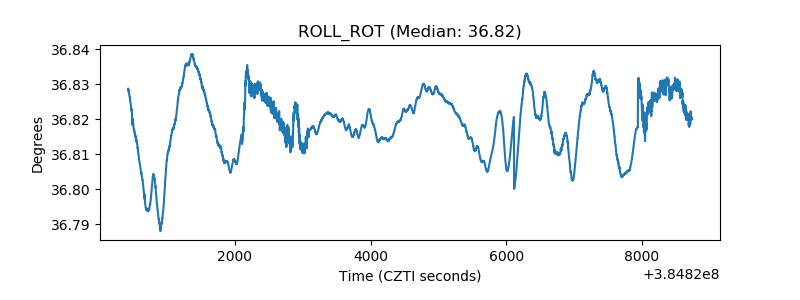 |
| _Roll_DEC | 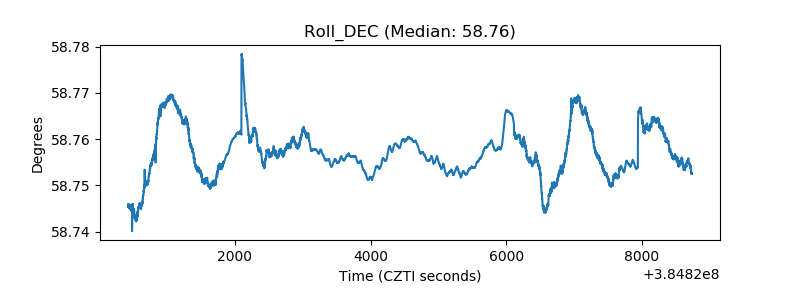 |
| _Roll_RA | 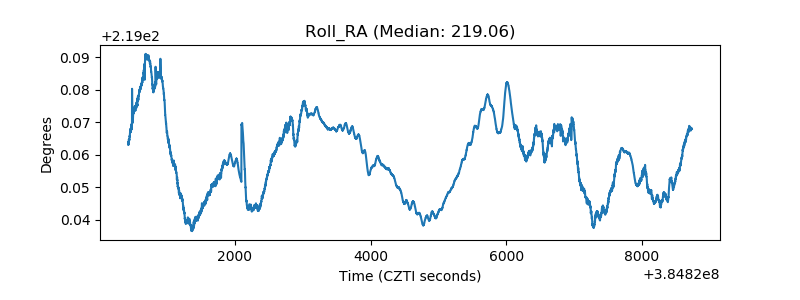 |
| Veto Counter | 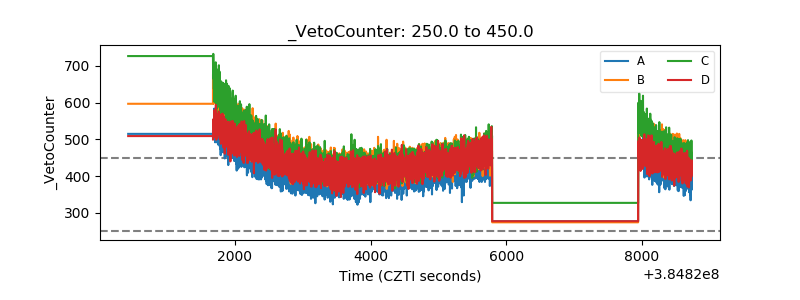 |