| Param | Original file | Final file |
|---|---|---|
| Filename | modeM0/AS1T04_077T01_9000004994cztM0_level2.fits | modeM0/AS1T04_077T01_9000004994cztM0_level2_quad_clean.evt |
| Size (bytes) | 363,939,840 | 336,453,120 |
| Size | 347.1 MB | 320.9 MB |
| Events in quadrant A | 2,240,434 | 2,021,556 |
| Events in quadrant B | 2,100,876 | 1,929,038 |
| Events in quadrant C | 2,176,410 | 1,903,145 |
| Events in quadrant D | 1,833,326 | 1,664,674 |
| Mode M9 | |||
|---|---|---|---|
| Quadrant | BADHDUFLAG | Total packets | Discarded packets |
| A | 0 | 126 | 0 |
| B | 0 | 126 | 0 |
| C | 0 | 126 | 0 |
| D | 0 | 126 | 0 |
| Mode M0 | |||
|---|---|---|---|
| Quadrant | BADHDUFLAG | Total packets | Discarded packets |
| A | 0 | 78690 | 0 |
| B | 0 | 97638 | 0 |
| C | 0 | 82525 | 0 |
| D | 0 | 123912 | 0 |
| Mode SS | |||
|---|---|---|---|
| Quadrant | BADHDUFLAG | Total packets | Discarded packets |
| A | 0 | 794 | 0 |
| B | 0 | 794 | 0 |
| C | 0 | 794 | 0 |
| D | 0 | 794 | 0 |
| Quadrant | Total seconds | Saturated seconds | Saturation percentage |
|---|---|---|---|
| A | 38886 | 39 | 0.100293% |
| B | 38886 | 1378 | 3.543692% |
| C | 38886 | 223 | 0.573471% |
| D | 38886 | 1532 | 3.939721% |
Noise dominated data is calculated using 1-second bins in cleaned event files. If a bin has >2000 counts, and if more than 50% of those come from <1% of pixels, then it is considered to be noise-dominated and hence unusable.
| Quadrant | # 1 sec bins | Bins with >0 counts | Bins with >2000 counts | High rate bins dominated by noise | Noise dominated (total time) | Noise dominated (detector-on time) | Marked lightcurve |
|---|---|---|---|---|---|---|---|
| A | 51522 | 38885 | 0 | 0 | 0.00% | 0.00% | 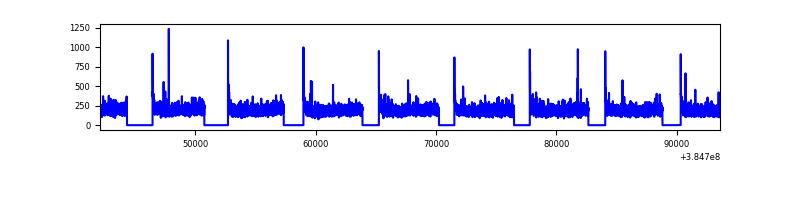 |
| B | 51522 | 38881 | 0 | 0 | 0.00% | 0.00% | 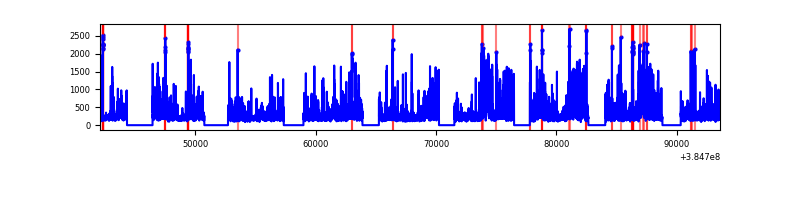 |
| C | 51522 | 38883 | 0 | 0 | 0.00% | 0.00% |  |
| D | 51522 | 38877 | 0 | 0 | 0.00% | 0.00% |  |
Top three noisy pixels from each quadrant. If the there are fewer than three noisy pixels in the level2.evt file, extra rows are filled as -1
| Pixel properties | Quadrant properties | ||||||
|---|---|---|---|---|---|---|---|
| Quadrant | DetID | PixID | Counts | Sigma | Mean | Median | Sigma |
| A | 7 | 110 | 1821 | 8.73 | 582 | 545 | 146.2 |
| A | 9 | 19 | 1780 | 8.45 | 582 | 545 | 146.2 |
| A | 0 | 29 | 1759 | 8.3 | 582 | 545 | 146.2 |
| B | 2 | 9 | 1782 | 11.37 | 555 | 529 | 110.2 |
| B | 3 | 80 | 1652 | 10.19 | 555 | 529 | 110.2 |
| B | 5 | 128 | 1500 | 8.81 | 555 | 529 | 110.2 |
| C | 1 | 81 | 1817 | 8.67 | 575 | 539 | 147.4 |
| C | 3 | 203 | 1718 | 8.0 | 575 | 539 | 147.4 |
| C | 3 | 202 | 1715 | 7.98 | 575 | 539 | 147.4 |
| D | 7 | 3 | 1388 | 6.52 | 525 | 479 | 139.4 |
| D | 6 | 38 | 1344 | 6.2 | 525 | 479 | 139.4 |
| D | 10 | 113 | 1331 | 6.11 | 525 | 479 | 139.4 |
Histogram calculated using DETX and DETY for each event in the final _common_clean file
| Quadrant A |  |
 |
Quadrant B |
|---|---|---|---|
| Quadrant D |  |
 |
Quadrant C |
| Plot type | Count rate plots | Images |
|---|---|---|
| Comparison with Poisson distribution Blue bars denote a histogram of data divided into 1 sec bins. Red curve is a Poisson curve with rate = median count rate of data. |
 |
 |
| Quadrant-wise count rates Data is divided into 100 sec bins |
 |
|
| Module-wise count rates for Quadrant A Data is divided into 100 sec bins |
 |
 |
| Module-wise count rates for Quadrant B Data is divided into 100 sec bins |
 |
 |
| Module-wise count rates for Quadrant C Data is divided into 100 sec bins |
 |
 |
| Module-wise count rates for Quadrant D Data is divided into 100 sec bins |
 |
 |
| Parameter | Plot |
|---|---|
| CZT HV Monitor |  |
| D_VDD |  |
| Temperature 1 |  |
| Veto HV Monitor |  |
| Veto LLD |  |
| Alpha Counter |  |
| _CPM_Rate |  |
| CZT Counter |  |
| +2.5 Volts monitor |  |
| +5 Volts monitor |  |
| _ROLL_ROT |  |
| _Roll_DEC |  |
| _Roll_RA |  |
| Veto Counter | 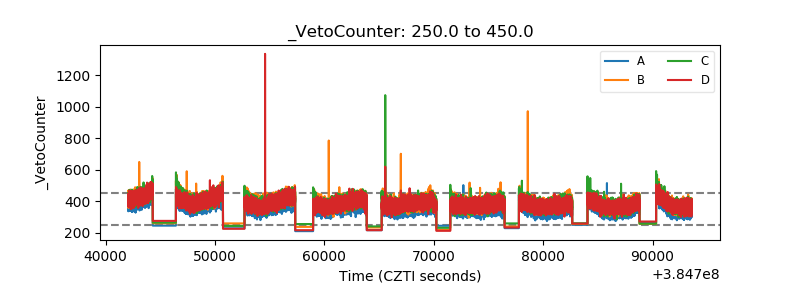 |