| Param | Original file | Final file |
|---|---|---|
| Filename | modeM0/AS1A11_065T05_9000004998cztM0_level2.fits | modeM0/AS1A11_065T05_9000004998cztM0_level2_quad_clean.evt |
| Size (bytes) | 221,702,400 | 240,249,600 |
| Size | 211.4 MB | 229.1 MB |
| Events in quadrant A | 1,353,388 | 1,504,576 |
| Events in quadrant B | 1,287,102 | 1,507,419 |
| Events in quadrant C | 1,327,522 | 1,419,904 |
| Events in quadrant D | 1,108,496 | 1,206,420 |
| Mode M9 | |||
|---|---|---|---|
| Quadrant | BADHDUFLAG | Total packets | Discarded packets |
| A | 0 | 80 | 0 |
| B | 0 | 80 | 0 |
| C | 0 | 80 | 0 |
| D | 0 | 80 | 0 |
| Mode SS | |||
|---|---|---|---|
| Quadrant | BADHDUFLAG | Total packets | Discarded packets |
| A | 0 | 486 | 0 |
| B | 0 | 486 | 0 |
| C | 0 | 486 | 0 |
| D | 0 | 486 | 0 |
| Mode M0 | |||
|---|---|---|---|
| Quadrant | BADHDUFLAG | Total packets | Discarded packets |
| A | 0 | 48310 | 0 |
| B | 0 | 56249 | 0 |
| C | 0 | 50020 | 0 |
| D | 0 | 76362 | 0 |
| Quadrant | Total seconds | Saturated seconds | Saturation percentage |
|---|---|---|---|
| A | 23796 | 29 | 0.121869% |
| B | 23796 | 543 | 2.281896% |
| C | 23796 | 150 | 0.630358% |
| D | 23796 | 1228 | 5.160531% |
Noise dominated data is calculated using 1-second bins in cleaned event files. If a bin has >2000 counts, and if more than 50% of those come from <1% of pixels, then it is considered to be noise-dominated and hence unusable.
| Quadrant | # 1 sec bins | Bins with >0 counts | Bins with >2000 counts | High rate bins dominated by noise | Noise dominated (total time) | Noise dominated (detector-on time) | Marked lightcurve |
|---|---|---|---|---|---|---|---|
| A | 31834 | 23795 | 0 | 0 | 0.00% | 0.00% |  |
| B | 31834 | 23775 | 0 | 0 | 0.00% | 0.00% |  |
| C | 31834 | 23794 | 0 | 0 | 0.00% | 0.00% |  |
| D | 31834 | 23789 | 0 | 0 | 0.00% | 0.00% |  |
Top three noisy pixels from each quadrant. If the there are fewer than three noisy pixels in the level2.evt file, extra rows are filled as -1
| Pixel properties | Quadrant properties | ||||||
|---|---|---|---|---|---|---|---|
| Quadrant | DetID | PixID | Counts | Sigma | Mean | Median | Sigma |
| A | 9 | 19 | 1134 | 9.04 | 353 | 330 | 88.9 |
| A | 7 | 110 | 1102 | 8.68 | 353 | 330 | 88.9 |
| A | 0 | 29 | 1075 | 8.38 | 353 | 330 | 88.9 |
| B | 2 | 9 | 1136 | 11.74 | 340 | 324 | 69.1 |
| B | 3 | 80 | 979 | 9.47 | 340 | 324 | 69.1 |
| B | 2 | 8 | 971 | 9.36 | 340 | 324 | 69.1 |
| C | 1 | 80 | 1073 | 8.1 | 350 | 328 | 92.0 |
| C | 1 | 81 | 1056 | 7.91 | 350 | 328 | 92.0 |
| C | 3 | 202 | 1027 | 7.6 | 350 | 328 | 92.0 |
| D | 10 | 113 | 856 | 6.55 | 317 | 288 | 86.7 |
| D | 4 | 160 | 827 | 6.22 | 317 | 288 | 86.7 |
| D | 10 | 189 | 817 | 6.1 | 317 | 288 | 86.7 |
Histogram calculated using DETX and DETY for each event in the final _common_clean file
| Quadrant A | 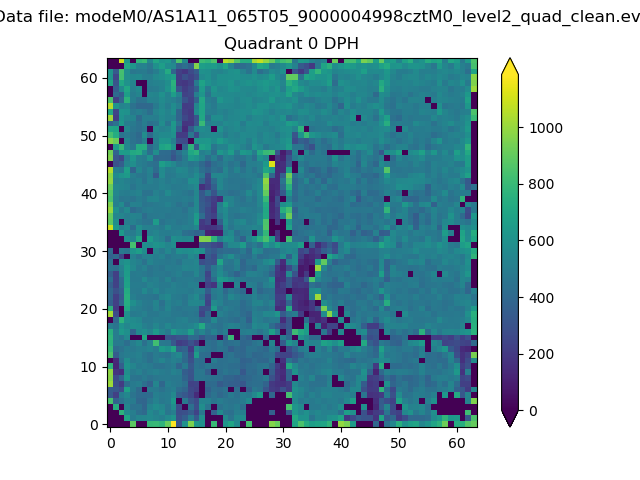 |
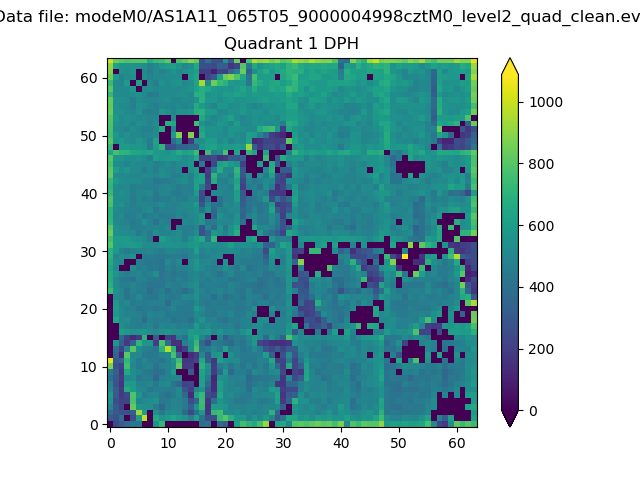 |
Quadrant B |
|---|---|---|---|
| Quadrant D |  |
 |
Quadrant C |
| Plot type | Count rate plots | Images |
|---|---|---|
| Comparison with Poisson distribution Blue bars denote a histogram of data divided into 1 sec bins. Red curve is a Poisson curve with rate = median count rate of data. |
 |
 |
| Quadrant-wise count rates Data is divided into 100 sec bins |
 |
|
| Module-wise count rates for Quadrant A Data is divided into 100 sec bins |
 |
 |
| Module-wise count rates for Quadrant B Data is divided into 100 sec bins |
 |
 |
| Module-wise count rates for Quadrant C Data is divided into 100 sec bins |
 |
 |
| Module-wise count rates for Quadrant D Data is divided into 100 sec bins |
 |
 |
| Parameter | Plot |
|---|---|
| CZT HV Monitor |  |
| D_VDD |  |
| Temperature 1 |  |
| Veto HV Monitor |  |
| Veto LLD |  |
| Alpha Counter |  |
| _CPM_Rate | 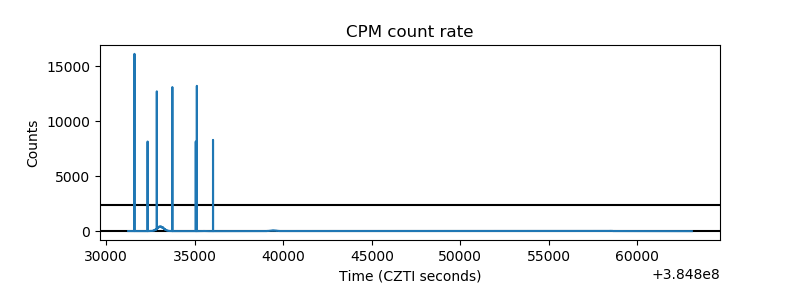 |
| CZT Counter |  |
| +2.5 Volts monitor |  |
| +5 Volts monitor |  |
| _ROLL_ROT |  |
| _Roll_DEC |  |
| _Roll_RA | 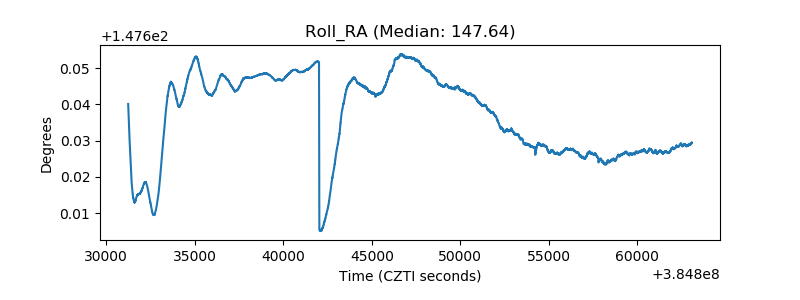 |
| Veto Counter |  |