| Param | Original file | Final file |
|---|---|---|
| Filename | modeM0/AS1A11_065T21_9000005000cztM0_level2.fits | modeM0/AS1A11_065T21_9000005000cztM0_level2_quad_clean.evt |
| Size (bytes) | 149,520,960 | 157,959,360 |
| Size | 142.6 MB | 150.6 MB |
| Events in quadrant A | 910,850 | 971,429 |
| Events in quadrant B | 860,228 | 941,630 |
| Events in quadrant C | 892,804 | 930,801 |
| Events in quadrant D | 755,036 | 830,197 |
| Mode M0 | |||
|---|---|---|---|
| Quadrant | BADHDUFLAG | Total packets | Discarded packets |
| A | 0 | 33226 | 0 |
| B | 0 | 37639 | 0 |
| C | 0 | 34049 | 0 |
| D | 0 | 47966 | 0 |
| Mode SS | |||
|---|---|---|---|
| Quadrant | BADHDUFLAG | Total packets | Discarded packets |
| A | 0 | 328 | 0 |
| B | 0 | 328 | 0 |
| C | 0 | 328 | 0 |
| D | 0 | 328 | 0 |
| Mode M9 | |||
|---|---|---|---|
| Quadrant | BADHDUFLAG | Total packets | Discarded packets |
| A | 0 | 62 | 0 |
| B | 0 | 62 | 0 |
| C | 0 | 62 | 0 |
| D | 0 | 62 | 0 |
| Quadrant | Total seconds | Saturated seconds | Saturation percentage |
|---|---|---|---|
| A | 16088 | 23 | 0.142964% |
| B | 16088 | 500 | 3.107907% |
| C | 16088 | 162 | 1.006962% |
| D | 16088 | 397 | 2.467678% |
Noise dominated data is calculated using 1-second bins in cleaned event files. If a bin has >2000 counts, and if more than 50% of those come from <1% of pixels, then it is considered to be noise-dominated and hence unusable.
| Quadrant | # 1 sec bins | Bins with >0 counts | Bins with >2000 counts | High rate bins dominated by noise | Noise dominated (total time) | Noise dominated (detector-on time) | Marked lightcurve |
|---|---|---|---|---|---|---|---|
| A | 22270 | 16088 | 0 | 0 | 0.00% | 0.00% |  |
| B | 22270 | 16074 | 0 | 0 | 0.00% | 0.00% | 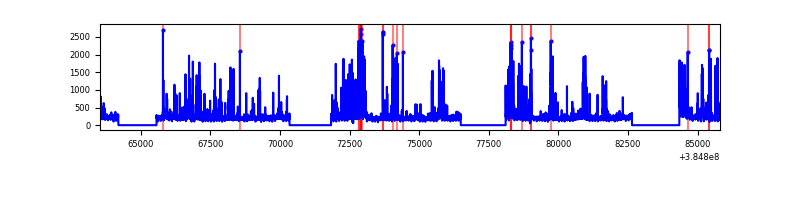 |
| C | 22270 | 16085 | 0 | 0 | 0.00% | 0.00% |  |
| D | 22270 | 16085 | 0 | 0 | 0.00% | 0.00% | 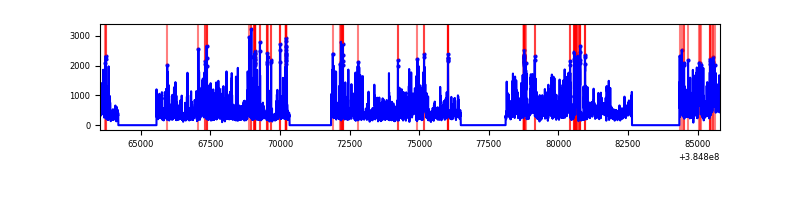 |
Top three noisy pixels from each quadrant. If the there are fewer than three noisy pixels in the level2.evt file, extra rows are filled as -1
| Pixel properties | Quadrant properties | ||||||
|---|---|---|---|---|---|---|---|
| Quadrant | DetID | PixID | Counts | Sigma | Mean | Median | Sigma |
| A | 9 | 19 | 765 | 8.99 | 237 | 223 | 60.3 |
| A | 0 | 29 | 757 | 8.86 | 237 | 223 | 60.3 |
| A | 7 | 110 | 747 | 8.69 | 237 | 223 | 60.3 |
| B | 2 | 9 | 715 | 10.6 | 227 | 216 | 47.1 |
| B | 3 | 80 | 672 | 9.68 | 227 | 216 | 47.1 |
| B | 5 | 128 | 618 | 8.54 | 227 | 216 | 47.1 |
| C | 3 | 202 | 755 | 8.66 | 235 | 221 | 61.6 |
| C | 1 | 81 | 748 | 8.55 | 235 | 221 | 61.6 |
| C | 1 | 80 | 734 | 8.32 | 235 | 221 | 61.6 |
| D | 10 | 189 | 579 | 6.59 | 215 | 197 | 57.9 |
| D | 6 | 38 | 561 | 6.28 | 215 | 197 | 57.9 |
| D | 6 | 62 | 556 | 6.2 | 215 | 197 | 57.9 |
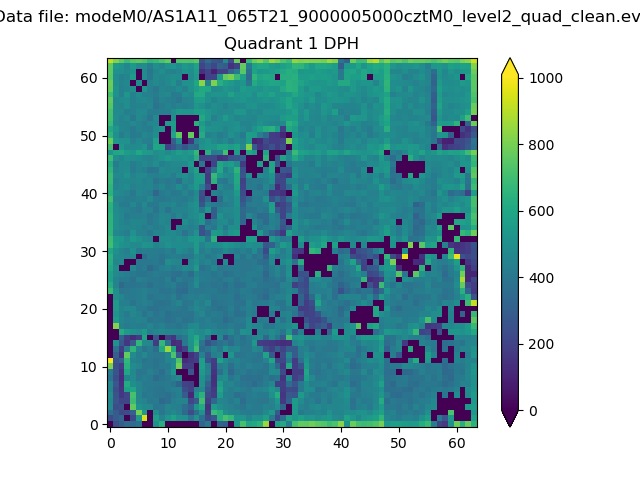
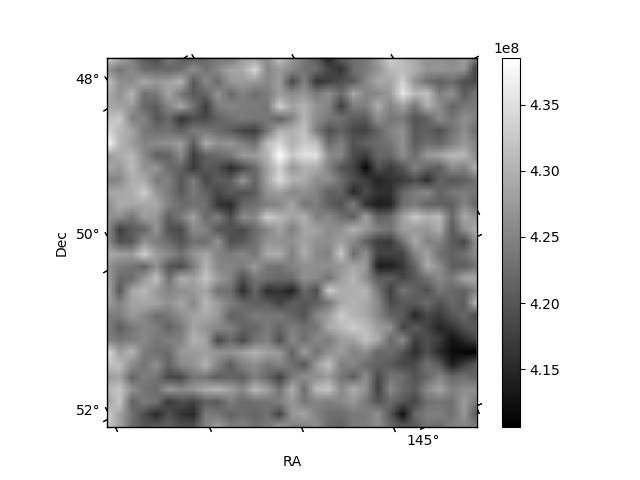
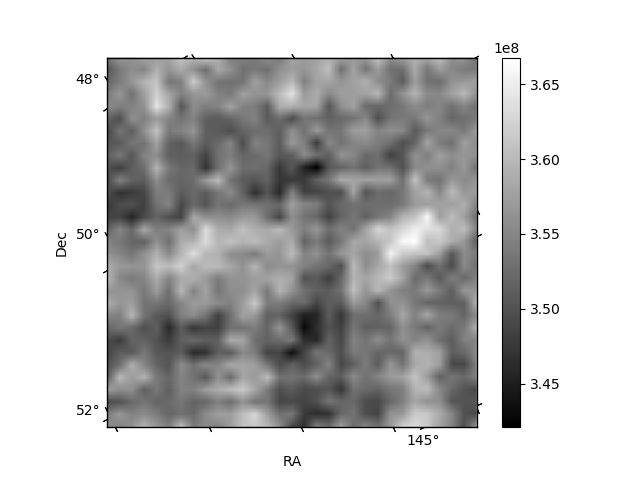
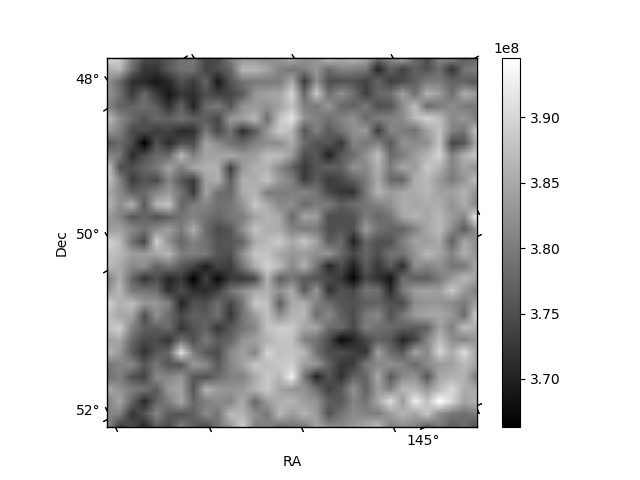
Histogram calculated using DETX and DETY for each event in the final _common_clean file
| Quadrant A |  |
 |
Quadrant B |
|---|---|---|---|
| Quadrant D | 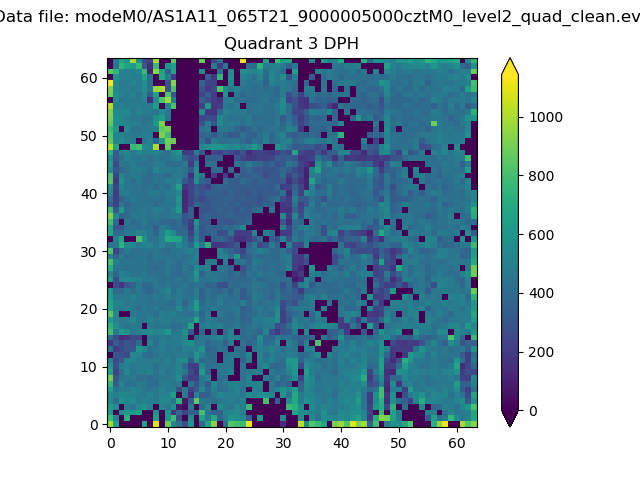 |
 |
Quadrant C |
| Plot type | Count rate plots | Images |
|---|---|---|
| Comparison with Poisson distribution Blue bars denote a histogram of data divided into 1 sec bins. Red curve is a Poisson curve with rate = median count rate of data. |
 |
 |
| Quadrant-wise count rates Data is divided into 100 sec bins |
 |
|
| Module-wise count rates for Quadrant A Data is divided into 100 sec bins |
 |
 |
| Module-wise count rates for Quadrant B Data is divided into 100 sec bins |
 |
 |
| Module-wise count rates for Quadrant C Data is divided into 100 sec bins |
 |
 |
| Module-wise count rates for Quadrant D Data is divided into 100 sec bins |
 |
 |
| Parameter | Plot |
|---|---|
| CZT HV Monitor |  |
| D_VDD |  |
| Temperature 1 |  |
| Veto HV Monitor |  |
| Veto LLD |  |
| Alpha Counter |  |
| _CPM_Rate |  |
| CZT Counter |  |
| +2.5 Volts monitor |  |
| +5 Volts monitor |  |
| _ROLL_ROT |  |
| _Roll_DEC |  |
| _Roll_RA |  |
| Veto Counter |  |