| Param | Original file | Final file |
|---|---|---|
| Filename | modeM0/AS1A11_065T21_9000005000_34908cztM0_level2.evt | modeM0/AS1A11_065T21_9000005000_34908cztM0_level2_quad_clean.evt |
| Size (bytes) | 508,757,760 | 99,184,320 |
| Size | 485.2 MB | 94.6 MB |
| Events in quadrant A | 3,067,693 | 652,007 |
| Events in quadrant B | 3,687,767 | 648,095 |
| Events in quadrant C | 3,437,715 | 646,654 |
| Events in quadrant D | 4,772,061 | 601,949 |
| Mode M0 | |||
|---|---|---|---|
| Quadrant | BADHDUFLAG | Total packets | Discarded packets |
| A | 0 | 13399 | 3 |
| B | 0 | 15136 | 2 |
| C | 0 | 13888 | 2 |
| D | 0 | 18595 | 2 |
| Mode SS | |||
|---|---|---|---|
| Quadrant | BADHDUFLAG | Total packets | Discarded packets |
| A | 0 | 134 | 0 |
| B | 0 | 134 | 0 |
| C | 0 | 134 | 0 |
| D | 0 | 134 | 0 |
| Mode M9 | |||
|---|---|---|---|
| Quadrant | BADHDUFLAG | Total packets | Discarded packets |
| A | 0 | 29 | 0 |
| B | 0 | 29 | 0 |
| C | 0 | 29 | 0 |
| D | 0 | 29 | 0 |
| Quadrant | Total seconds | Saturated seconds | Saturation percentage |
|---|---|---|---|
| A | 6525 | 9 | 0.137931% |
| B | 6525 | 169 | 2.590038% |
| C | 6525 | 84 | 1.287356% |
| D | 6525 | 168 | 2.574713% |
Noise dominated data is calculated using 1-second bins in cleaned event files. If a bin has >2000 counts, and if more than 50% of those come from <1% of pixels, then it is considered to be noise-dominated and hence unusable.
| Quadrant | # 1 sec bins | Bins with >0 counts | Bins with >2000 counts | High rate bins dominated by noise | Noise dominated (total time) | Noise dominated (detector-on time) | Marked lightcurve |
|---|---|---|---|---|---|---|---|
| A | 9391 | 6527 | 1 | 1 | 0.01% | 0.02% | 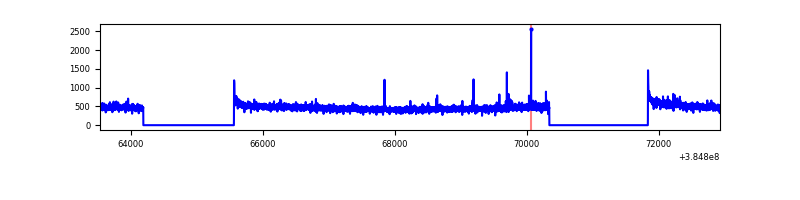 |
| B | 9391 | 6527 | 125 | 125 | 1.33% | 1.92% | 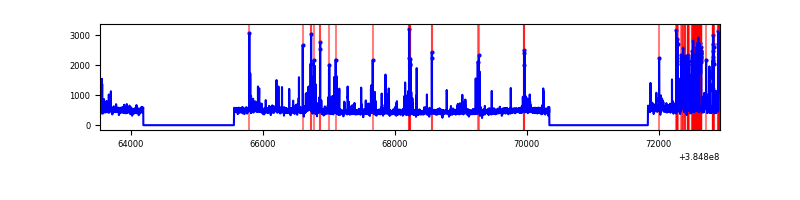 |
| C | 9391 | 6527 | 65 | 65 | 0.69% | 1.00% | 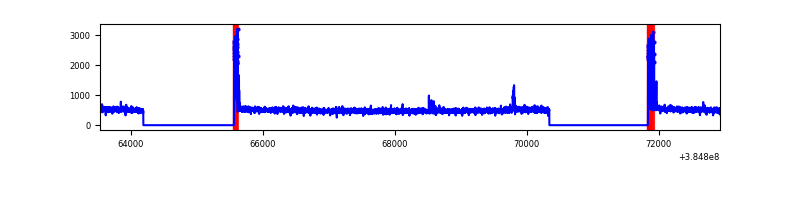 |
| D | 9391 | 6527 | 166 | 166 | 1.77% | 2.54% | 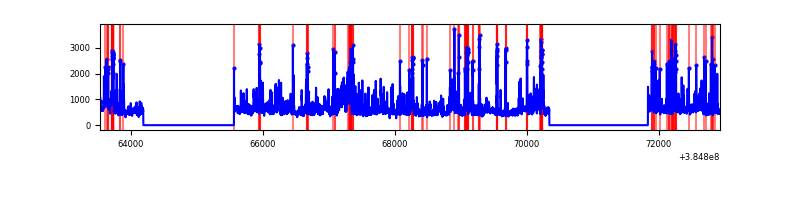 |
Top three noisy pixels from each quadrant. If the there are fewer than three noisy pixels in the level2.evt file, extra rows are filled as -1
| Pixel properties | Quadrant properties | ||||||
|---|---|---|---|---|---|---|---|
| Quadrant | DetID | PixID | Counts | Sigma | Mean | Median | Sigma |
| A | 10 | 83 | 62508 | 400.68 | 764 | 748 | 154.1 |
| A | 7 | 16 | 21445 | 134.27 | 764 | 748 | 154.1 |
| A | 15 | 169 | 19722 | 123.1 | 764 | 748 | 154.1 |
| B | 5 | 172 | 521591 | 3578.04 | 752 | 731 | 145.6 |
| B | 5 | 255 | 75785 | 515.58 | 752 | 731 | 145.6 |
| B | 0 | 190 | 39461 | 266.06 | 752 | 731 | 145.6 |
| C | 15 | 214 | 273787 | 1590.0 | 741 | 746 | 171.7 |
| C | 0 | 10 | 223606 | 1297.78 | 741 | 746 | 171.7 |
| C | 14 | 67 | 27082 | 153.36 | 741 | 746 | 171.7 |
| D | 8 | 195 | 936363 | 5224.0 | 732 | 712 | 179.1 |
| D | 13 | 249 | 282750 | 1574.7 | 732 | 712 | 179.1 |
| D | 1 | 52 | 239785 | 1334.81 | 732 | 712 | 179.1 |
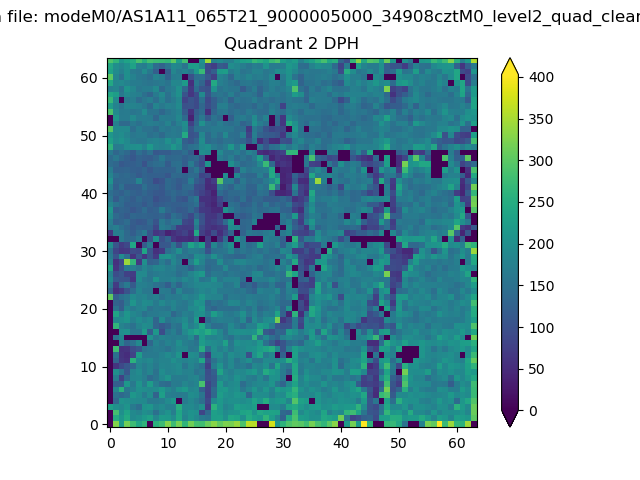
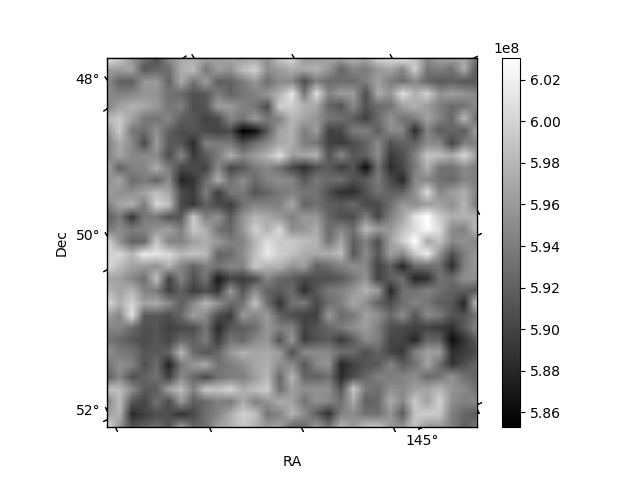
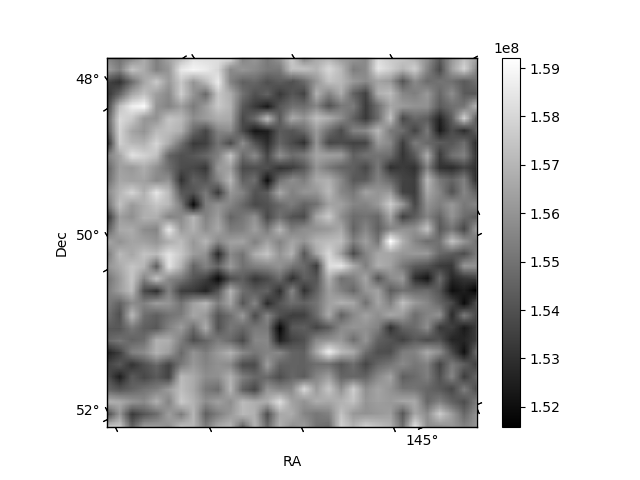
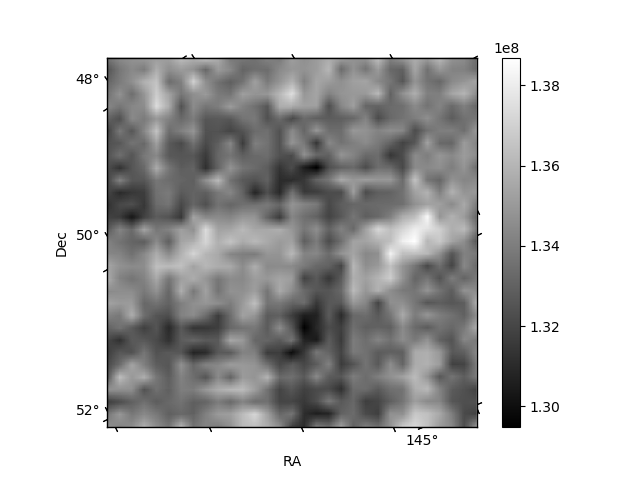
Histogram calculated using DETX and DETY for each event in the final _common_clean file
| Quadrant A | 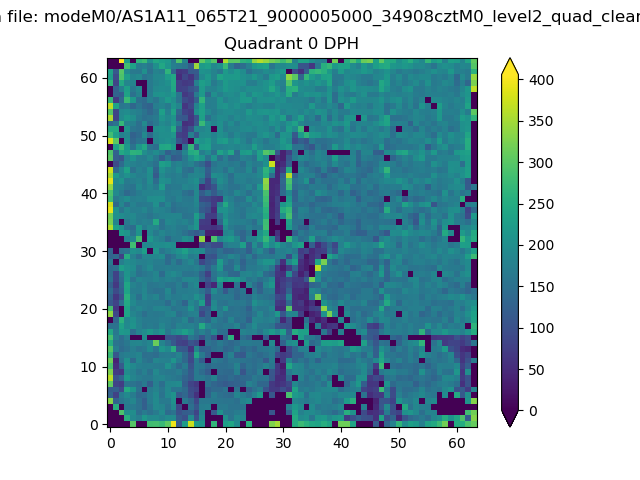 |
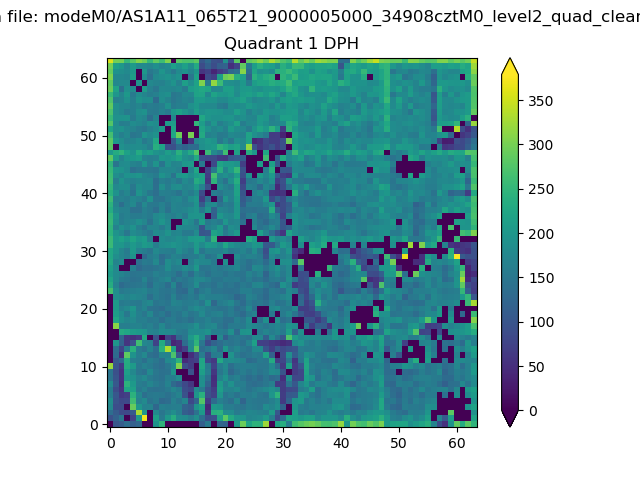 |
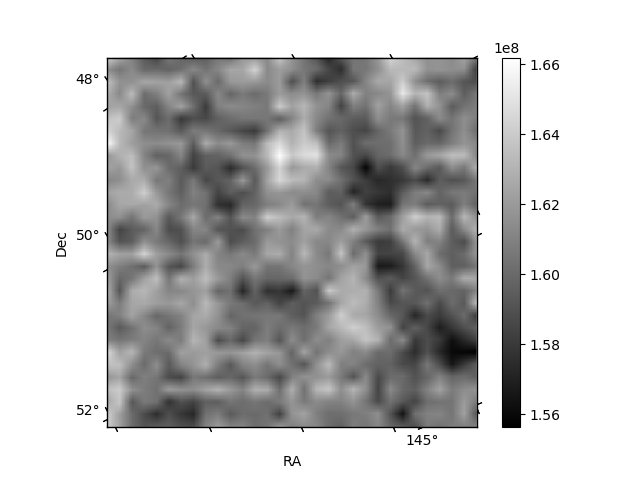
Quadrant B |
|---|---|---|---|
| Quadrant D | 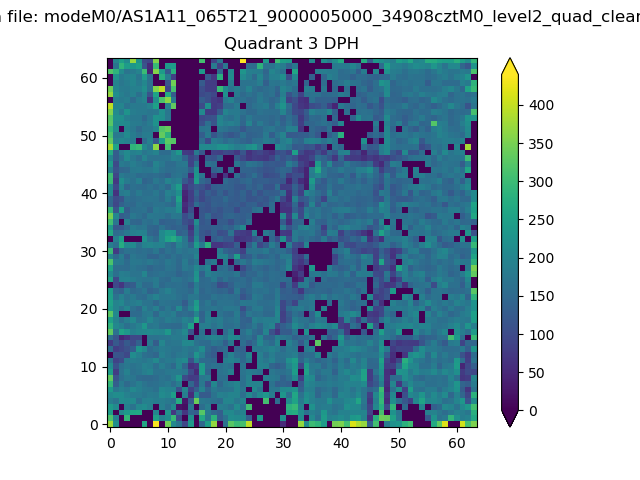 |
 |
Quadrant C |
| Plot type | Count rate plots | Images |
|---|---|---|
| Comparison with Poisson distribution Blue bars denote a histogram of data divided into 1 sec bins. Red curve is a Poisson curve with rate = median count rate of data. |
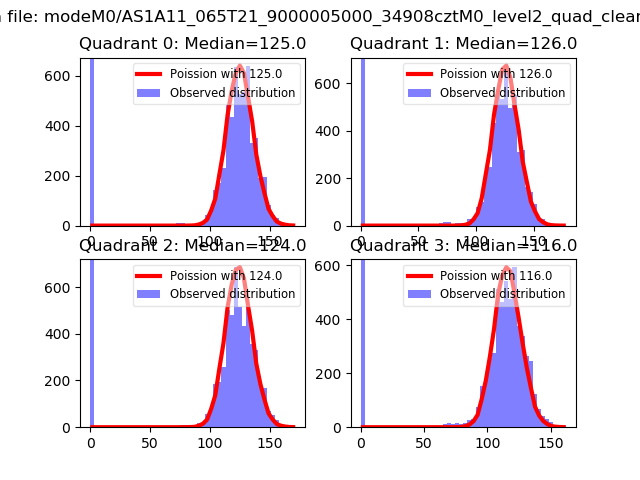 |
 |
| Quadrant-wise count rates Data is divided into 100 sec bins |
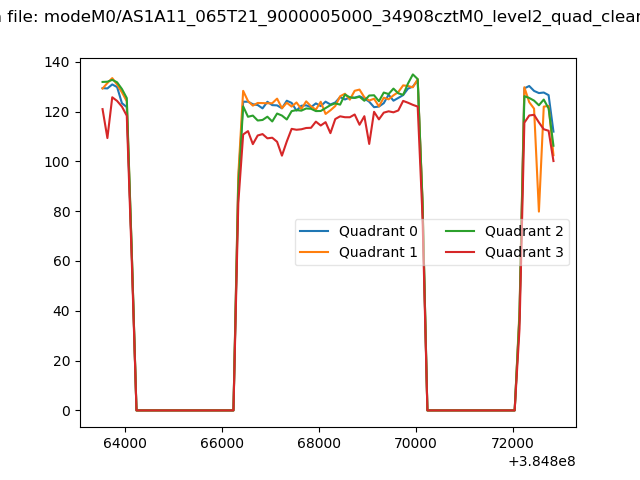 |
|
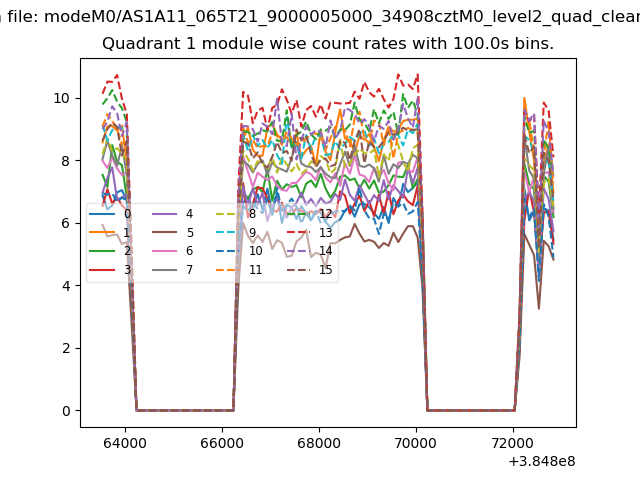
| Module-wise count rates for Quadrant A Data is divided into 100 sec bins |
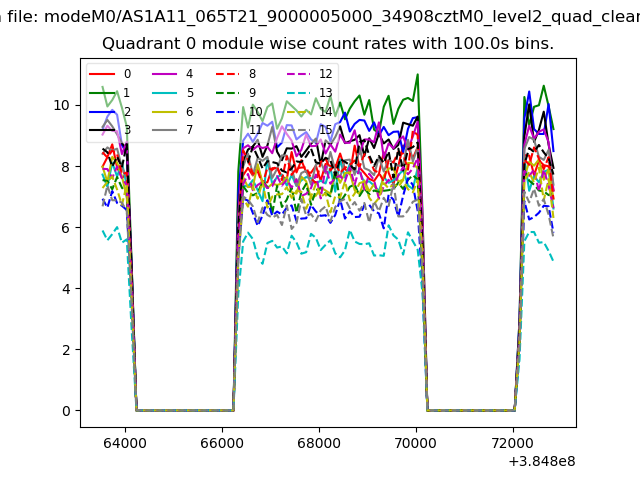 |
 |
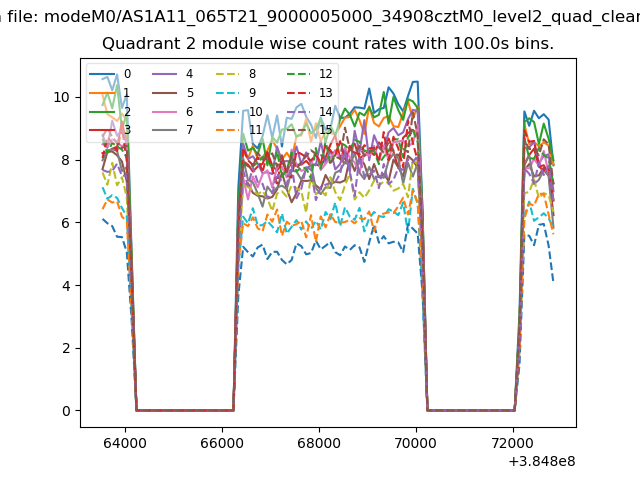
| Module-wise count rates for Quadrant B Data is divided into 100 sec bins |
 |
 |
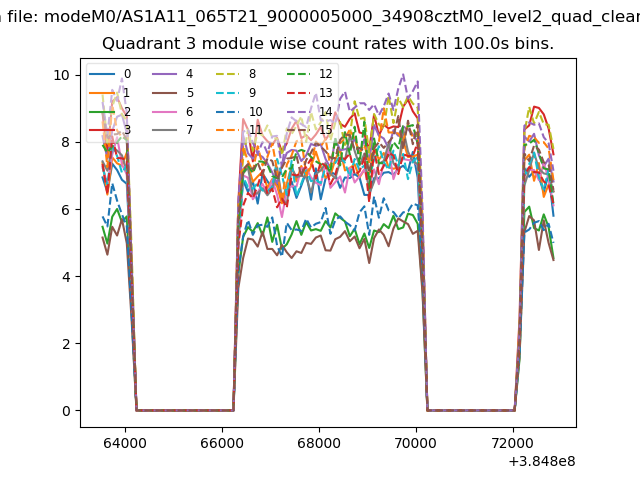
| Module-wise count rates for Quadrant C Data is divided into 100 sec bins |
 |
 |
| Module-wise count rates for Quadrant D Data is divided into 100 sec bins |
 |
 |
| Parameter | Plot |
|---|---|
| CZT HV Monitor | 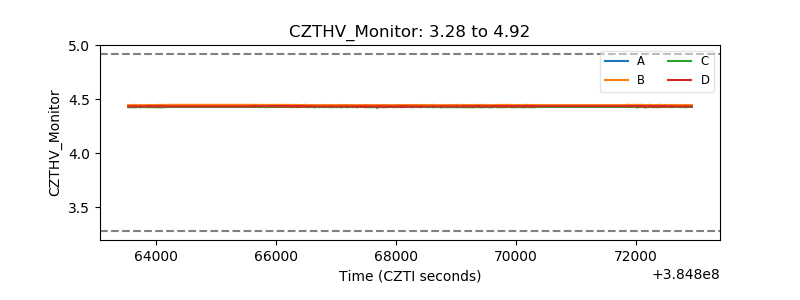 |
| D_VDD | 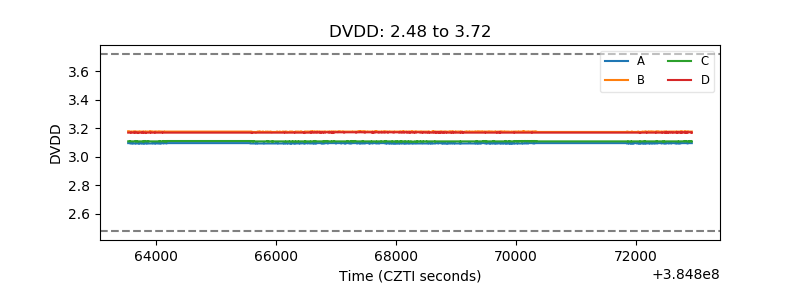 |
| Temperature 1 | 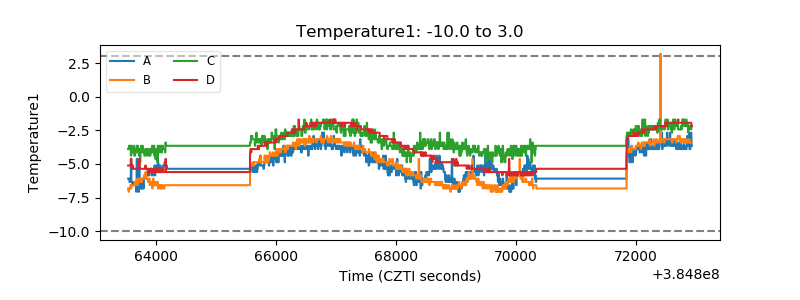 |
| Veto HV Monitor | 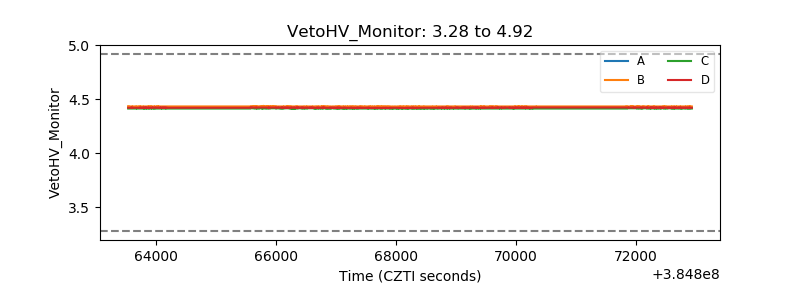 |
| Veto LLD | 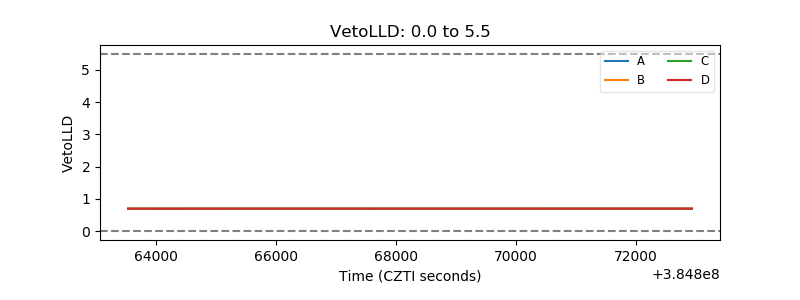 |
| Alpha Counter | 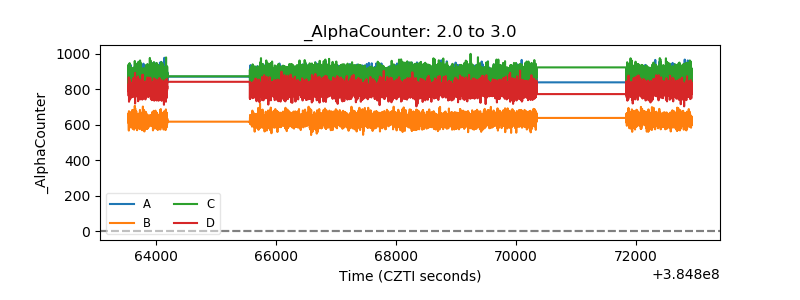 |
| _CPM_Rate | 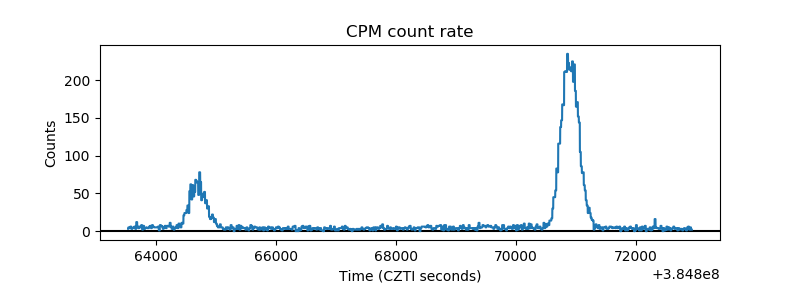 |
| CZT Counter | 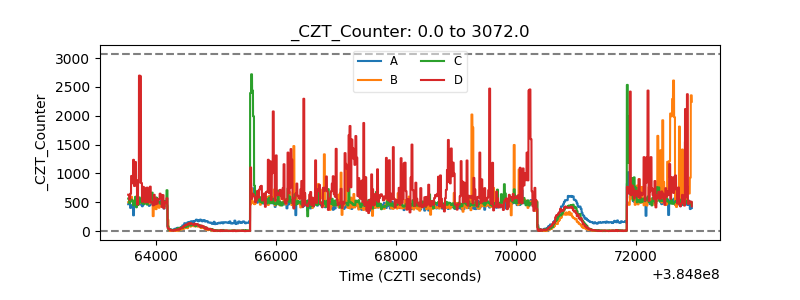 |
| +2.5 Volts monitor |  |
| +5 Volts monitor |  |
| _ROLL_ROT | 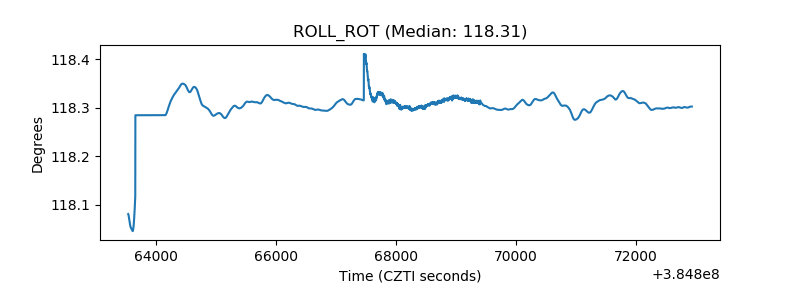 |
| _Roll_DEC | 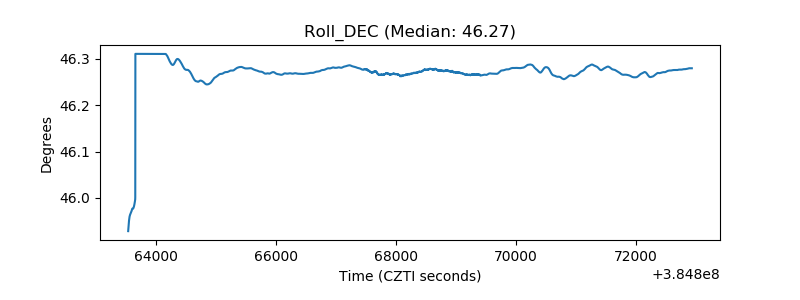 |
| _Roll_RA | 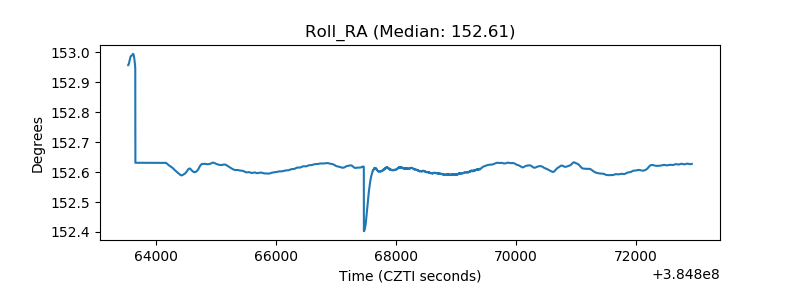 |
| Veto Counter | 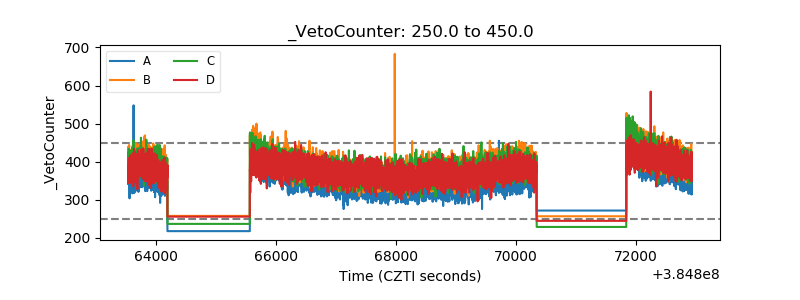 |