| Param | Original file | Final file |
|---|---|---|
| Filename | modeM0/AS1A11_086T01_9000005002cztM0_level2.fits | modeM0/AS1A11_086T01_9000005002cztM0_level2_quad_clean.evt |
| Size (bytes) | 430,289,280 | 357,629,760 |
| Size | 410.4 MB | 341.1 MB |
| Events in quadrant A | 2,552,660 | 1,957,732 |
| Events in quadrant B | 2,509,268 | 1,984,882 |
| Events in quadrant C | 2,651,248 | 2,019,609 |
| Events in quadrant D | 2,237,846 | 1,788,899 |
| Mode M9 | |||
|---|---|---|---|
| Quadrant | BADHDUFLAG | Total packets | Discarded packets |
| A | 0 | 202 | 0 |
| B | 0 | 202 | 0 |
| C | 0 | 202 | 0 |
| D | 0 | 203 | 0 |
| Mode SS | |||
|---|---|---|---|
| Quadrant | BADHDUFLAG | Total packets | Discarded packets |
| A | 0 | 914 | 0 |
| B | 0 | 914 | 0 |
| C | 0 | 914 | 0 |
| D | 0 | 914 | 0 |
| Mode M0 | |||
|---|---|---|---|
| Quadrant | BADHDUFLAG | Total packets | Discarded packets |
| A | 0 | 107277 | 0 |
| B | 0 | 116935 | 0 |
| C | 0 | 97156 | 0 |
| D | 0 | 134950 | 0 |
| Quadrant | Total seconds | Saturated seconds | Saturation percentage |
|---|---|---|---|
| A | 44852 | 2526 | 5.631856% |
| B | 44852 | 2499 | 5.571658% |
| C | 44852 | 419 | 0.934184% |
| D | 44852 | 1952 | 4.352091% |
Noise dominated data is calculated using 1-second bins in cleaned event files. If a bin has >2000 counts, and if more than 50% of those come from <1% of pixels, then it is considered to be noise-dominated and hence unusable.
| Quadrant | # 1 sec bins | Bins with >0 counts | Bins with >2000 counts | High rate bins dominated by noise | Noise dominated (total time) | Noise dominated (detector-on time) | Marked lightcurve |
|---|---|---|---|---|---|---|---|
| A | 101100 | 43864 | 0 | 0 | 0.00% | 0.00% |  |
| B | 101102 | 44820 | 0 | 0 | 0.00% | 0.00% |  |
| C | 101102 | 44840 | 0 | 0 | 0.00% | 0.00% |  |
| D | 101102 | 44728 | 0 | 0 | 0.00% | 0.00% | 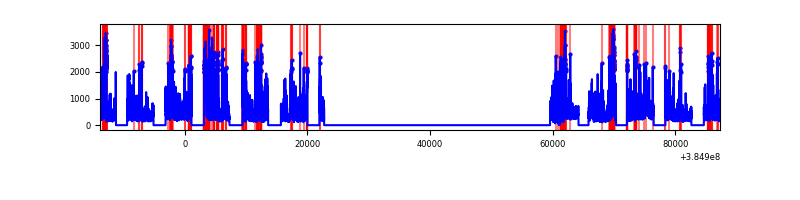 |
Top three noisy pixels from each quadrant. If the there are fewer than three noisy pixels in the level2.evt file, extra rows are filled as -1
| Pixel properties | Quadrant properties | ||||||
|---|---|---|---|---|---|---|---|
| Quadrant | DetID | PixID | Counts | Sigma | Mean | Median | Sigma |
| A | 0 | 29 | 2100 | 8.85 | 666 | 628 | 166.3 |
| A | 7 | 110 | 2074 | 8.69 | 666 | 628 | 166.3 |
| A | 9 | 19 | 2023 | 8.39 | 666 | 628 | 166.3 |
| B | 2 | 9 | 2154 | 11.4 | 664 | 637 | 133.1 |
| B | 3 | 80 | 1936 | 9.76 | 664 | 637 | 133.1 |
| B | 5 | 128 | 1745 | 8.33 | 664 | 637 | 133.1 |
| C | 1 | 81 | 2171 | 8.42 | 701 | 663 | 179.0 |
| C | 1 | 80 | 2092 | 7.98 | 701 | 663 | 179.0 |
| C | 3 | 203 | 2057 | 7.79 | 701 | 663 | 179.0 |
| D | 7 | 3 | 1674 | 6.42 | 640 | 588 | 169.2 |
| D | 10 | 189 | 1641 | 6.22 | 640 | 588 | 169.2 |
| D | 4 | 160 | 1612 | 6.05 | 640 | 588 | 169.2 |
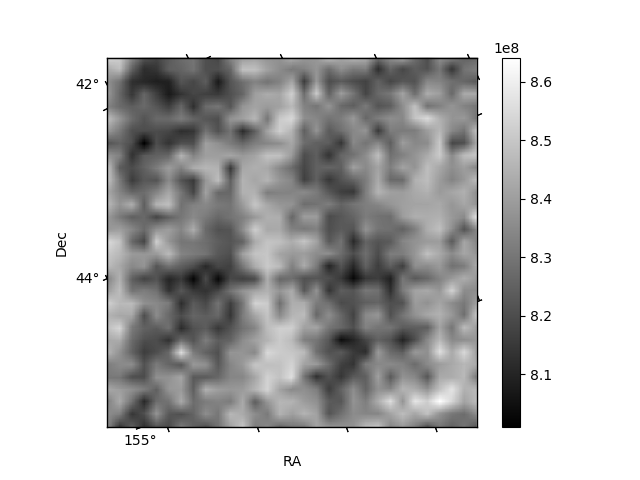
Histogram calculated using DETX and DETY for each event in the final _common_clean file
| Quadrant A |  |
 |
Quadrant B |
|---|---|---|---|
| Quadrant D |  |
 |
Quadrant C |
| Plot type | Count rate plots | Images |
|---|---|---|
| Comparison with Poisson distribution Blue bars denote a histogram of data divided into 1 sec bins. Red curve is a Poisson curve with rate = median count rate of data. |
 |
 |
| Quadrant-wise count rates Data is divided into 100 sec bins |
 |
|
| Module-wise count rates for Quadrant A Data is divided into 100 sec bins |
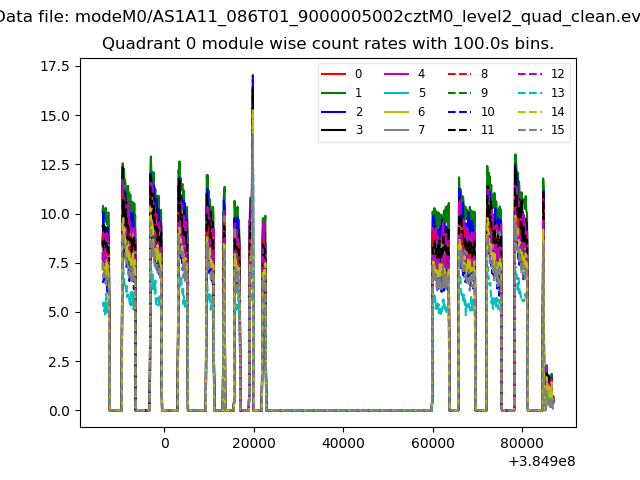 |
 |
| Module-wise count rates for Quadrant B Data is divided into 100 sec bins |
 |
 |
| Module-wise count rates for Quadrant C Data is divided into 100 sec bins |
 |
 |
| Module-wise count rates for Quadrant D Data is divided into 100 sec bins |
 |
 |
| Parameter | Plot |
|---|---|
| CZT HV Monitor |  |
| D_VDD |  |
| Temperature 1 | 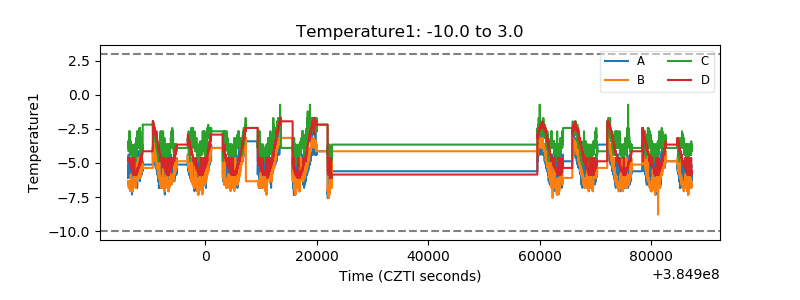 |
| Veto HV Monitor |  |
| Veto LLD |  |
| Alpha Counter |  |
| _CPM_Rate |  |
| CZT Counter |  |
| +2.5 Volts monitor |  |
| +5 Volts monitor |  |
| _ROLL_ROT |  |
| _Roll_DEC |  |
| _Roll_RA |  |
| Veto Counter |  |