| Param | Original file | Final file |
|---|---|---|
| Filename | modeM0/AS1A11_065T12_9000005004_34934cztM0_level2.evt | modeM0/AS1A11_065T12_9000005004_34934cztM0_level2_quad_clean.evt |
| Size (bytes) | 683,280,000 | 78,281,280 |
| Size | 651.6 MB | 74.7 MB |
| Events in quadrant A | 8,455,402 | 477,233 |
| Events in quadrant B | 3,645,699 | 499,742 |
| Events in quadrant C | 3,350,528 | 499,873 |
| Events in quadrant D | 4,813,188 | 450,846 |
| Mode M9 | |||
|---|---|---|---|
| Quadrant | BADHDUFLAG | Total packets | Discarded packets |
| A | 0 | 27 | 0 |
| B | 0 | 27 | 0 |
| C | 0 | 27 | 0 |
| D | 0 | 27 | 0 |
| Mode SS | |||
|---|---|---|---|
| Quadrant | BADHDUFLAG | Total packets | Discarded packets |
| A | 0 | 132 | 0 |
| B | 0 | 132 | 0 |
| C | 0 | 132 | 0 |
| D | 0 | 132 | 0 |
| Mode M0 | |||
|---|---|---|---|
| Quadrant | BADHDUFLAG | Total packets | Discarded packets |
| A | 0 | 29476 | 3 |
| B | 0 | 14924 | 2 |
| C | 0 | 13598 | 2 |
| D | 0 | 18595 | 2 |
| Quadrant | Total seconds | Saturated seconds | Saturation percentage |
|---|---|---|---|
| A | 6336 | 1408 | 22.222222% |
| B | 6336 | 132 | 2.083333% |
| C | 6336 | 68 | 1.073232% |
| D | 6336 | 340 | 5.366162% |
Noise dominated data is calculated using 1-second bins in cleaned event files. If a bin has >2000 counts, and if more than 50% of those come from <1% of pixels, then it is considered to be noise-dominated and hence unusable.
| Quadrant | # 1 sec bins | Bins with >0 counts | Bins with >2000 counts | High rate bins dominated by noise | Noise dominated (total time) | Noise dominated (detector-on time) | Marked lightcurve |
|---|---|---|---|---|---|---|---|
| A | 9111 | 6338 | 1223 | 1223 | 13.42% | 19.30% |  |
| B | 9111 | 6338 | 97 | 97 | 1.06% | 1.53% |  |
| C | 9111 | 6338 | 61 | 61 | 0.67% | 0.96% | 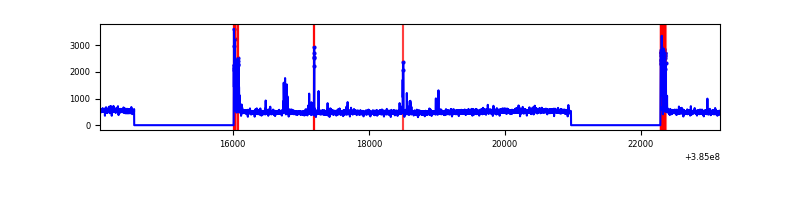 |
| D | 9111 | 6337 | 306 | 306 | 3.36% | 4.83% | 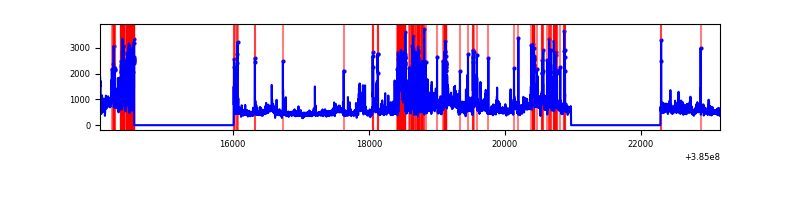 |
Top three noisy pixels from each quadrant. If the there are fewer than three noisy pixels in the level2.evt file, extra rows are filled as -1
| Pixel properties | Quadrant properties | ||||||
|---|---|---|---|---|---|---|---|
| Quadrant | DetID | PixID | Counts | Sigma | Mean | Median | Sigma |
| A | 15 | 169 | 5723583 | 41456.94 | 684 | 669 | 138.0 |
| A | 10 | 83 | 62345 | 446.78 | 684 | 669 | 138.0 |
| A | 13 | 6 | 15015 | 103.92 | 684 | 669 | 138.0 |
| B | 5 | 172 | 502406 | 3618.03 | 721 | 702 | 138.7 |
| B | 0 | 190 | 112496 | 806.2 | 721 | 702 | 138.7 |
| B | 4 | 171 | 62222 | 443.65 | 721 | 702 | 138.7 |
| C | 15 | 214 | 266282 | 1590.12 | 712 | 716 | 167.0 |
| C | 0 | 10 | 204066 | 1217.59 | 712 | 716 | 167.0 |
| C | 0 | 207 | 32224 | 188.66 | 712 | 716 | 167.0 |
| D | 8 | 195 | 812741 | 4707.63 | 696 | 676 | 172.5 |
| D | 10 | 118 | 260253 | 1504.8 | 696 | 676 | 172.5 |
| D | 1 | 52 | 237474 | 1372.74 | 696 | 676 | 172.5 |
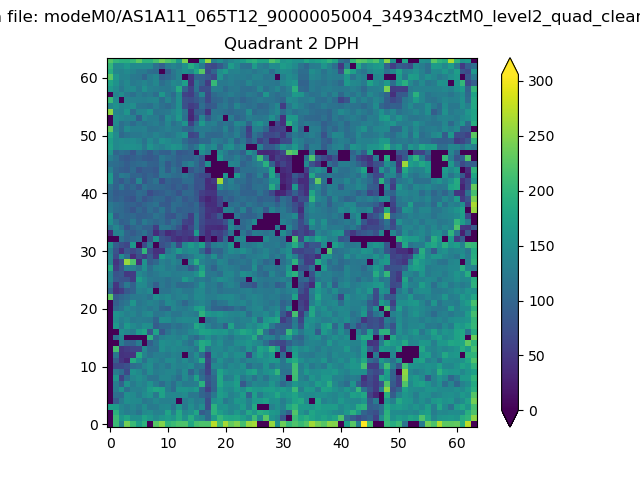
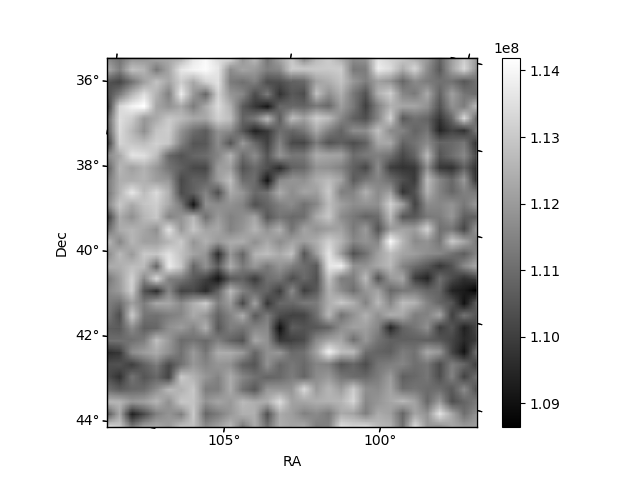
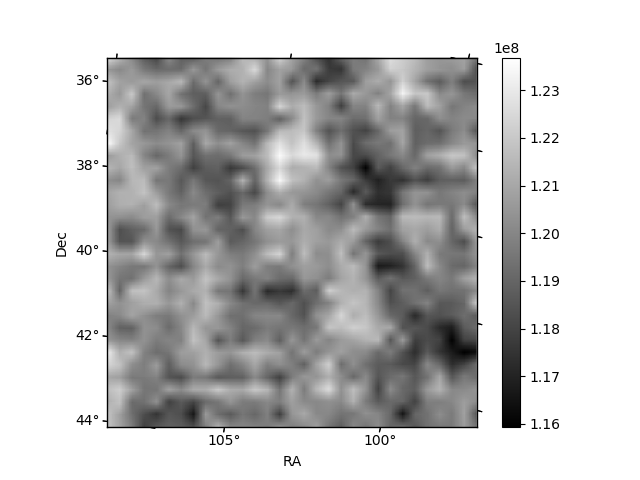
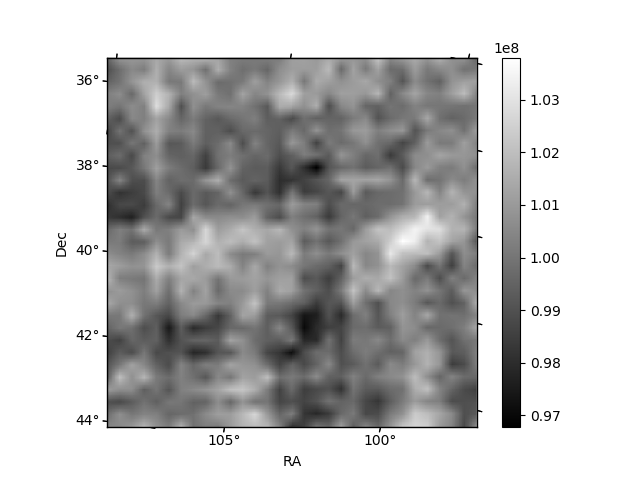
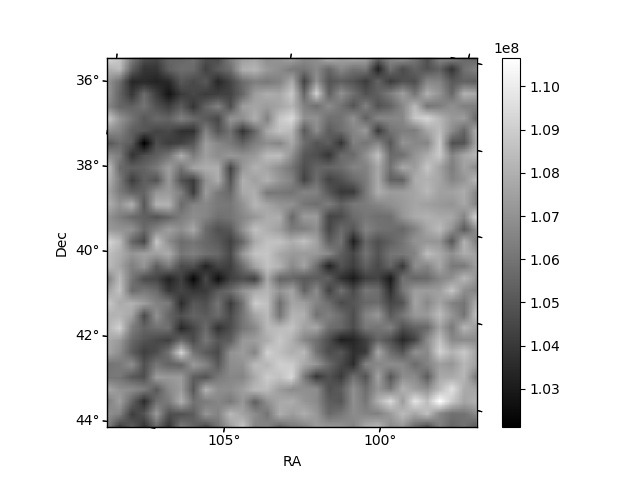
Histogram calculated using DETX and DETY for each event in the final _common_clean file
| Quadrant A | 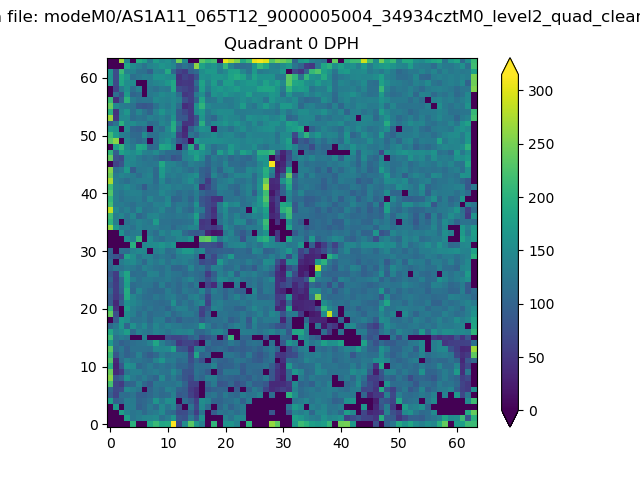 |
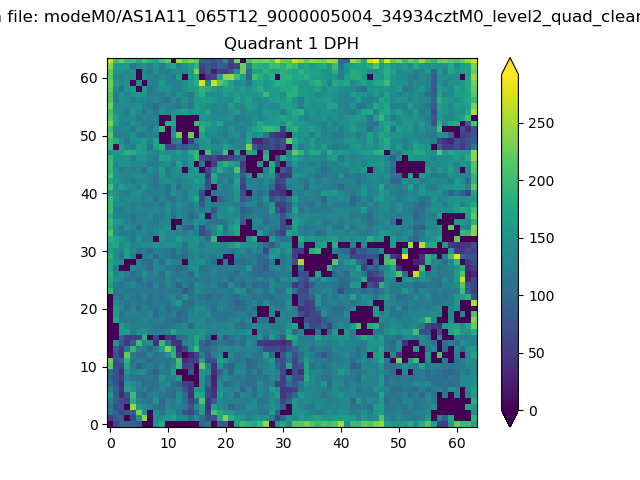 |
Quadrant B |
|---|---|---|---|
| Quadrant D | 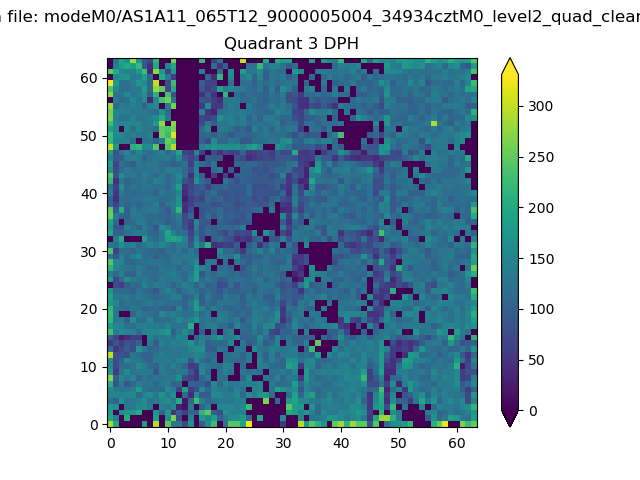 |
 |
Quadrant C |
| Plot type | Count rate plots | Images |
|---|---|---|
| Comparison with Poisson distribution Blue bars denote a histogram of data divided into 1 sec bins. Red curve is a Poisson curve with rate = median count rate of data. |
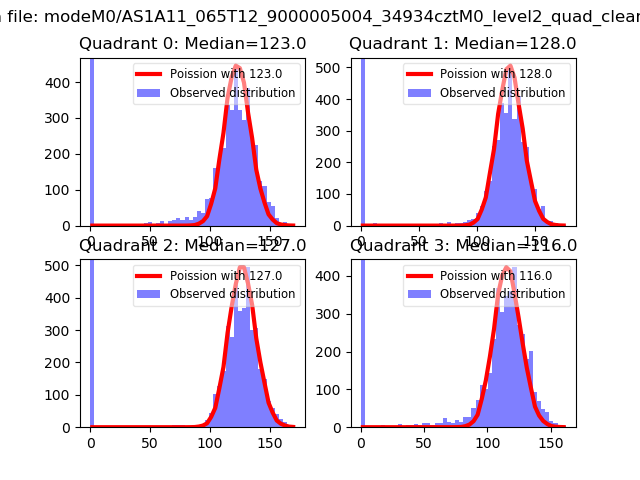 |
 |
| Quadrant-wise count rates Data is divided into 100 sec bins |
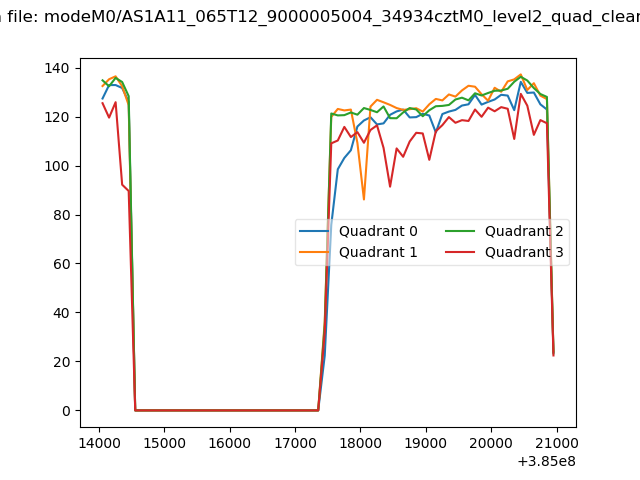 |
|
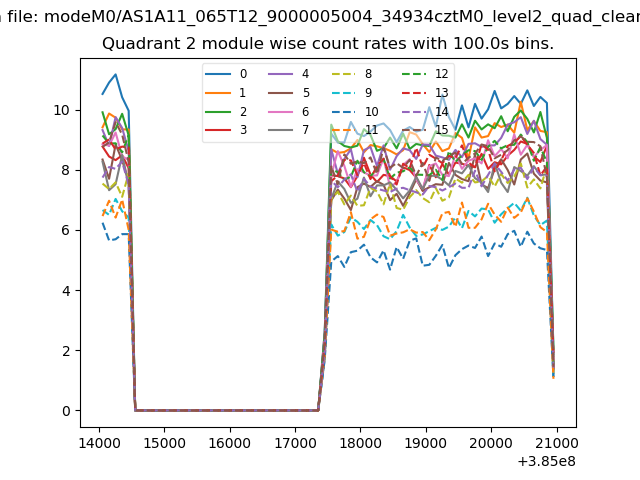
| Module-wise count rates for Quadrant A Data is divided into 100 sec bins |
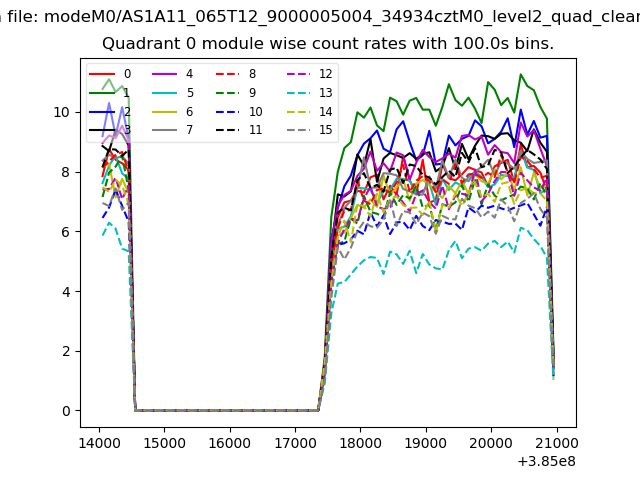 |
 |
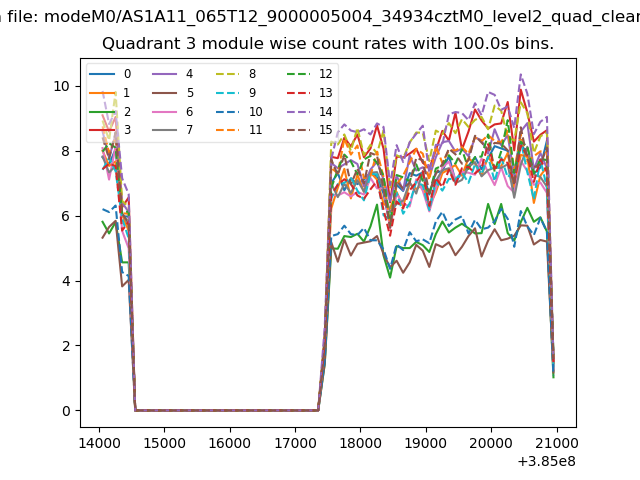
| Module-wise count rates for Quadrant B Data is divided into 100 sec bins |
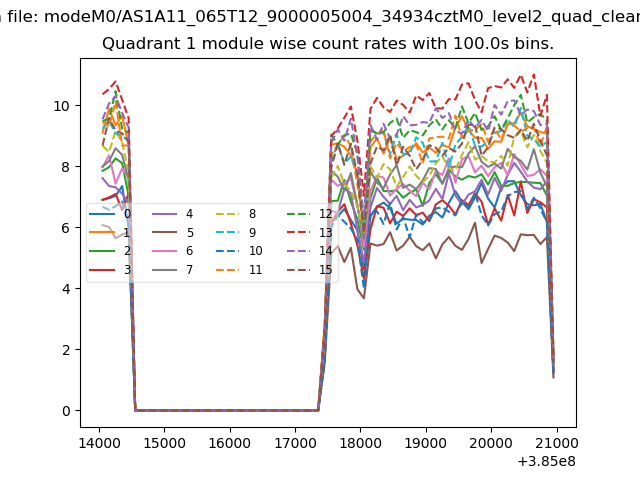 |
 |
| Module-wise count rates for Quadrant C Data is divided into 100 sec bins |
 |
 |
| Module-wise count rates for Quadrant D Data is divided into 100 sec bins |
 |
 |
| Parameter | Plot |
|---|---|
| CZT HV Monitor |  |
| D_VDD | 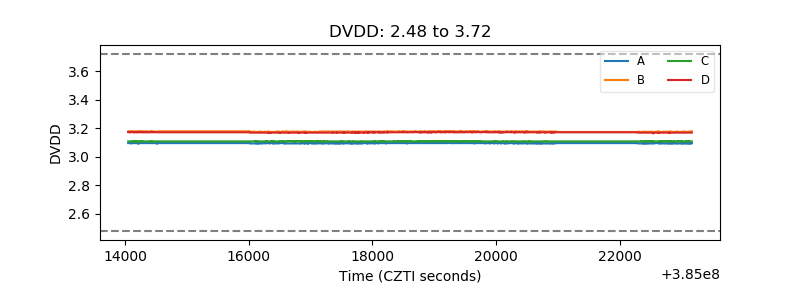 |
| Temperature 1 | 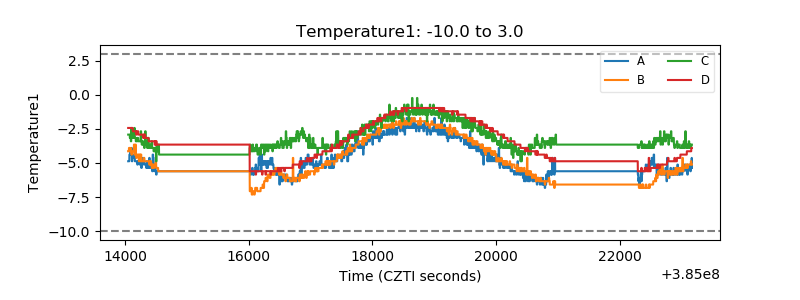 |
| Veto HV Monitor | 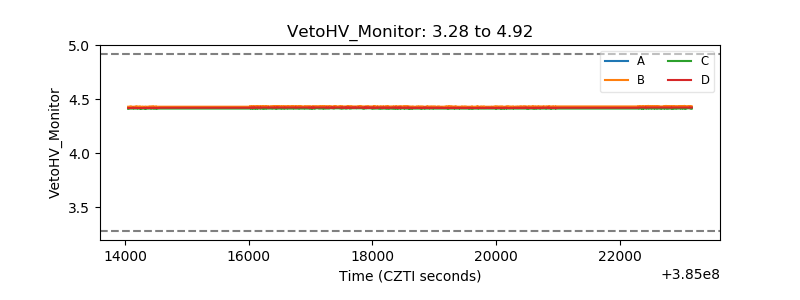 |
| Veto LLD | 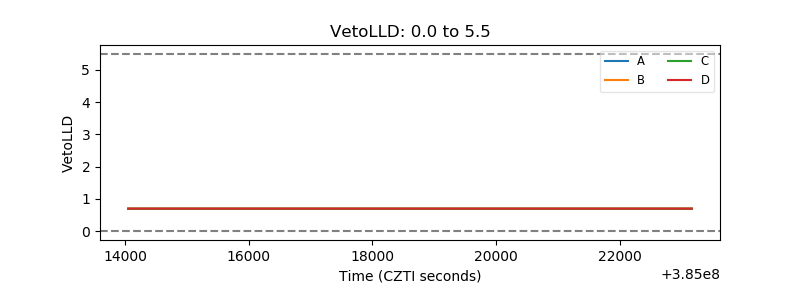 |
| Alpha Counter | 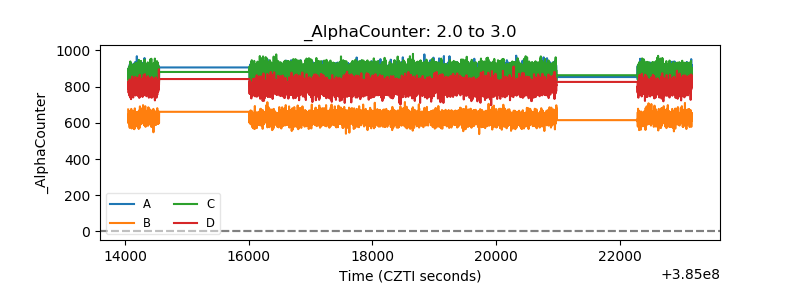 |
| _CPM_Rate | 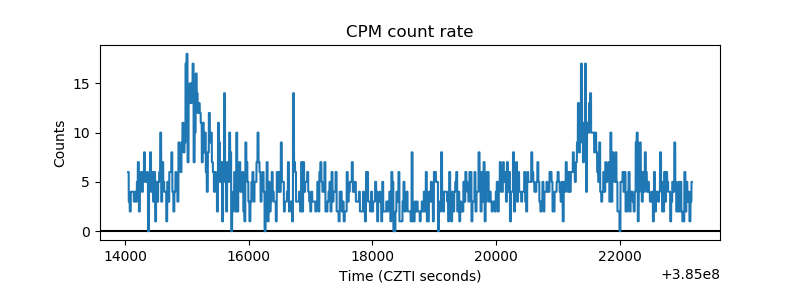 |
| CZT Counter | 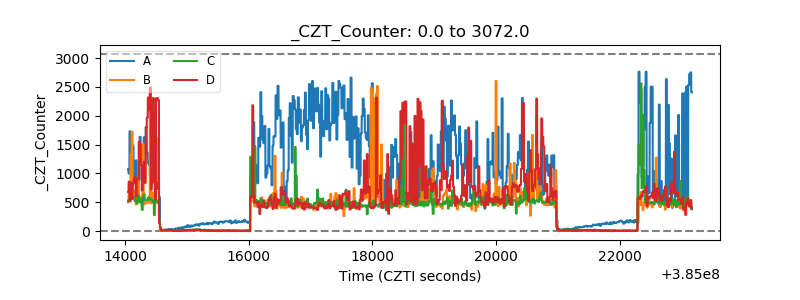 |
| +2.5 Volts monitor |  |
| +5 Volts monitor |  |
| _ROLL_ROT | 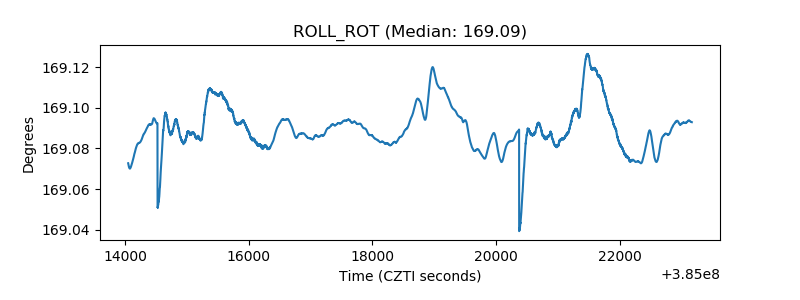 |
| _Roll_DEC | 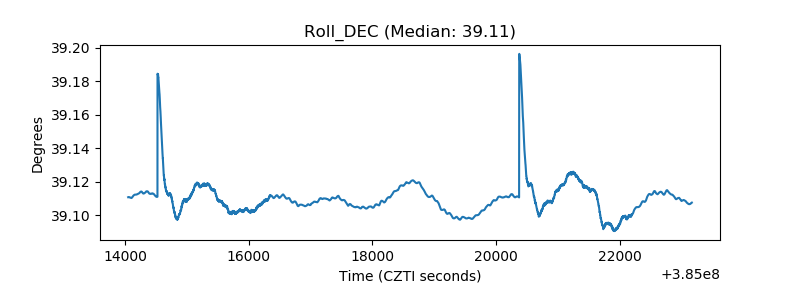 |
| _Roll_RA | 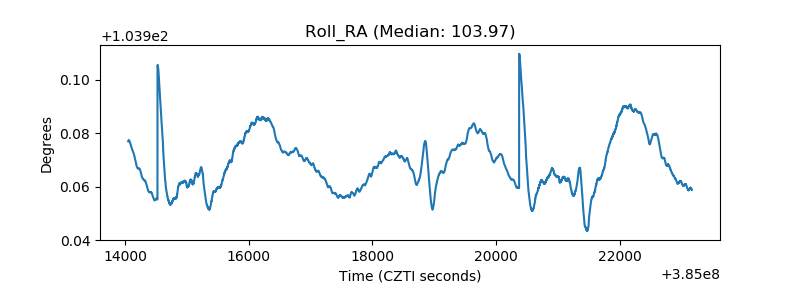 |
| Veto Counter | 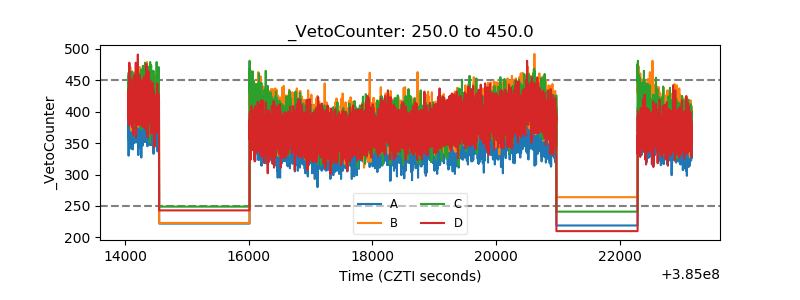 |