| Param | Original file | Final file |
|---|---|---|
| Filename | modeM0/AS1A11_047T01_9000005006cztM0_level2.fits | modeM0/AS1A11_047T01_9000005006cztM0_level2_quad_clean.evt |
| Size (bytes) | 75,631,680 | 48,369,600 |
| Size | 72.1 MB | 46.1 MB |
| Events in quadrant A | 434,284 | 229,804 |
| Events in quadrant B | 431,252 | 228,004 |
| Events in quadrant C | 452,118 | 222,353 |
| Events in quadrant D | 380,802 | 191,852 |
| Mode M9 | |||
|---|---|---|---|
| Quadrant | BADHDUFLAG | Total packets | Discarded packets |
| A | 0 | 28 | 0 |
| B | 0 | 28 | 0 |
| C | 0 | 28 | 0 |
| D | 0 | 28 | 0 |
| Mode SS | |||
|---|---|---|---|
| Quadrant | BADHDUFLAG | Total packets | Discarded packets |
| A | 0 | 174 | 0 |
| B | 0 | 174 | 0 |
| C | 0 | 174 | 0 |
| D | 0 | 174 | 0 |
| Mode M0 | |||
|---|---|---|---|
| Quadrant | BADHDUFLAG | Total packets | Discarded packets |
| A | 0 | 32336 | 0 |
| B | 0 | 22322 | 0 |
| C | 0 | 17875 | 0 |
| D | 0 | 27596 | 0 |
| Quadrant | Total seconds | Saturated seconds | Saturation percentage |
|---|---|---|---|
| A | 8520 | 921 | 10.809859% |
| B | 8520 | 441 | 5.176056% |
| C | 8520 | 85 | 0.997653% |
| D | 8520 | 422 | 4.953052% |
Noise dominated data is calculated using 1-second bins in cleaned event files. If a bin has >2000 counts, and if more than 50% of those come from <1% of pixels, then it is considered to be noise-dominated and hence unusable.
| Quadrant | # 1 sec bins | Bins with >0 counts | Bins with >2000 counts | High rate bins dominated by noise | Noise dominated (total time) | Noise dominated (detector-on time) | Marked lightcurve |
|---|---|---|---|---|---|---|---|
| A | 11356 | 8514 | 0 | 0 | 0.00% | 0.00% |  |
| B | 11356 | 8520 | 0 | 0 | 0.00% | 0.00% |  |
| C | 11356 | 8515 | 0 | 0 | 0.00% | 0.00% |  |
| D | 11356 | 8514 | 0 | 0 | 0.00% | 0.00% |  |
Top three noisy pixels from each quadrant. If the there are fewer than three noisy pixels in the level2.evt file, extra rows are filled as -1
| Pixel properties | Quadrant properties | ||||||
|---|---|---|---|---|---|---|---|
| Quadrant | DetID | PixID | Counts | Sigma | Mean | Median | Sigma |
| A | 7 | 110 | 347 | 8.08 | 113 | 106 | 29.8 |
| A | 14 | 95 | 345 | 8.02 | 113 | 106 | 29.8 |
| A | 0 | 30 | 344 | 7.98 | 113 | 106 | 29.8 |
| B | 2 | 9 | 375 | 10.56 | 114 | 108 | 25.3 |
| B | 5 | 128 | 335 | 8.98 | 114 | 108 | 25.3 |
| B | 3 | 80 | 334 | 8.94 | 114 | 108 | 25.3 |
| C | 1 | 81 | 380 | 8.28 | 119 | 111 | 32.5 |
| C | 3 | 202 | 355 | 7.51 | 119 | 111 | 32.5 |
| C | 1 | 80 | 350 | 7.36 | 119 | 111 | 32.5 |
| D | 15 | 47 | 279 | 5.86 | 109 | 99 | 30.7 |
| D | 15 | 46 | 274 | 5.7 | 109 | 99 | 30.7 |
| D | 6 | 83 | 273 | 5.67 | 109 | 99 | 30.7 |
Histogram calculated using DETX and DETY for each event in the final _common_clean file
| Quadrant A |  |
 |
Quadrant B |
|---|---|---|---|
| Quadrant D |  |
 |
Quadrant C |
| Plot type | Count rate plots | Images |
|---|---|---|
| Comparison with Poisson distribution Blue bars denote a histogram of data divided into 1 sec bins. Red curve is a Poisson curve with rate = median count rate of data. |
 |
 |
| Quadrant-wise count rates Data is divided into 100 sec bins |
 |
|
| Module-wise count rates for Quadrant A Data is divided into 100 sec bins |
 |
 |
| Module-wise count rates for Quadrant B Data is divided into 100 sec bins |
 |
 |
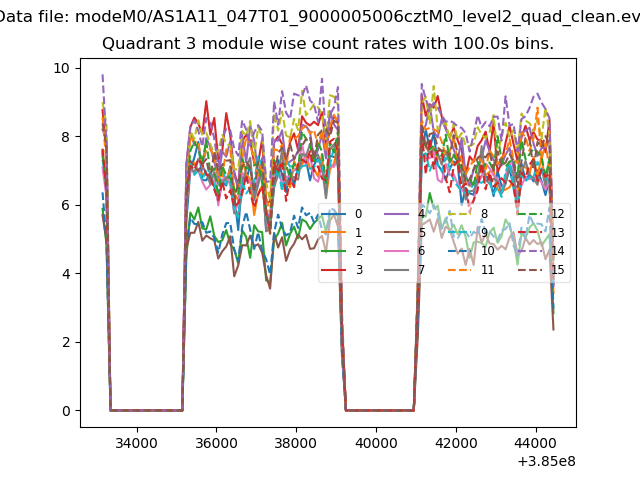
| Module-wise count rates for Quadrant C Data is divided into 100 sec bins |
 |
 |
| Module-wise count rates for Quadrant D Data is divided into 100 sec bins |
 |
 |
| Parameter | Plot |
|---|---|
| CZT HV Monitor |  |
| D_VDD | 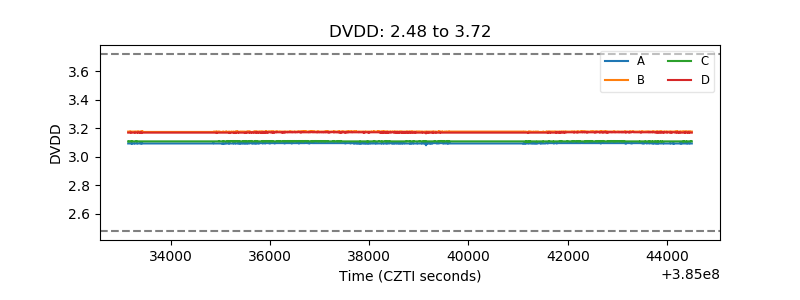 |
| Temperature 1 |  |
| Veto HV Monitor |  |
| Veto LLD |  |
| Alpha Counter |  |
| _CPM_Rate |  |
| CZT Counter |  |
| +2.5 Volts monitor |  |
| +5 Volts monitor |  |
| _ROLL_ROT |  |
| _Roll_DEC |  |
| _Roll_RA | 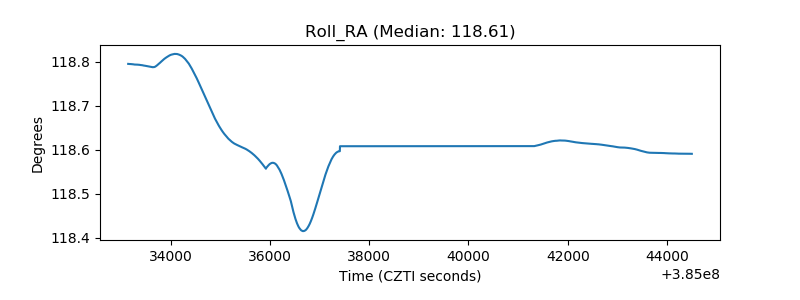 |
| Veto Counter |  |