| Param | Original file | Final file |
|---|---|---|
| Filename | modeM0/AS1A11_047T09_9000005010_34966cztM0_level2.evt | modeM0/AS1A11_047T09_9000005010_34966cztM0_level2_quad_clean.evt |
| Size (bytes) | 1,309,046,400 | 218,799,360 |
| Size | 1.2 GB | 208.7 MB |
| Events in quadrant A | 8,340,481 | 1,400,192 |
| Events in quadrant B | 9,683,391 | 1,405,400 |
| Events in quadrant C | 8,290,272 | 1,401,069 |
| Events in quadrant D | 12,235,568 | 1,300,766 |
| Mode SS | |||
|---|---|---|---|
| Quadrant | BADHDUFLAG | Total packets | Discarded packets |
| A | 0 | 334 | 0 |
| B | 0 | 334 | 0 |
| C | 0 | 334 | 0 |
| D | 0 | 334 | 0 |
| Mode M0 | |||
|---|---|---|---|
| Quadrant | BADHDUFLAG | Total packets | Discarded packets |
| A | 0 | 35144 | 5 |
| B | 0 | 39161 | 4 |
| C | 0 | 34010 | 4 |
| D | 0 | 47619 | 4 |
| Mode M9 | |||
|---|---|---|---|
| Quadrant | BADHDUFLAG | Total packets | Discarded packets |
| A | 0 | 55 | 0 |
| B | 0 | 55 | 0 |
| C | 0 | 55 | 0 |
| D | 0 | 55 | 0 |
| Quadrant | Total seconds | Saturated seconds | Saturation percentage |
|---|---|---|---|
| A | 16224 | 135 | 0.832101% |
| B | 16224 | 537 | 3.309911% |
| C | 16224 | 79 | 0.486933% |
| D | 16224 | 496 | 3.057199% |
Noise dominated data is calculated using 1-second bins in cleaned event files. If a bin has >2000 counts, and if more than 50% of those come from <1% of pixels, then it is considered to be noise-dominated and hence unusable.
| Quadrant | # 1 sec bins | Bins with >0 counts | Bins with >2000 counts | High rate bins dominated by noise | Noise dominated (total time) | Noise dominated (detector-on time) | Marked lightcurve |
|---|---|---|---|---|---|---|---|
| A | 21714 | 16228 | 105 | 105 | 0.48% | 0.65% | 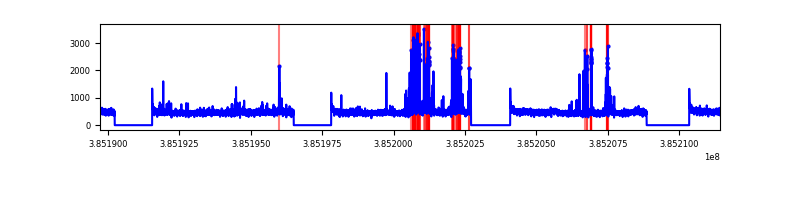 |
| B | 21714 | 16228 | 380 | 380 | 1.75% | 2.34% | 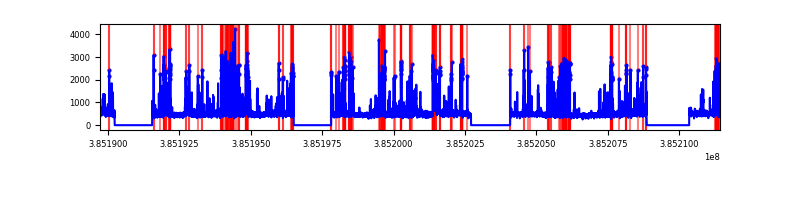 |
| C | 21714 | 16228 | 47 | 47 | 0.22% | 0.29% |  |
| D | 21714 | 16228 | 436 | 436 | 2.01% | 2.69% | 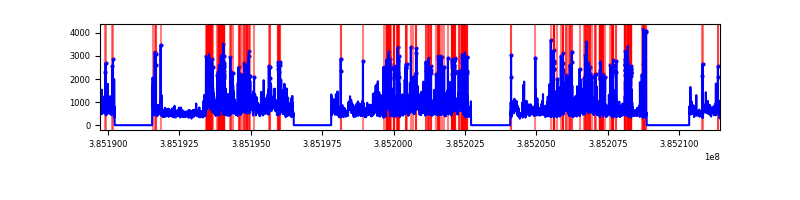 |
Top three noisy pixels from each quadrant. If the there are fewer than three noisy pixels in the level2.evt file, extra rows are filled as -1
| Pixel properties | Quadrant properties | ||||||
|---|---|---|---|---|---|---|---|
| Quadrant | DetID | PixID | Counts | Sigma | Mean | Median | Sigma |
| A | 15 | 223 | 784586 | 2065.5 | 1889 | 1850 | 379.0 |
| A | 10 | 83 | 166475 | 434.42 | 1889 | 1850 | 379.0 |
| A | 13 | 254 | 29175 | 72.11 | 1889 | 1850 | 379.0 |
| B | 5 | 172 | 1954213 | 5445.64 | 1861 | 1810 | 358.5 |
| B | 0 | 190 | 229785 | 635.87 | 1861 | 1810 | 358.5 |
| B | 5 | 31 | 46538 | 124.75 | 1861 | 1810 | 358.5 |
| C | 15 | 214 | 671696 | 1577.51 | 1839 | 1856 | 424.6 |
| C | 0 | 10 | 212400 | 495.84 | 1839 | 1856 | 424.6 |
| C | 12 | 250 | 87574 | 201.87 | 1839 | 1856 | 424.6 |
| D | 8 | 195 | 2591426 | 5788.3 | 1825 | 1774 | 447.4 |
| D | 13 | 249 | 872870 | 1947.04 | 1825 | 1774 | 447.4 |
| D | 10 | 118 | 410026 | 912.51 | 1825 | 1774 | 447.4 |
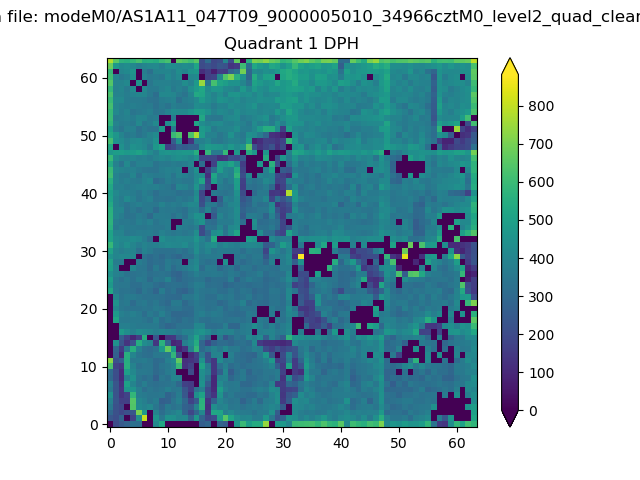
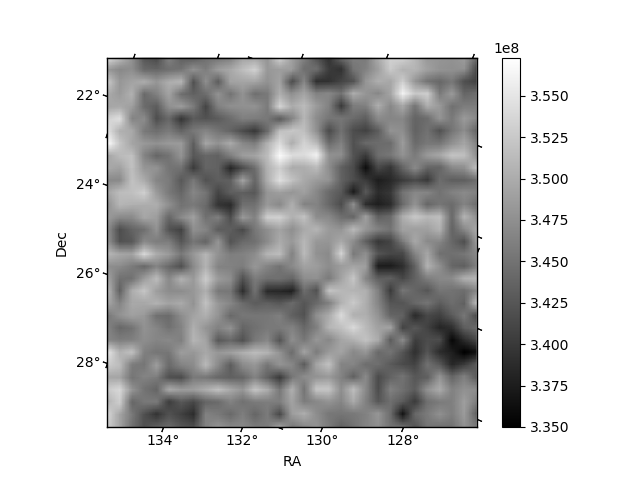
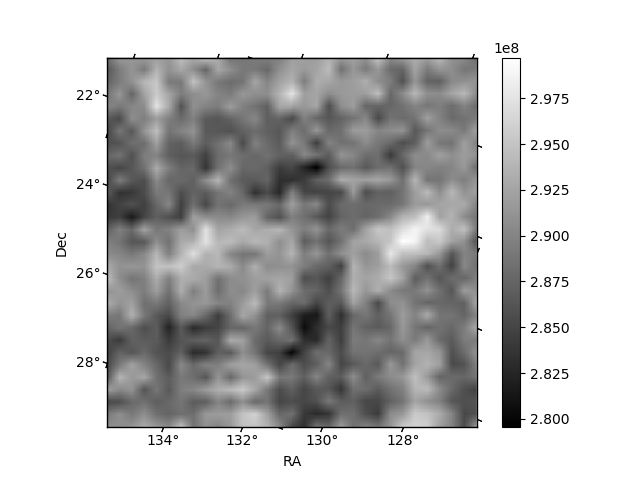
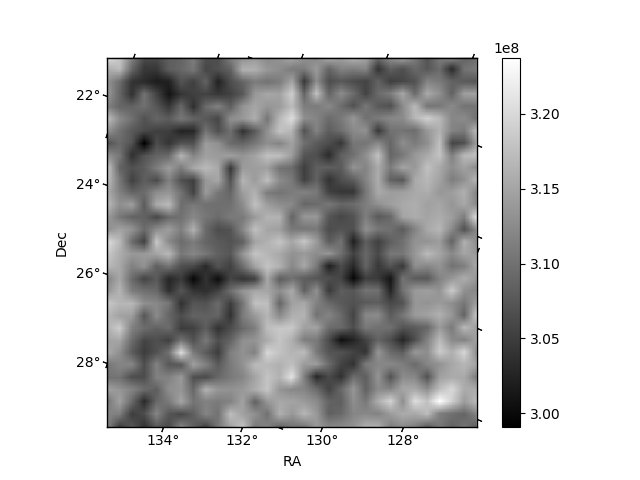
Histogram calculated using DETX and DETY for each event in the final _common_clean file
| Quadrant A | 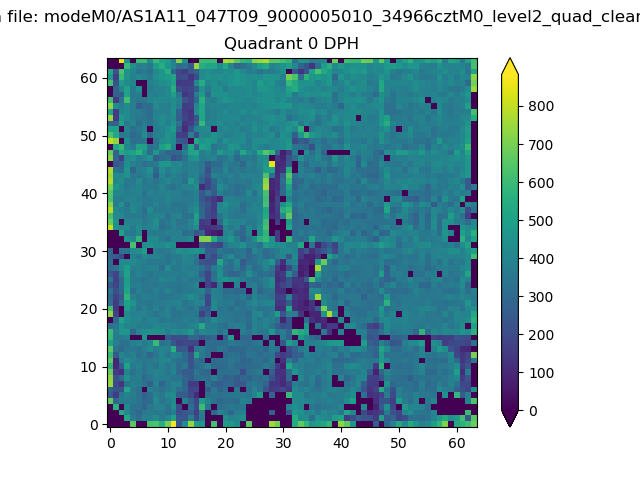 |
 |
Quadrant B |
|---|---|---|---|
| Quadrant D | 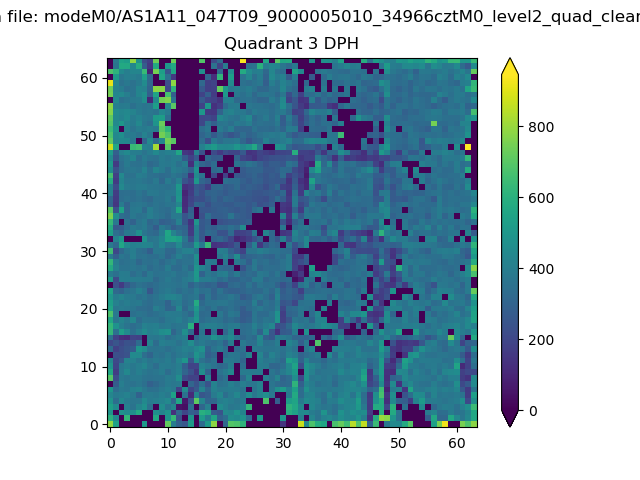 |
 |
Quadrant C |
| Plot type | Count rate plots | Images |
|---|---|---|
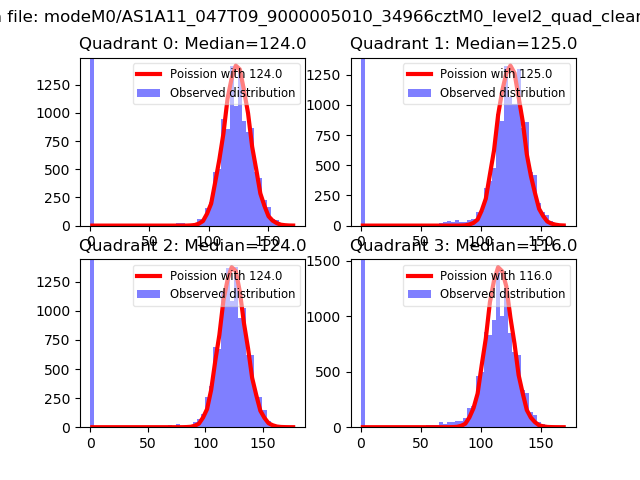
| Comparison with Poisson distribution Blue bars denote a histogram of data divided into 1 sec bins. Red curve is a Poisson curve with rate = median count rate of data. |
 |
 |
| Quadrant-wise count rates Data is divided into 100 sec bins |
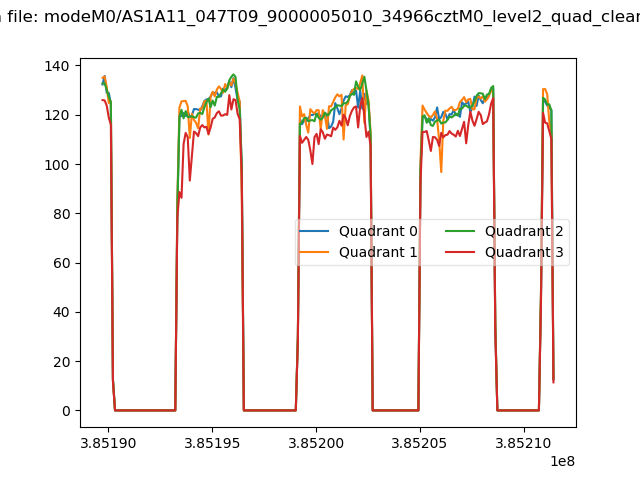 |
|
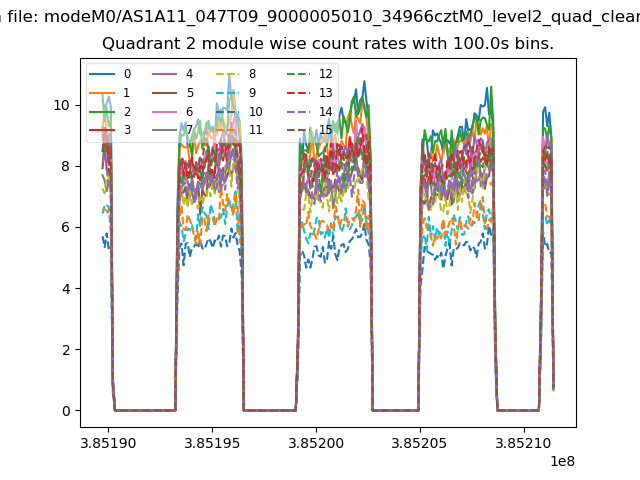
| Module-wise count rates for Quadrant A Data is divided into 100 sec bins |
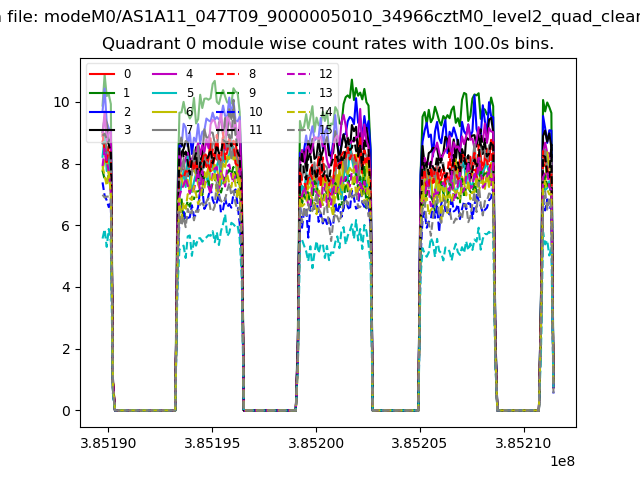 |
 |
| Module-wise count rates for Quadrant B Data is divided into 100 sec bins |
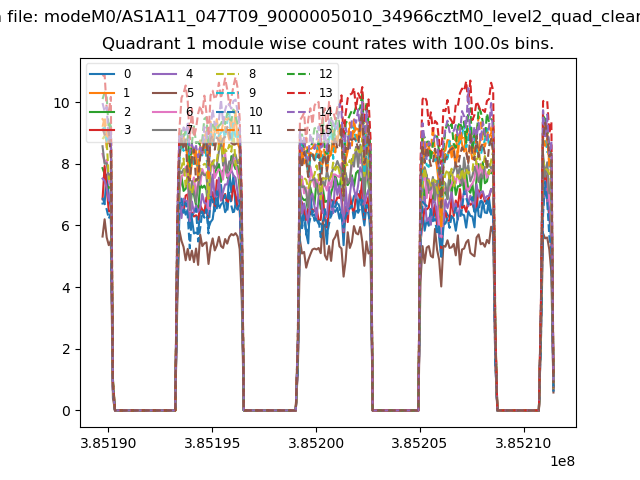 |
 |
| Module-wise count rates for Quadrant C Data is divided into 100 sec bins |
 |
 |
| Module-wise count rates for Quadrant D Data is divided into 100 sec bins |
 |
 |
| Parameter | Plot |
|---|---|
| CZT HV Monitor | 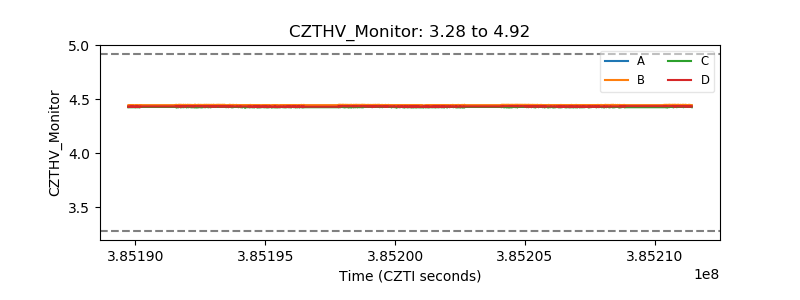 |
| D_VDD | 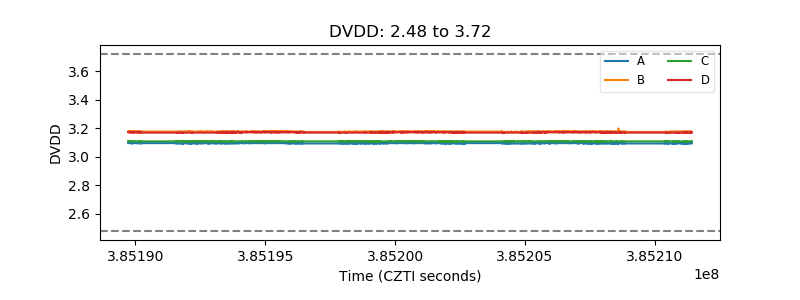 |
| Temperature 1 | 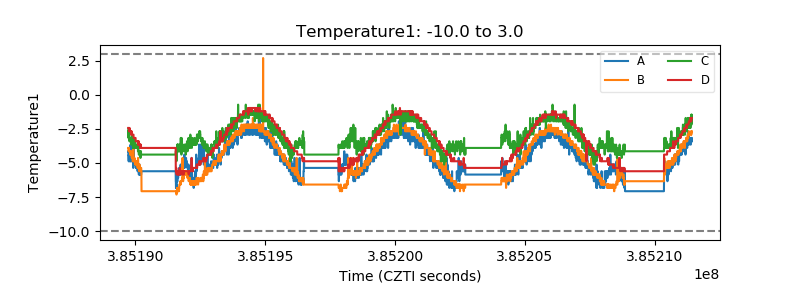 |
| Veto HV Monitor | 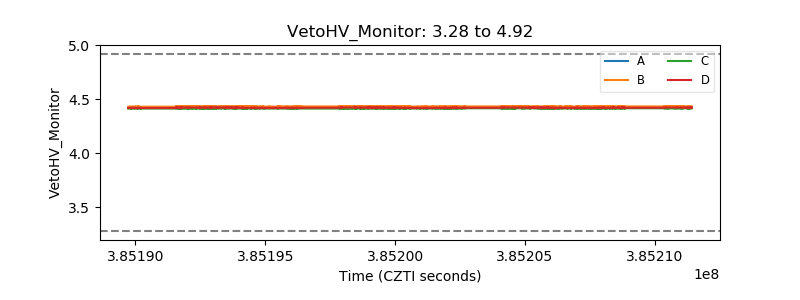 |
| Veto LLD | 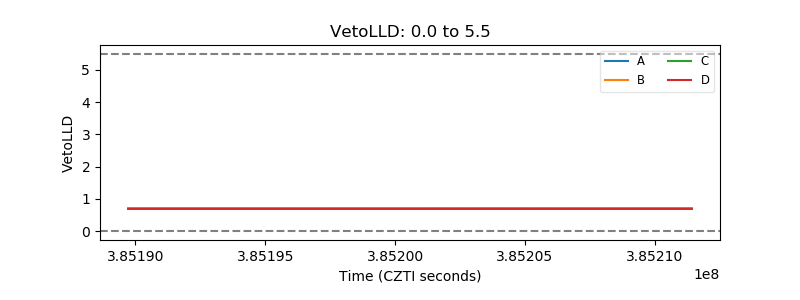 |
| Alpha Counter | 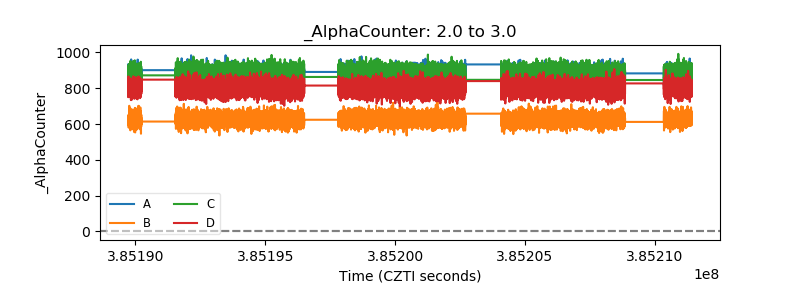 |
| _CPM_Rate | 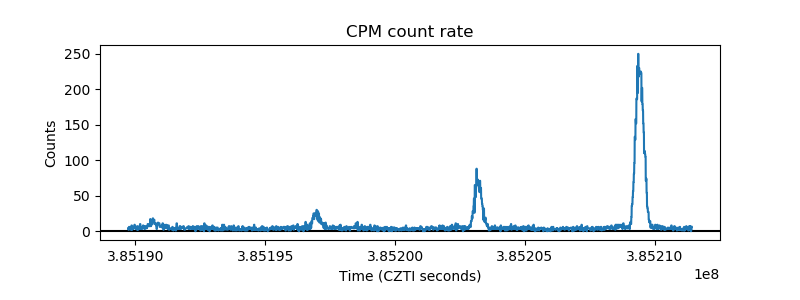 |
| CZT Counter |  |
| +2.5 Volts monitor |  |
| +5 Volts monitor | 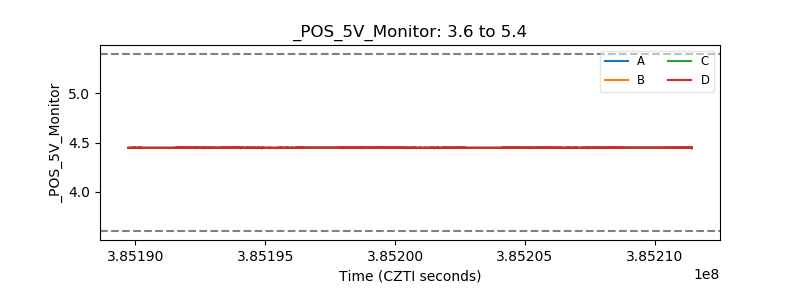 |
| _ROLL_ROT | 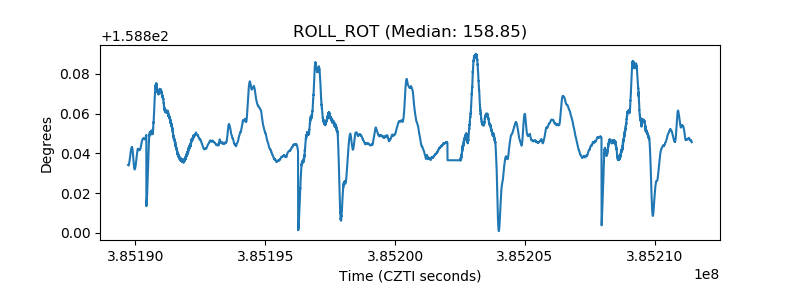 |
| _Roll_DEC | 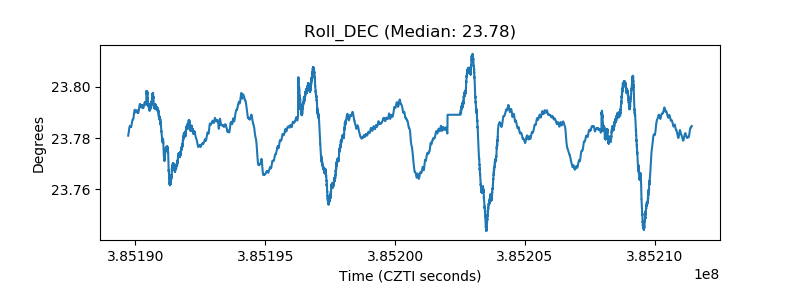 |
| _Roll_RA | 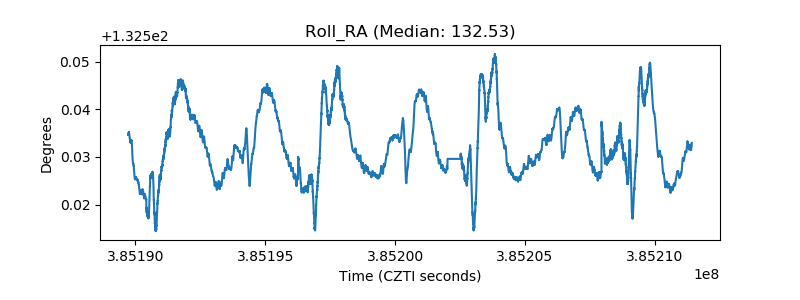 |
| Veto Counter | 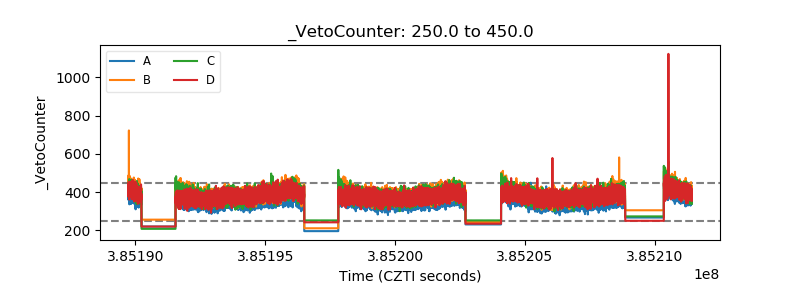 |