| Param | Original file | Final file |
|---|---|---|
| Filename | modeM0/AS1A11_047T09_9000005010_34974cztM0_level2.evt | modeM0/AS1A11_047T09_9000005010_34974cztM0_level2_quad_clean.evt |
| Size (bytes) | 144,141,120 | 22,475,520 |
| Size | 137.5 MB | 21.4 MB |
| Events in quadrant A | 584,910 | 164,987 |
| Events in quadrant B | 630,947 | 167,054 |
| Events in quadrant C | 703,671 | 160,599 |
| Events in quadrant D | 2,363,460 | 98,311 |
| Mode SS | |||
|---|---|---|---|
| Quadrant | BADHDUFLAG | Total packets | Discarded packets |
| A | 0 | 24 | 0 |
| B | 0 | 24 | 0 |
| C | 0 | 24 | 0 |
| D | 0 | 24 | 0 |
| Mode M0 | |||
|---|---|---|---|
| Quadrant | BADHDUFLAG | Total packets | Discarded packets |
| A | 0 | 2474 | 1 |
| B | 0 | 2598 | 1 |
| C | 0 | 2745 | 1 |
| D | 0 | 7826 | 1 |
| Mode M9 | |||
|---|---|---|---|
| Quadrant | BADHDUFLAG | Total packets | Discarded packets |
| A | 0 | 11 | 0 |
| B | 0 | 11 | 0 |
| C | 0 | 11 | 0 |
| D | 0 | 12 | 0 |
| Quadrant | Total seconds | Saturated seconds | Saturation percentage |
|---|---|---|---|
| A | 1171 | 2 | 0.170794% |
| B | 1171 | 19 | 1.622545% |
| C | 1171 | 32 | 2.732707% |
| D | 1171 | 655 | 55.935098% |
Noise dominated data is calculated using 1-second bins in cleaned event files. If a bin has >2000 counts, and if more than 50% of those come from <1% of pixels, then it is considered to be noise-dominated and hence unusable.
| Quadrant | # 1 sec bins | Bins with >0 counts | Bins with >2000 counts | High rate bins dominated by noise | Noise dominated (total time) | Noise dominated (detector-on time) | Marked lightcurve |
|---|---|---|---|---|---|---|---|
| A | 1171 | 1171 | 1 | 1 | 0.09% | 0.09% | 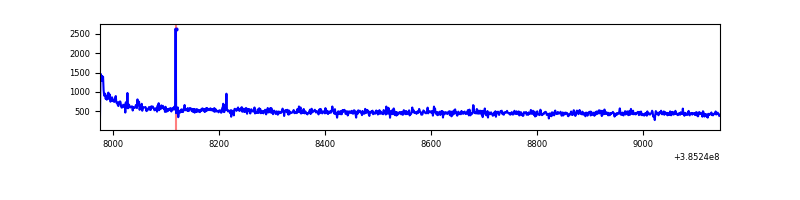 |
| B | 1171 | 1171 | 15 | 15 | 1.28% | 1.28% | 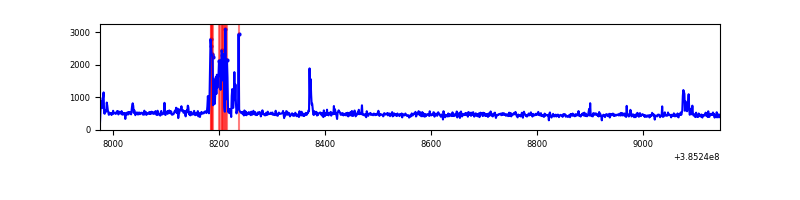 |
| C | 1171 | 1171 | 29 | 29 | 2.48% | 2.48% | 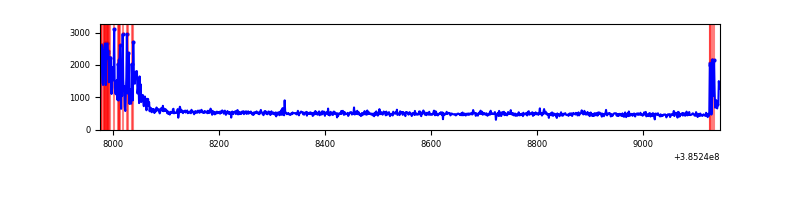 |
| D | 1171 | 1171 | 647 | 647 | 55.25% | 55.25% | 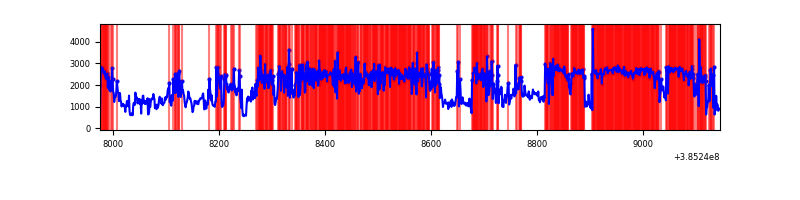 |
Top three noisy pixels from each quadrant. If the there are fewer than three noisy pixels in the level2.evt file, extra rows are filled as -1
| Pixel properties | Quadrant properties | ||||||
|---|---|---|---|---|---|---|---|
| Quadrant | DetID | PixID | Counts | Sigma | Mean | Median | Sigma |
| A | 10 | 83 | 30139 | 1003.98 | 140 | 137 | 29.9 |
| A | 13 | 6 | 6785 | 222.47 | 140 | 137 | 29.9 |
| A | 9 | 143 | 5686 | 185.69 | 140 | 137 | 29.9 |
| B | 5 | 172 | 69404 | 2434.04 | 140 | 137 | 28.5 |
| B | 15 | 85 | 7590 | 261.9 | 140 | 137 | 28.5 |
| B | 12 | 111 | 3167 | 106.47 | 140 | 137 | 28.5 |
| C | 0 | 10 | 105128 | 3115.36 | 135 | 136 | 33.7 |
| C | 15 | 214 | 51753 | 1531.6 | 135 | 136 | 33.7 |
| C | 15 | 159 | 14653 | 430.75 | 135 | 136 | 33.7 |
| D | 13 | 174 | 910583 | 36686.79 | 94 | 91 | 24.8 |
| D | 8 | 195 | 366071 | 14746.57 | 94 | 91 | 24.8 |
| D | 1 | 52 | 336338 | 13548.53 | 94 | 91 | 24.8 |
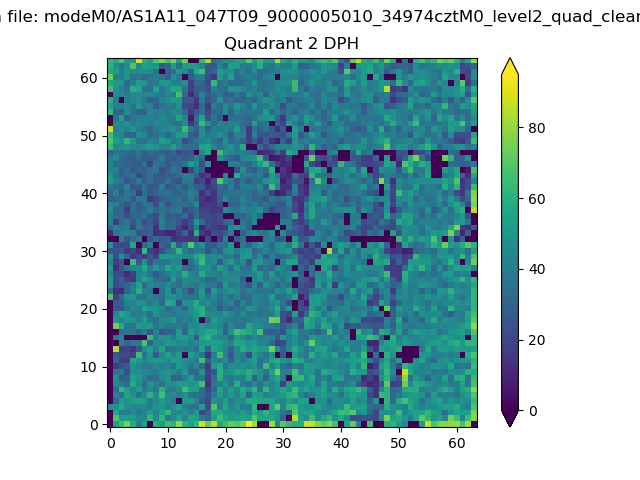
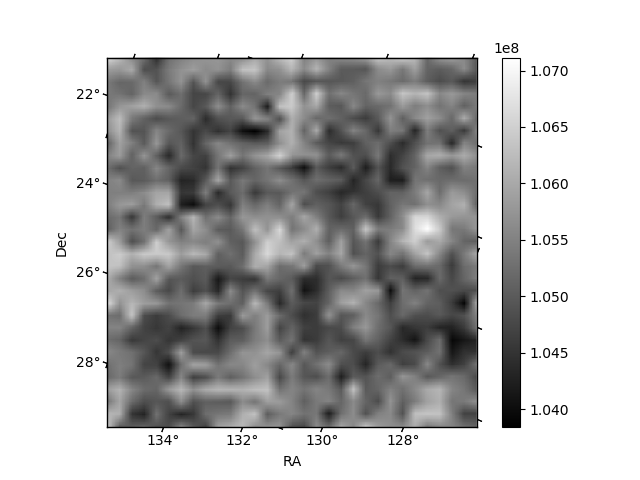
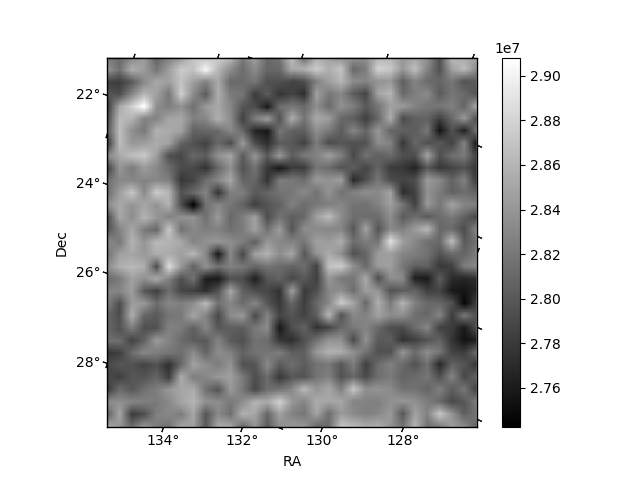
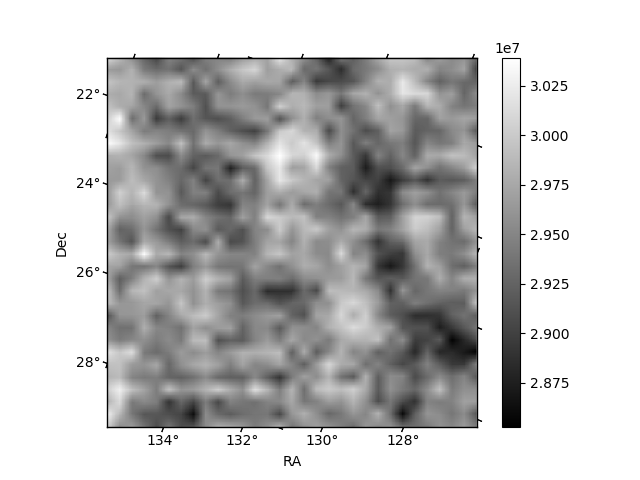
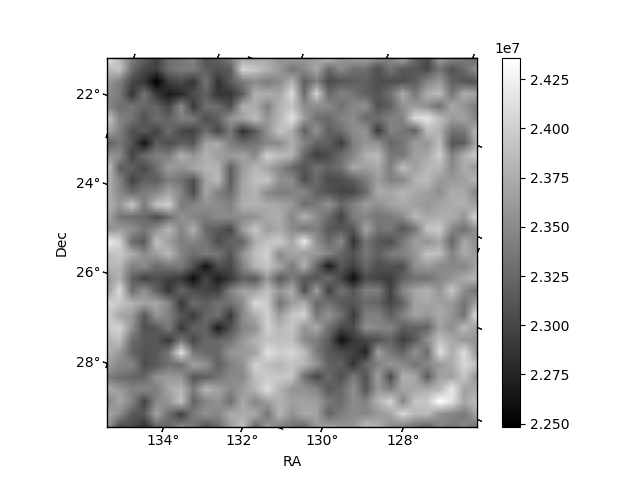
Histogram calculated using DETX and DETY for each event in the final _common_clean file
| Quadrant A | 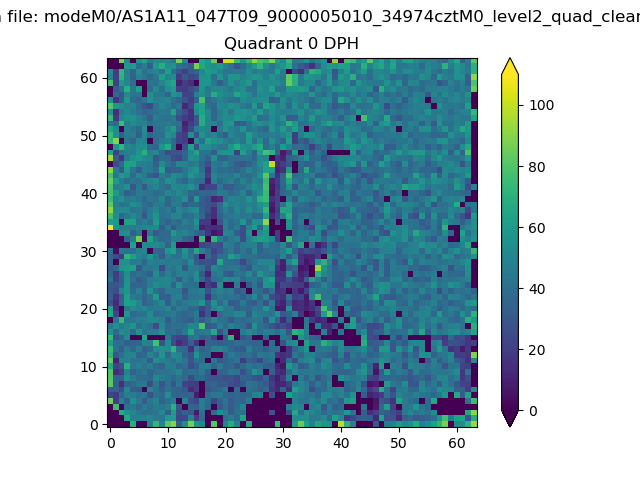 |
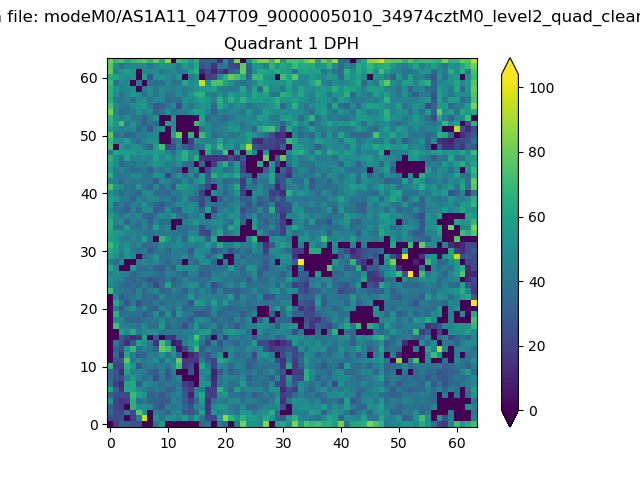 |
Quadrant B |
|---|---|---|---|
| Quadrant D | 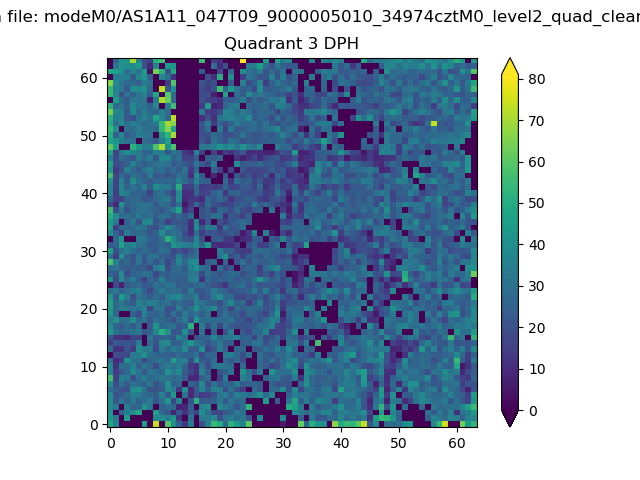 |
 |
Quadrant C |
| Plot type | Count rate plots | Images |
|---|---|---|
| Comparison with Poisson distribution Blue bars denote a histogram of data divided into 1 sec bins. Red curve is a Poisson curve with rate = median count rate of data. |
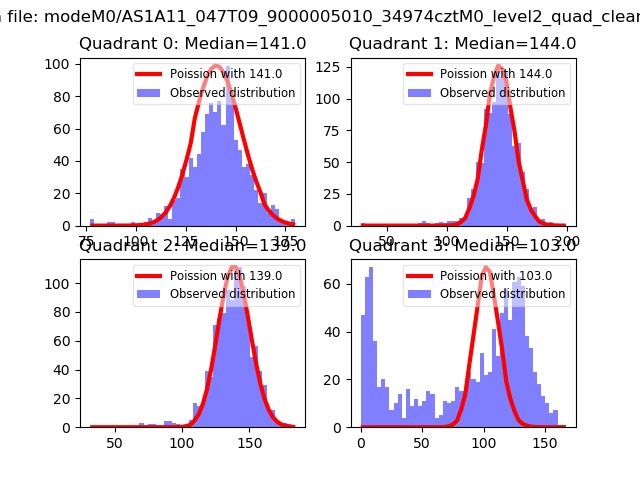 |
 |
| Quadrant-wise count rates Data is divided into 100 sec bins |
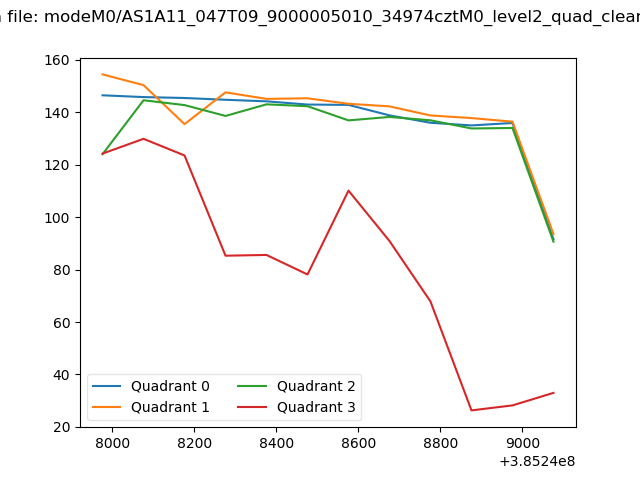 |
|
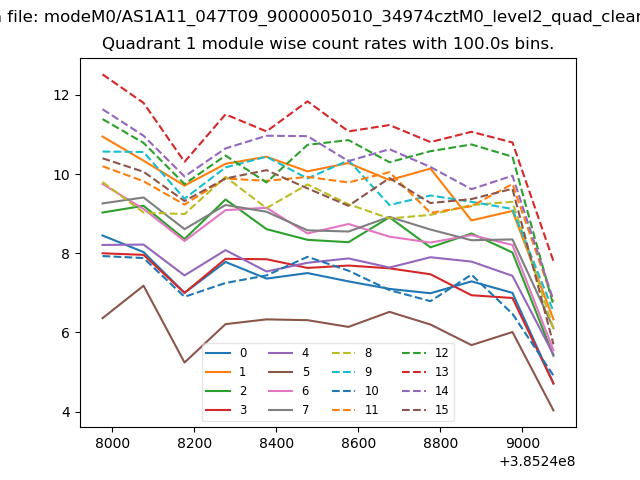
| Module-wise count rates for Quadrant A Data is divided into 100 sec bins |
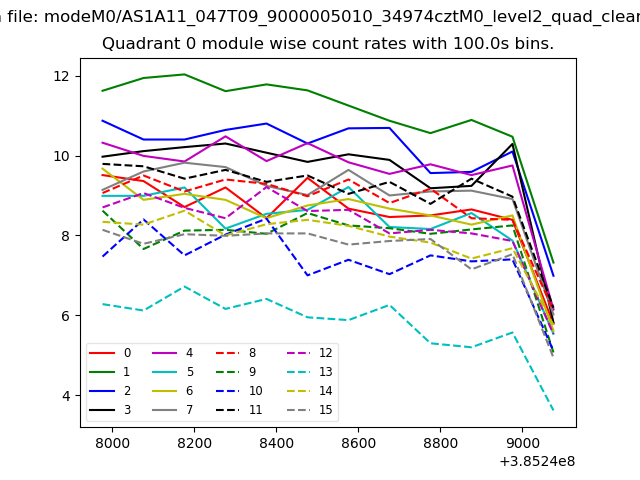 |
 |
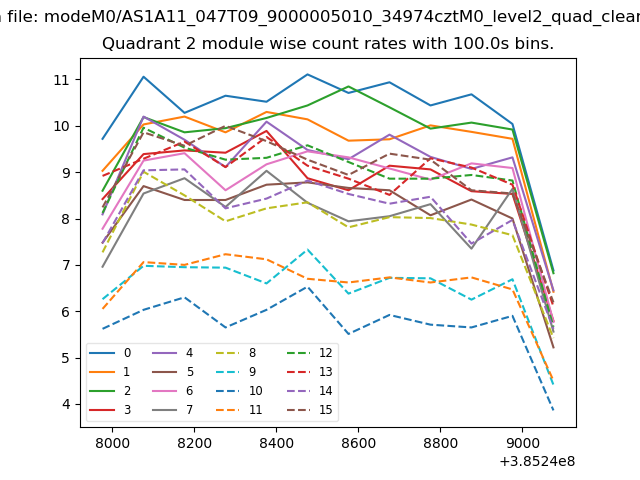
| Module-wise count rates for Quadrant B Data is divided into 100 sec bins |
 |
 |
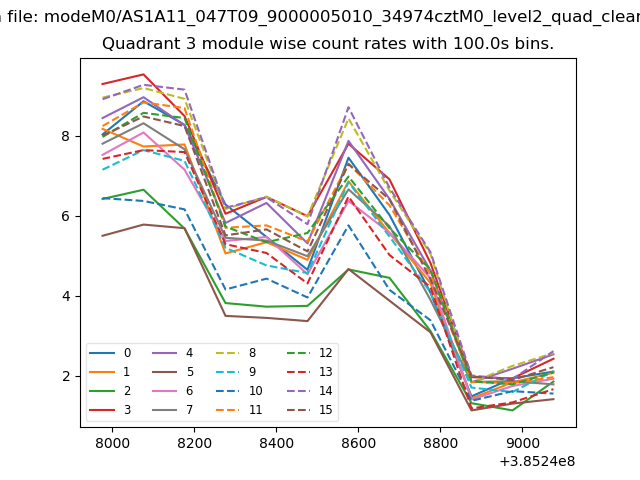
| Module-wise count rates for Quadrant C Data is divided into 100 sec bins |
 |
 |
| Module-wise count rates for Quadrant D Data is divided into 100 sec bins |
 |
 |
| Parameter | Plot |
|---|---|
| CZT HV Monitor | 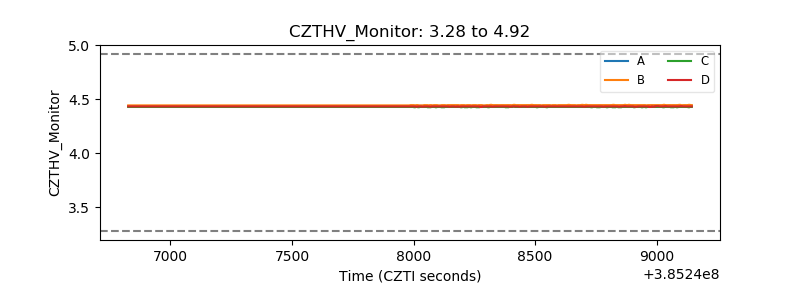 |
| D_VDD | 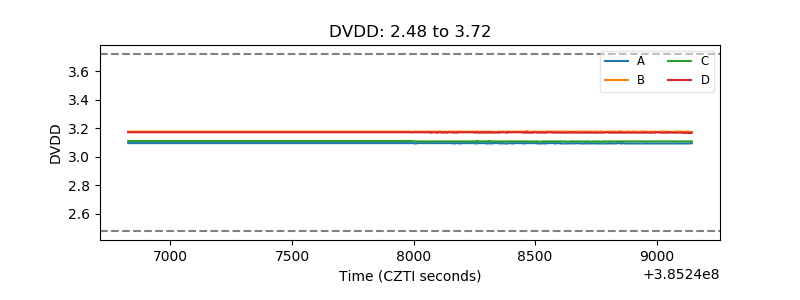 |
| Temperature 1 | 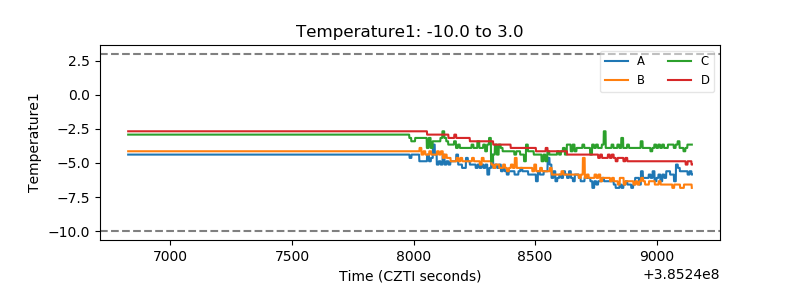 |
| Veto HV Monitor | 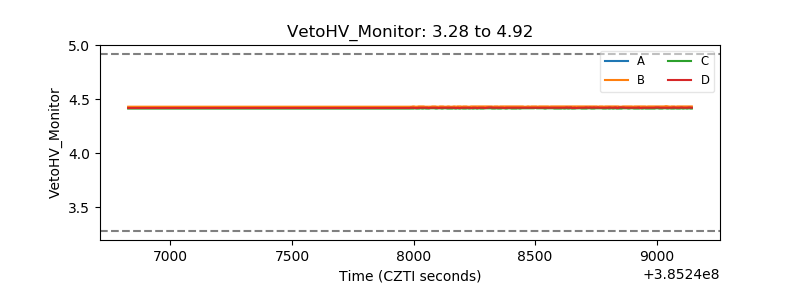 |
| Veto LLD | 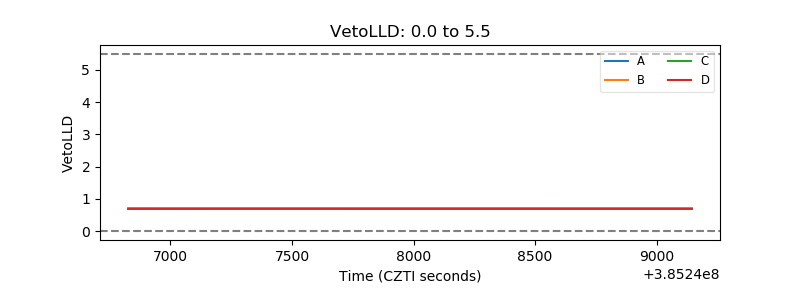 |
| Alpha Counter | 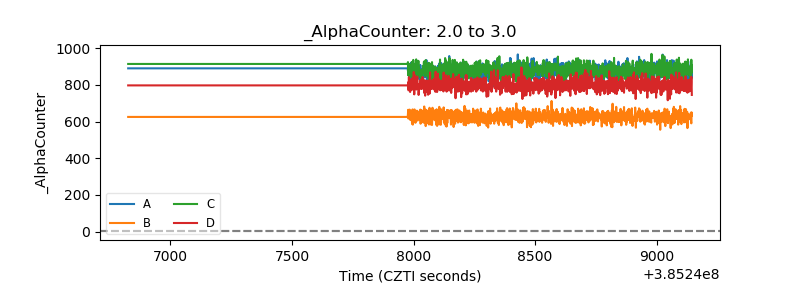 |
| _CPM_Rate | 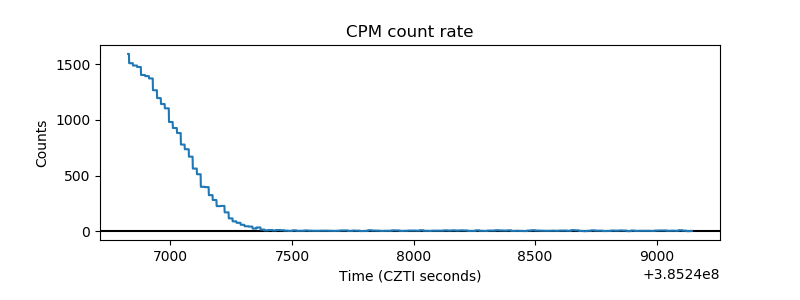 |
| CZT Counter | 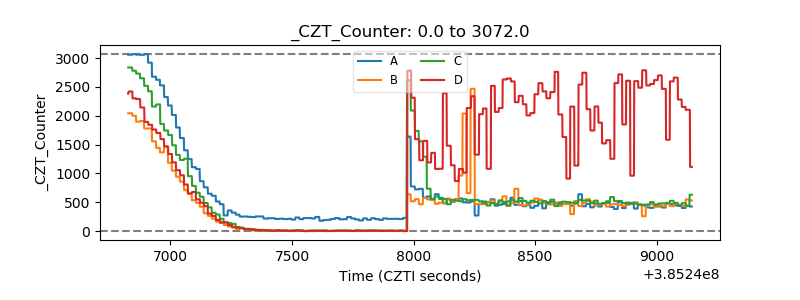 |
| +2.5 Volts monitor |  |
| +5 Volts monitor |  |
| _ROLL_ROT |  |
| _Roll_DEC | 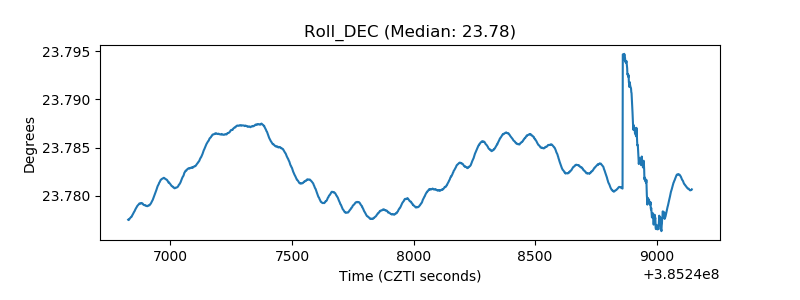 |
| _Roll_RA | 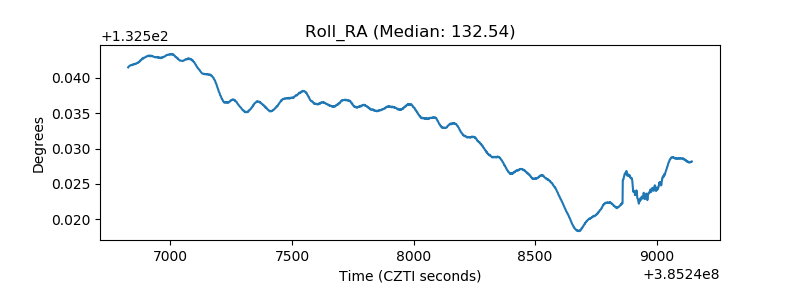 |
| Veto Counter | 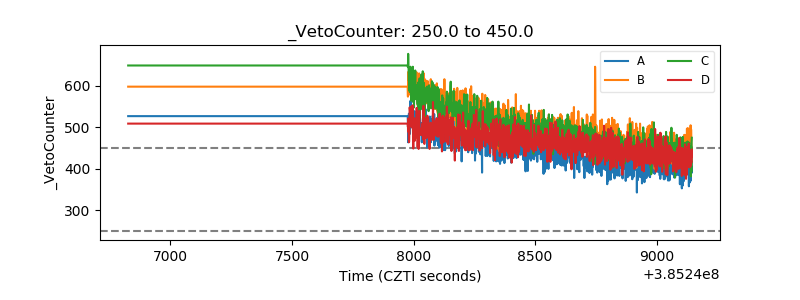 |