| Param | Original file | Final file |
|---|---|---|
| Filename | modeM0/AS1A11_069T01_9000005008cztM0_level2.fits | modeM0/AS1A11_069T01_9000005008cztM0_level2_quad_clean.evt |
| Size (bytes) | 205,850,880 | 123,681,600 |
| Size | 196.3 MB | 118.0 MB |
| Events in quadrant A | 839,272 | 370,305 |
| Events in quadrant B | 1,320,042 | 632,067 |
| Events in quadrant C | 1,360,260 | 620,760 |
| Events in quadrant D | 1,119,488 | 532,281 |
| Mode M0 | |||
|---|---|---|---|
| Quadrant | BADHDUFLAG | Total packets | Discarded packets |
| A | 0 | 132044 | 0 |
| B | 0 | 58048 | 0 |
| C | 0 | 49981 | 0 |
| D | 0 | 84305 | 0 |
| Mode SS | |||
|---|---|---|---|
| Quadrant | BADHDUFLAG | Total packets | Discarded packets |
| A | 0 | 474 | 0 |
| B | 0 | 474 | 0 |
| C | 0 | 474 | 0 |
| D | 0 | 474 | 0 |
| Mode M9 | |||
|---|---|---|---|
| Quadrant | BADHDUFLAG | Total packets | Discarded packets |
| A | 0 | 114 | 0 |
| B | 0 | 114 | 0 |
| C | 0 | 114 | 0 |
| D | 0 | 114 | 0 |
| Quadrant | Total seconds | Saturated seconds | Saturation percentage |
|---|---|---|---|
| A | 23073 | 12455 | 53.980843% |
| B | 23073 | 981 | 4.251723% |
| C | 23073 | 292 | 1.265548% |
| D | 23073 | 2438 | 10.566463% |
Noise dominated data is calculated using 1-second bins in cleaned event files. If a bin has >2000 counts, and if more than 50% of those come from <1% of pixels, then it is considered to be noise-dominated and hence unusable.
| Quadrant | # 1 sec bins | Bins with >0 counts | Bins with >2000 counts | High rate bins dominated by noise | Noise dominated (total time) | Noise dominated (detector-on time) | Marked lightcurve |
|---|---|---|---|---|---|---|---|
| A | 34489 | 22821 | 0 | 0 | 0.00% | 0.00% |  |
| B | 34490 | 23070 | 0 | 0 | 0.00% | 0.00% |  |
| C | 34490 | 23070 | 0 | 0 | 0.00% | 0.00% |  |
| D | 34490 | 23019 | 0 | 0 | 0.00% | 0.00% |  |
Top three noisy pixels from each quadrant. If the there are fewer than three noisy pixels in the level2.evt file, extra rows are filled as -1
| Pixel properties | Quadrant properties | ||||||
|---|---|---|---|---|---|---|---|
| Quadrant | DetID | PixID | Counts | Sigma | Mean | Median | Sigma |
| A | 7 | 110 | 672 | 8.46 | 218 | 206 | 55.1 |
| A | 0 | 29 | 668 | 8.39 | 218 | 206 | 55.1 |
| A | 14 | 95 | 628 | 7.66 | 218 | 206 | 55.1 |
| B | 2 | 9 | 1069 | 10.52 | 349 | 335 | 69.8 |
| B | 3 | 80 | 1010 | 9.67 | 349 | 335 | 69.8 |
| B | 3 | 17 | 893 | 8.0 | 349 | 335 | 69.8 |
| C | 3 | 203 | 1092 | 8.0 | 359 | 338 | 94.2 |
| C | 3 | 202 | 1074 | 7.81 | 359 | 338 | 94.2 |
| C | 3 | 187 | 955 | 6.55 | 359 | 338 | 94.2 |
| D | 10 | 189 | 830 | 6.22 | 320 | 291 | 86.7 |
| D | 6 | 231 | 804 | 5.92 | 320 | 291 | 86.7 |
| D | 10 | 113 | 797 | 5.84 | 320 | 291 | 86.7 |
Histogram calculated using DETX and DETY for each event in the final _common_clean file
| Quadrant A |  |
 |
Quadrant B |
|---|---|---|---|
| Quadrant D |  |
 |
Quadrant C |
| Plot type | Count rate plots | Images |
|---|---|---|
| Comparison with Poisson distribution Blue bars denote a histogram of data divided into 1 sec bins. Red curve is a Poisson curve with rate = median count rate of data. |
 |
 |
| Quadrant-wise count rates Data is divided into 100 sec bins |
 |
|
| Module-wise count rates for Quadrant A Data is divided into 100 sec bins |
 |
 |
| Module-wise count rates for Quadrant B Data is divided into 100 sec bins |
 |
 |
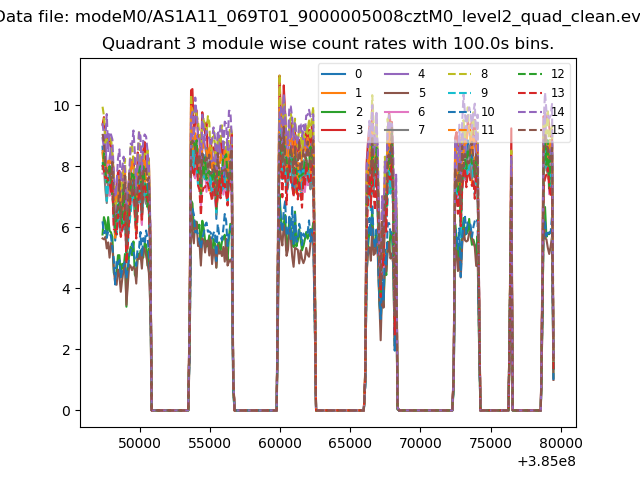
| Module-wise count rates for Quadrant C Data is divided into 100 sec bins |
 |
 |
| Module-wise count rates for Quadrant D Data is divided into 100 sec bins |
 |
 |
| Parameter | Plot |
|---|---|
| CZT HV Monitor |  |
| D_VDD |  |
| Temperature 1 | 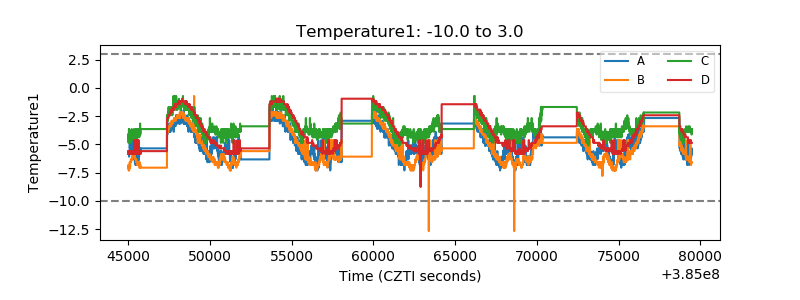 |
| Veto HV Monitor |  |
| Veto LLD |  |
| Alpha Counter |  |
| _CPM_Rate |  |
| CZT Counter |  |
| +2.5 Volts monitor |  |
| +5 Volts monitor |  |
| _ROLL_ROT |  |
| _Roll_DEC |  |
| _Roll_RA |  |
| Veto Counter |  |