| Param | Original file | Final file |
|---|---|---|
| Filename | modeM0/AS1A10_123T09_9000005012cztM0_level2.fits | modeM0/AS1A10_123T09_9000005012cztM0_level2_quad_clean.evt |
| Size (bytes) | 431,458,560 | 463,867,200 |
| Size | 411.5 MB | 442.4 MB |
| Events in quadrant A | 2,635,716 | 2,853,618 |
| Events in quadrant B | 2,478,726 | 2,818,943 |
| Events in quadrant C | 2,590,472 | 2,763,223 |
| Events in quadrant D | 2,167,296 | 2,419,329 |
| Mode SS | |||
|---|---|---|---|
| Quadrant | BADHDUFLAG | Total packets | Discarded packets |
| A | 0 | 950 | 0 |
| B | 0 | 950 | 0 |
| C | 0 | 950 | 0 |
| D | 0 | 950 | 0 |
| Mode M0 | |||
|---|---|---|---|
| Quadrant | BADHDUFLAG | Total packets | Discarded packets |
| A | 0 | 95259 | 0 |
| B | 0 | 113545 | 0 |
| C | 0 | 97764 | 0 |
| D | 0 | 149438 | 0 |
| Mode M9 | |||
|---|---|---|---|
| Quadrant | BADHDUFLAG | Total packets | Discarded packets |
| A | 0 | 161 | 0 |
| B | 0 | 161 | 0 |
| C | 0 | 161 | 0 |
| D | 0 | 161 | 0 |
| Quadrant | Total seconds | Saturated seconds | Saturation percentage |
|---|---|---|---|
| A | 46530 | 74 | 0.159037% |
| B | 46530 | 1857 | 3.990974% |
| C | 46530 | 241 | 0.517945% |
| D | 46530 | 2412 | 5.183752% |
Noise dominated data is calculated using 1-second bins in cleaned event files. If a bin has >2000 counts, and if more than 50% of those come from <1% of pixels, then it is considered to be noise-dominated and hence unusable.
| Quadrant | # 1 sec bins | Bins with >0 counts | Bins with >2000 counts | High rate bins dominated by noise | Noise dominated (total time) | Noise dominated (detector-on time) | Marked lightcurve |
|---|---|---|---|---|---|---|---|
| A | 62599 | 46530 | 0 | 0 | 0.00% | 0.00% |  |
| B | 62599 | 46510 | 0 | 0 | 0.00% | 0.00% |  |
| C | 62599 | 46527 | 0 | 0 | 0.00% | 0.00% |  |
| D | 62599 | 46492 | 0 | 0 | 0.00% | 0.00% |  |
Top three noisy pixels from each quadrant. If the there are fewer than three noisy pixels in the level2.evt file, extra rows are filled as -1
| Pixel properties | Quadrant properties | ||||||
|---|---|---|---|---|---|---|---|
| Quadrant | DetID | PixID | Counts | Sigma | Mean | Median | Sigma |
| A | 7 | 110 | 2163 | 8.91 | 687 | 644 | 170.5 |
| A | 9 | 19 | 2118 | 8.65 | 687 | 644 | 170.5 |
| A | 14 | 95 | 2086 | 8.46 | 687 | 644 | 170.5 |
| B | 2 | 9 | 2166 | 11.9 | 654 | 625 | 129.5 |
| B | 3 | 80 | 1926 | 10.05 | 654 | 625 | 129.5 |
| B | 5 | 232 | 1703 | 8.33 | 654 | 625 | 129.5 |
| C | 1 | 81 | 2117 | 8.36 | 685 | 641 | 176.6 |
| C | 1 | 80 | 2090 | 8.2 | 685 | 641 | 176.6 |
| C | 3 | 187 | 1810 | 6.62 | 685 | 641 | 176.6 |
| D | 7 | 3 | 1678 | 6.7 | 620 | 564 | 166.3 |
| D | 10 | 189 | 1602 | 6.24 | 620 | 564 | 166.3 |
| D | 4 | 160 | 1569 | 6.04 | 620 | 564 | 166.3 |
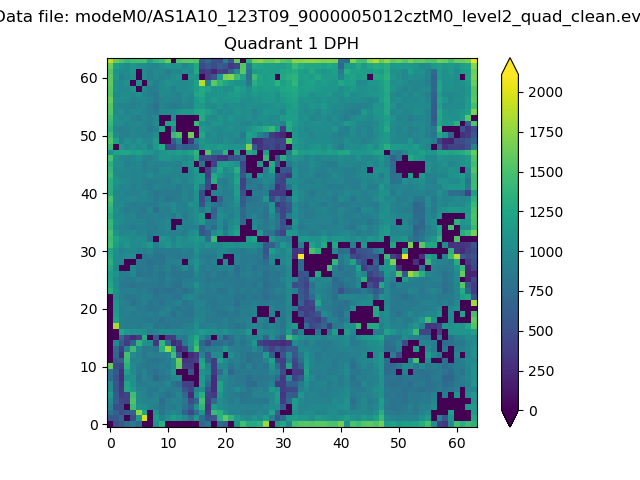
Histogram calculated using DETX and DETY for each event in the final _common_clean file
| Quadrant A |  |
 |
Quadrant B |
|---|---|---|---|
| Quadrant D | 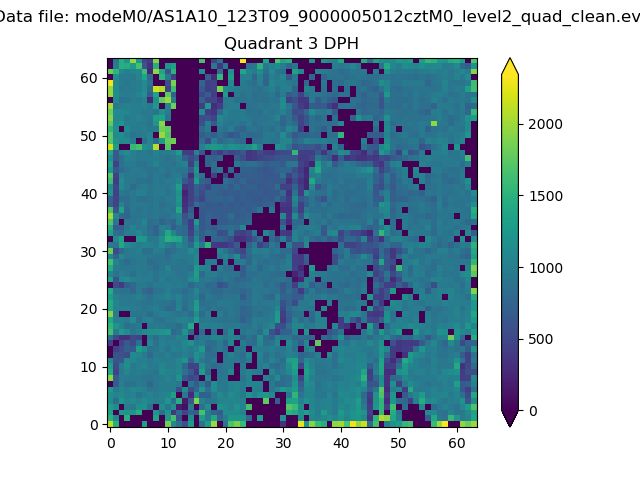 |
 |
Quadrant C |
| Plot type | Count rate plots | Images |
|---|---|---|
| Comparison with Poisson distribution Blue bars denote a histogram of data divided into 1 sec bins. Red curve is a Poisson curve with rate = median count rate of data. |
 |
 |
| Quadrant-wise count rates Data is divided into 100 sec bins |
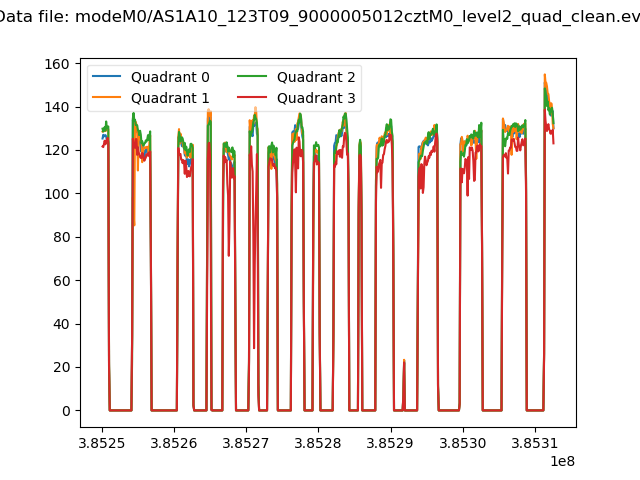 |
|
| Module-wise count rates for Quadrant A Data is divided into 100 sec bins |
 |
 |
| Module-wise count rates for Quadrant B Data is divided into 100 sec bins |
 |
 |
| Module-wise count rates for Quadrant C Data is divided into 100 sec bins |
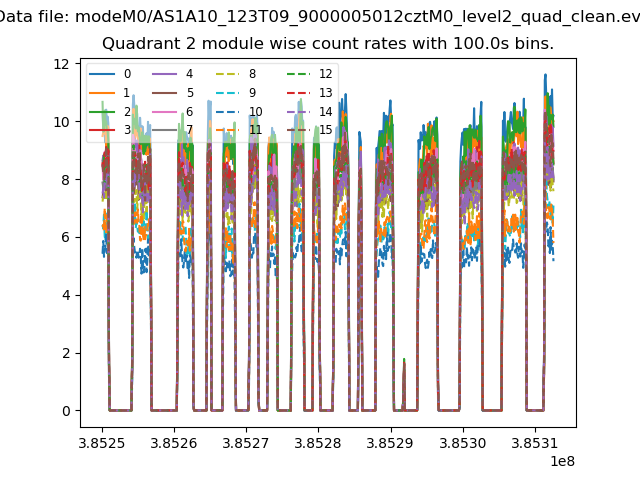 |
 |
| Module-wise count rates for Quadrant D Data is divided into 100 sec bins |
 |
 |
| Parameter | Plot |
|---|---|
| CZT HV Monitor |  |
| D_VDD |  |
| Temperature 1 |  |
| Veto HV Monitor | 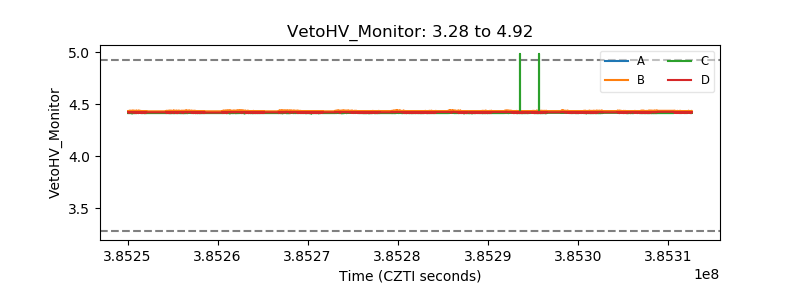 |
| Veto LLD | 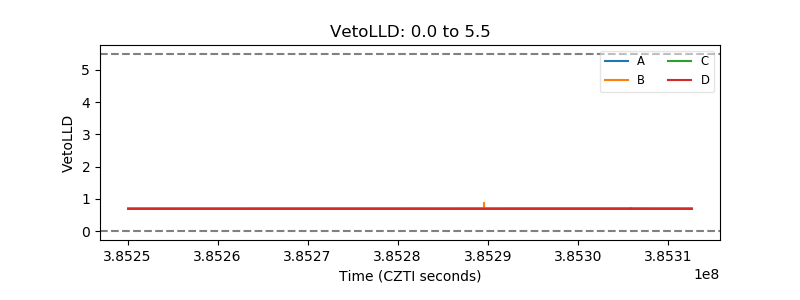 |
| Alpha Counter |  |
| _CPM_Rate |  |
| CZT Counter |  |
| +2.5 Volts monitor |  |
| +5 Volts monitor |  |
| _ROLL_ROT |  |
| _Roll_DEC |  |
| _Roll_RA |  |
| Veto Counter |  |