| Param | Original file | Final file |
|---|---|---|
| Filename | modeM0/AS1A10_123T11_9000005014cztM0_level2.fits | modeM0/AS1A10_123T11_9000005014cztM0_level2_quad_clean.evt |
| Size (bytes) | 440,127,360 | 396,512,640 |
| Size | 419.7 MB | 378.1 MB |
| Events in quadrant A | 2,606,078 | 2,062,838 |
| Events in quadrant B | 2,607,368 | 2,386,942 |
| Events in quadrant C | 2,697,044 | 2,324,088 |
| Events in quadrant D | 2,264,290 | 2,080,529 |
| Mode M0 | |||
|---|---|---|---|
| Quadrant | BADHDUFLAG | Total packets | Discarded packets |
| A | 0 | 125373 | 0 |
| B | 0 | 100980 | 0 |
| C | 0 | 99403 | 0 |
| D | 0 | 135240 | 0 |
| Mode SS | |||
|---|---|---|---|
| Quadrant | BADHDUFLAG | Total packets | Discarded packets |
| A | 0 | 938 | 0 |
| B | 0 | 938 | 0 |
| C | 0 | 938 | 0 |
| D | 0 | 938 | 0 |
| Mode M9 | |||
|---|---|---|---|
| Quadrant | BADHDUFLAG | Total packets | Discarded packets |
| A | 0 | 175 | 0 |
| B | 0 | 175 | 0 |
| C | 0 | 175 | 0 |
| D | 0 | 175 | 0 |
| Quadrant | Total seconds | Saturated seconds | Saturation percentage |
|---|---|---|---|
| A | 45936 | 4202 | 9.147510% |
| B | 45936 | 535 | 1.164664% |
| C | 45936 | 305 | 0.663967% |
| D | 45936 | 1328 | 2.890979% |
Noise dominated data is calculated using 1-second bins in cleaned event files. If a bin has >2000 counts, and if more than 50% of those come from <1% of pixels, then it is considered to be noise-dominated and hence unusable.
| Quadrant | # 1 sec bins | Bins with >0 counts | Bins with >2000 counts | High rate bins dominated by noise | Noise dominated (total time) | Noise dominated (detector-on time) | Marked lightcurve |
|---|---|---|---|---|---|---|---|
| A | 63327 | 45887 | 0 | 0 | 0.00% | 0.00% |  |
| B | 63327 | 45936 | 0 | 0 | 0.00% | 0.00% |  |
| C | 63327 | 45934 | 0 | 0 | 0.00% | 0.00% |  |
| D | 63327 | 45866 | 0 | 0 | 0.00% | 0.00% |  |
Top three noisy pixels from each quadrant. If the there are fewer than three noisy pixels in the level2.evt file, extra rows are filled as -1
| Pixel properties | Quadrant properties | ||||||
|---|---|---|---|---|---|---|---|
| Quadrant | DetID | PixID | Counts | Sigma | Mean | Median | Sigma |
| A | 9 | 19 | 2119 | 8.8 | 680 | 639 | 168.2 |
| A | 7 | 110 | 2066 | 8.48 | 680 | 639 | 168.2 |
| A | 0 | 29 | 1963 | 7.87 | 680 | 639 | 168.2 |
| B | 2 | 9 | 2264 | 11.51 | 691 | 657 | 139.6 |
| B | 3 | 80 | 2058 | 10.04 | 691 | 657 | 139.6 |
| B | 2 | 8 | 1828 | 8.39 | 691 | 657 | 139.6 |
| C | 1 | 81 | 2224 | 8.62 | 712 | 672 | 180.1 |
| C | 1 | 80 | 2111 | 7.99 | 712 | 672 | 180.1 |
| C | 3 | 202 | 2082 | 7.83 | 712 | 672 | 180.1 |
| D | 10 | 113 | 1676 | 6.24 | 650 | 595 | 173.2 |
| D | 10 | 189 | 1654 | 6.11 | 650 | 595 | 173.2 |
| D | 7 | 3 | 1652 | 6.1 | 650 | 595 | 173.2 |
Histogram calculated using DETX and DETY for each event in the final _common_clean file
| Quadrant A |  |
 |
Quadrant B |
|---|---|---|---|
| Quadrant D |  |
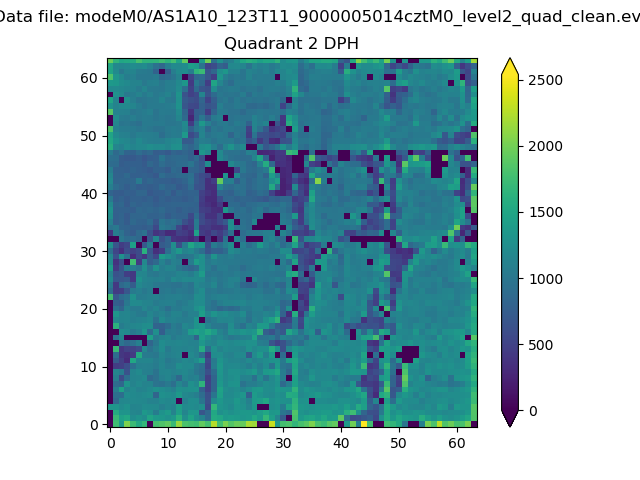 |
Quadrant C |
| Plot type | Count rate plots | Images |
|---|---|---|
| Comparison with Poisson distribution Blue bars denote a histogram of data divided into 1 sec bins. Red curve is a Poisson curve with rate = median count rate of data. |
 |
 |
| Quadrant-wise count rates Data is divided into 100 sec bins |
 |
|
| Module-wise count rates for Quadrant A Data is divided into 100 sec bins |
 |
 |
| Module-wise count rates for Quadrant B Data is divided into 100 sec bins |
 |
 |
| Module-wise count rates for Quadrant C Data is divided into 100 sec bins |
 |
 |
| Module-wise count rates for Quadrant D Data is divided into 100 sec bins |
 |
 |
| Parameter | Plot |
|---|---|
| CZT HV Monitor |  |
| D_VDD |  |
| Temperature 1 |  |
| Veto HV Monitor |  |
| Veto LLD |  |
| Alpha Counter |  |
| _CPM_Rate |  |
| CZT Counter | 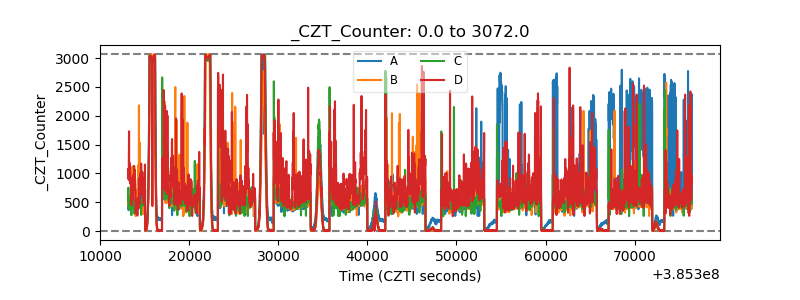 |
| +2.5 Volts monitor |  |
| +5 Volts monitor |  |
| _ROLL_ROT |  |
| _Roll_DEC | 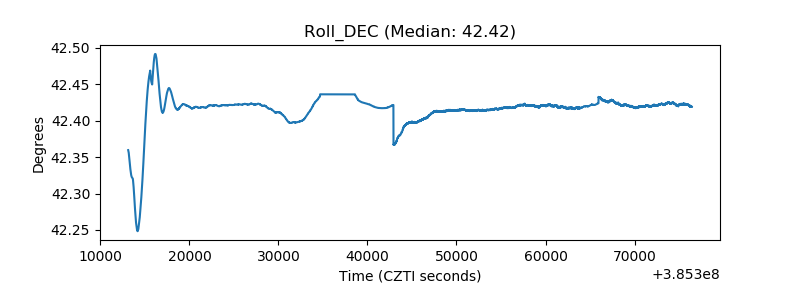 |
| _Roll_RA |  |
| Veto Counter |  |